The Young Suns Exoplanet Survey: Detection of a wide orbit planetary mass companion to a solar-type Sco-Cen member††thanks: Based on observations collected at the European Organisation for Astronomical Research in the Southern Hemisphere under ESO programs 099.C-0698(A), 0103.C-0371(A), and 2103.C-5012(A,B).
Abstract
The Young Suns Exoplanet Survey (YSES) consists of a homogeneous sample of 70 young, solar-mass stars located in the Lower Centaurus-Crux subgroup of the Scorpius-Centaurus association with an average age of Myr. We report the detection of a co-moving companion around the K3IV star TYC 8998-760-1 (2MASSJ13251211-6456207) that is located at a distance of pc using SPHERE/IRDIS on the VLT. Spectroscopic observations with VLT/X-SHOOTER constrain the mass of the star to and an age of Myr. The companion TYC 8998-760-1 b is detected at a projected separation of 1.71″, which implies a projected physical separation of 162 au. Photometric measurements ranging from to band provide a mass estimate of by comparison to BT-Settl and AMES-dusty isochrones, corresponding to a mass ratio of with respect to the primary. We rule out additional companions to TYC 8998-760-1 that are more massive than and farther than 12 au away from the host. Future polarimetric and spectroscopic observations of this system with ground and space based observatories will facilitate testing of formation and evolution scenarios shaping the architecture of the circumstellar environment around this ’young Sun’.
keywords:
planets and satellites: detection – planets and satellites: formation – astrometry – stars: solar-type – stars: pre-main-sequence – stars: individual: TYC 8998-760-11 Introduction
With the advent of extreme adaptive optics (AO) assisted, high-contrast imaging instruments at the current generation of 8-m class telescopes, the search and characterisation of directly imaged extra-solar planets has gained momentum. The large scale guaranteed time observing campaigns that are currently carried out with these instruments such as the Gemini Planet Imager Exoplanet Survey (GPIES; Macintosh et al., 2014) or the SpHere INfrared survey for Exoplanets (SHINE; Chauvin et al., 2017a), can constrain the occurrence rates of gas giant companions in wide orbits (Nielsen et al., 2019). In addition to these ongoing statistical evaluations, both surveys have already produced many high-impact results by new detections of giant companions (e.g. Macintosh et al., 2015; Chauvin et al., 2017a; Keppler et al., 2018) as well as spectral and orbital characterisations of established members among almost twenty directly imaged extra-solar planets (e.g. Galicher et al., 2014; Wang et al., 2016, 2018; Greenbaum et al., 2018; Samland et al., 2017; Chauvin et al., 2018; Müller et al., 2018; Cheetham et al., 2019; Lagrange et al., 2019).
Most of these directly imaged companions, however, are detected around stars that are more massive than the Sun. To obtain a statistically significant estimate on the occurrence rates of giant sub-stellar companions on wide orbits around solar-type stars, we started the Young Suns Exoplanet Survey (YSES; Bohn et al. in prep.). YSES targets a homogeneous sample of 70 young, solar-type stars located in the Lower-Centaurus Crux subgroup of the Scorpius-Centaurus association (Sco-Cen; de Zeeuw et al., 1999). Based on common kinematics and activity signatures, all YSES targets have been confirmed by Pecaut & Mamajek (2016) as members of the LCC; Gaia DR2 parallaxes and proper motions corroborate this membership status (Gaia Collaboration et al., 2018). In addition to the small range of stellar masses, the YSES targets are homogeneous in terms of stellar ages and distances. This enables self-consistent reference star differential imaging (RDI; Smith & Terrile, 1984; Lafrenière et al., 2007) to increase the contrast performance at close separations (Bohn et al. in prep.) and minimises uncertainties on the properties of identified companions due to poorly constrained system ages.
One object within our sample is TYC 8998-760-1 (2MASSJ13251211-6456207) at a distance of pc (Bailer-Jones et al., 2018; Gaia Collaboration et al., 2018). Based on new observations of the system we revised the main stellar properties (Section 4.1) as summarised in Table 1.
| Parameter | Value | Reference(s) |
| Main identifier | TYC 8998-760-1 | (1) |
| 2MASS identifier | J13251211-6456207 | (2) |
| Right Ascension (J2000) | 13:25:12.13 | (3) |
| Declination (J2000) | -64:56:20.69 | (3) |
| Spectral Type | K3IV | (4,5) |
| Mass [] | (5) | |
| [K] | (5) | |
| [dex] | (5) | |
| Age [Myr] | (5) | |
| Parallax [mas] | (3) | |
| Distance [pc] | (6) | |
| Proper motion (RA) [mas / yr] | (3) | |
| Proper motion (Dec) [mas / yr] | (3) | |
| [mag] | (7) | |
| [mag] | (7) | |
| [mag] | (7) | |
| [mag] | (2) | |
| [mag] | (2) | |
| [mag] | (2) | |
| [mag] | (8) | |
| [mag] | (8) | |
| [mag] | (8) | |
| [mag] | (8) |
In Section 2 of this article we describe the observations that we carried out on TYC 8998-760-1 and in Section 3 we explain our data reduction strategies. In Section 4 we illustrate how we detect a co-moving planetary mass companion around TYC 8998-760-1 and in Section 5 we discuss the derived properties of this companion. The conclusions of the article are presented in Section 6.
2 Observations
Our observations of the system can be classified by two categories: (i) medium-resolution spectrographic observations of the host with VLT/X-SHOOTER and (ii) high-contrast imaging data collected with VLT/SPHERE and VLT/NACO. Whereas the former data aims for a precise characterisation of the host star, the latter observations facilitate an accurate astrometric and photometric characterisation of the companion around TYC 8998-760-1.
2.1 X-SHOOTER
We observed TYC 8998-760-1 with X-SHOOTER (Vernet et al., 2011) on the night of May 23, 2019, in excellent atmospheric conditions with an average seeing of 054 (PI: A. Bohn; ESO ID: 2103.C-5012(A)). X-SHOOTER was operated in SLT mode providing medium resolution spectra from nm. We chose slit widths of 08, 04, and 04 with corresponding exposure times of 210 s, 120 s, and s for UVB, VIS, and NIR111The individual integration time for the NIR arm was 80 s and each exposure is composed of 3 sub-integrations (NDIT). subsystems, respectively. Applying two nodding cycles along the slit for background subtraction at NIR wavelengths, yielded total integration times of 840 s, 480 s, and 960 s for the three subsystems. For flux calibration we took additional spectra with a wide slit configuration of 5″and exposure times of 15 s, 60 s and s for UVB, VIS, and NIR arm, respectively.
2.2 SPHERE
| Observation date | Instrument | Mode | Filter | FWHM | NEXPNDITDIT | ||||
|---|---|---|---|---|---|---|---|---|---|
| (yyyy-mm-dd) | (mas) | (11s) | (°) | (″) | (ms) | ||||
| 2017-07-05 | SPHERE | CI | 46.7 | 4232 | 1.11 | 1.12 | 1.54 | 3.15 | |
| 2017-07-05 | SPHERE | CI | 52.3 | 4132 | 0.50 | 1.22 | 1.52 | 2.90 | |
| 2019-03-17 | SPHERE | CI | 64.2 | 6232 | 2.26 | 1.11 | 1.31 | 3.15 | |
| 2019-03-23 | SPHERE | DBI | 37.2 / 37.9 | 4364 | 3.84 | 0.41 | 1.38 | 9.30 | |
| 2019-03-23 | SPHERE | DBI | 40.1 / 41.8 | 4364 | 3.72 | 0.40 | 1.41 | 10.75 | |
| 2019-03-23 | SPHERE | DBI | 47.5 / 49.5 | 4364 | 3.60 | 0.43 | 1.44 | 10.83 | |
| 2019-03-23 | SPHERE | DBI | 60.2 / 63.6 | 4364 | 3.45 | 0.53 | 1.49 | 8.75 | |
| 2019-05-18 | NACO | CI | 125.0 | 306000.2 | 22.99 | 0.88 | 1.32 | 2.32 | |
| 2019-06-03 | NACO | CI | 131.6 | 1129000.045 | 50.15 | 0.78 | 1.33 | 3.69 |
Notes. The applied mode is either classical imaging (CI) with a broadband filter or dual-band imaging (DBI) with two intermediate band filters simultaneously. FWHM denotes the full width at half maximum that we measure from the average of the non-coronagraphic flux images that are collected for each filter. For NACO data these are equivalent to the science exposures of the star. NEXP describes the number of exposures, NDIT is the number of sub-integrations per exposure and DIT is the detector integration time of an individual sub-integration. denotes the amount of parallactic rotation during the observation and , , and represent the average seeing, airmass, and coherence time, respectively.
The first part of our high-contrast imaging observations were carried out with SPHERE (Beuzit et al., 2019), mounted at the Naysmith platform of Unit 3 telescope (UT3) at ESO’s VLT. SPHERE is assisted by the SAXO extreme AO system (Fusco et al., 2006) to deliver diffraction limited imaging data. We used the infrared dual-band imager and spectrograph (IRDIS; Dohlen et al., 2008) in classical imaging (CI) and dual-band imaging (DBI; Vigan et al., 2010) modes. To block the stellar flux and to enable longer exposure times we used SPHERE’s apodized Lyot coronagraph (Soummer, 2005). We obtained additional center frames by applying a sinusoidal pattern to the instrument’s deformable mirror to determine the position of the star behind the coronagraph. This creates four waffle spots around the star that can be used for precise centration222See description in the latest version of the SPHERE manual: https://www.eso.org/sci/facilities/paranal/instruments/sphere/doc.html. For photometric calibration we took additional flux images by offsetting the stellar point spread function (PSF) from the coronagraphic mask and used a neutral density filter to avoid saturation of the detector. All observations were carried out in pupil tracking mode to enable post-processing based on RDI within the scope of the survey (Bohn et al. in prep.).
We took short first epoch observations (Night: July 5, 2017; PI: M. Kenworthy; ESO ID: 099.C-0698(A)) applying a broadband filter in J and H band333All filter profiles can be found at https://www.eso.org/sci/facilities/paranal/instruments/sphere/inst/filters.html. For second epoch observations (Night: March 17, 2019; PI: A. Bohn; ESO ID: 0103.C-0371(A)), we scheduled a long sequence using the instrument’s integral field spectrograph (IFS; Claudi et al., 2008) in extended mode in combination with IRDIS/CI in band. The IFS provides low resolution spectra with a resolving power of ranging from to band for the innermost field of view (173173) around the star. Due to degrading weather conditions the observation was terminated after 384 s. In this aborted sequence, however, we detected a co-moving companion that was located outside the IFS’s field of view. We thus rearranged the observational setup aiming for optimal photometric characterisation of this companion. These second epoch observations were obtained on the night of March 23, 2019, integrating for 768 s with each of the , , , and DBI filter combinations. A detailed description of the observations, applied filters, and weather conditions is presented in Table 2.
2.3 NACO
To constrain the thermal infrared spectral energy distribution (SED) of the companion, we took additional and band data (PI: A. Bohn; ESO ID: 2103.C-5012(B)) with VLT/NACO (Lenzen et al., 2003; Rousset et al., 2003). A summary of the observational parameters is presented in Table 2. The instrument was operated in pupil-stabilised imaging mode and the detector readout was performed in cube mode to store each individual sub-integration. As the star is faint at the observed wavelengths, no coronagraph was used. We chose integrations times of 0.2 s and 0.045 s for the observations in and band, respectively, resulting in 3600 s and 4536 s total time on target. In both configurations the science frames are unsaturated and the individual pixel counts are in the linear regime of the detector, so no additional flux calibration frames were required.
3 Data reduction
3.1 X-SHOOTER data
The X-SHOOTER data were reduced using the ESO pipeline (Modigliani et al., 2010) v3.2.0 run through the Reflex workflow. The pipeline includes bias and flat-field correction, wavelength calibration, spectrum rectification, flux calibration using a standard star observed in the same night, and spectrum extraction. As described in Section 2, the target was observed with a set of wide slits of 5″, which have no slit losses, and another set of narrower slits providing higher spectral resolution. After the standard pipeline flux calibration, the data obtained with the wider slits shows good agreement in the flux between the three arms. The spectra obtained with the narrower slits show a lower flux than the ones with the wide slits by a factor 1.7, 2.7, and 2.5 in the three arms, respectively. The narrower slit spectra were adjusted in flux by this ratio in the UVB and NIR arms, and by a wavelength dependent ratio in the VIS arm to match the wide slit spectra. This final flux calibrated spectrum is in good agreement with previous non-simultaneous photometry. The spectra were corrected for telluric absorption using the MOLECFIT tool (Smette et al., 2015; Kausch et al., 2015).
3.2 SPHERE data
The SPHERE data were reduced with a custom processing pipeline based on the latest version of the PynPoint package (version 0.8.1; Stolker et al., 2019). This includes flatfielding, sky subtraction, and bad pixel correction by replacing bad pixels with the average value in a 55 pixels sized box around the corresponding location. We corrected for the instrumental anamorphic distortion in direction according to the description in the SPHERE manual. For the data obtained in CI mode, we averaged both detector PSFs per exposure to minimise the effect of bad pixels. Since the companion is not contaminated by stellar flux, we did not perform any advanced PSF subtraction. We simply derotated the individual frames according to the parallactic rotation of the field and the static instrumental offset angle of 13599 required for correct alignment of pupil and Lyot stop, and we used the standard astrometric solution for IRDIS (Maire et al., 2016). This provides a general true north correction of and plate scales in the range of 12.2830.01 mas per pixel and mas per pixel depending on the applied filter.
3.3 NACO data
For reduction of the NACO data, we used the same framework as applied for SPHERE including flatfielding, dark subtraction, and bad pixel correction. There is a high readout noise that decreases exponentially throughout the cube, so we removed the first 5 frames of each cube. The background subtraction was performed by an approach based on principal component analysis (PCA) as described in Hunziker et al. (2018) making use of the three distinct dither positions on the detector. We masked a region of 055 around the star and fitted 60 principal components to model sky and instrumental background. After subtraction of this model, we aligned the stellar PSFs by applying a cross-correlation in the Fourier domain (Guizar-Sicairos et al., 2008) and centred the aligned images by fitting a two-dimensional Gaussian function to the average of the stack. Frame selection algorithms then reject all frames which deviate by more than 2 from the median flux within (i) a background annulus with inner and outer radii of 16 and 19 and (ii) an aperture with the size of the average PSF FWHM, resulting in 10.45% and 10.05% of our and band data being removed from the subsequent analysis. All frames were derotated according to their parallactic angle and median combined. As we have a sufficient amount of parallactic rotation for both datasets, we tested angular differential imaging (ADI; Marois et al., 2006) techniques for further analysis steps as described in the following Section. For astrometric calibration of the results we adapted a plate scale of mas per pixel and a true north correction of according to Musso Barcucci et al. (2019) and Launhardt et al. (in prep.).
4 Results and analysis
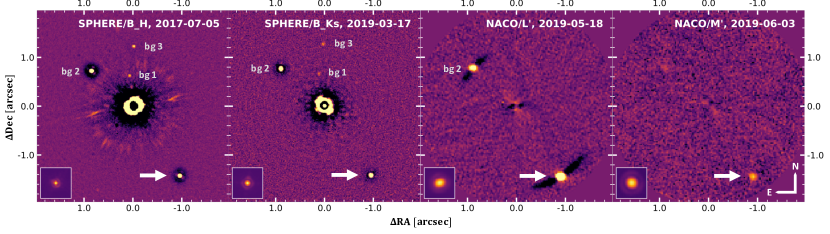
Our first epoch observation with SPHERE reveals 16 off-axis point sources around TYC 8998-760-1 within the IRDIS field of view (110125). We present the innermost 2″2″for several epochs and wavelengths in Figure 1. All point sources in the field of view are consistent with background sources at 5 significance with the exception of the point source south-west of the star (highlighted by the white arrow) which has a proper motion consistent with being a co-moving companion (see analysis in Section 4.2.1). This hypothesis is strongly supported by the very red colour of this object in comparison to the other sources in the field of view in Figure 1. In order to constrain the properties of this companion, the properties of the host star - especially its age - need to be determined first.
4.1 Stellar properties
We used two approaches to determine the stellar properties of the host star. In both cases we assumed an object distance of pc based on the Gaia DR2 parallax (Gaia Collaboration et al., 2018; Bailer-Jones et al., 2018). Our first method was based on the X-SHOOTER spectrum and follows the analysis described in Manara et al. (2013b). We performed a fit of the full spectrum using a library of empirical photospheric templates of pre-main sequence stars presented by Manara et al. (2013a); Manara et al. (2017). The best fit is obtained using the template of the K4 star RXJ1538.6-3916 with an extinction of mag. This converts to an effective temperature of K and a luminosity of dex. Comparison against isochronal tracks of Baraffe et al. (2015) - hereafter B15 - provides a stellar mass of and an age of 15 5 Myr. We derived an independent age estimate of the system based on the Lithium-absorption equivalent width of mÅ as measured in the X-SHOOTER spectrum. As presented in panel (a) of Figure 2, this provides an age estimate of Myr when compared to the B15 tracks.
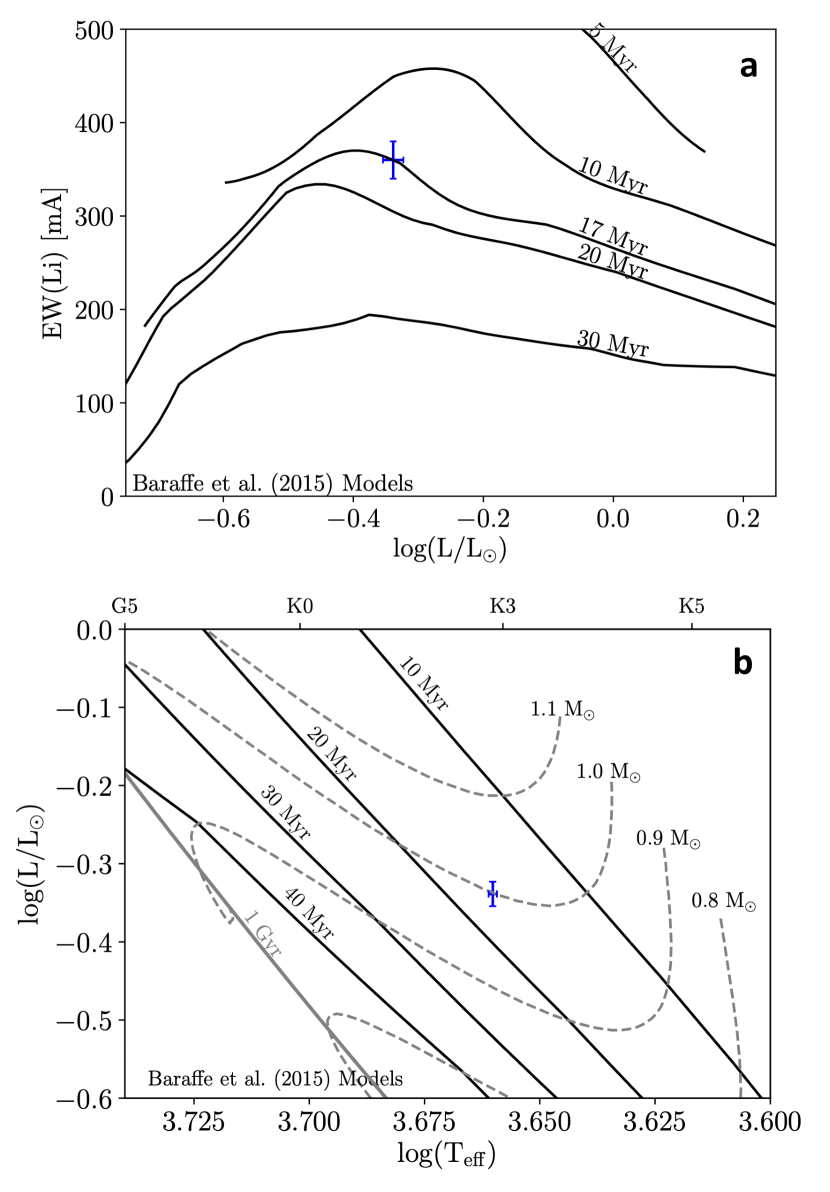
The Lithium abundances of the isochrones were converted to Lithium-absorption equivalent widths adopting an initial lithium abundance of (Lodders et al., 2009) and using the tables presented in Soderblom et al. (1993).
An additional check for the stellar properties is by using the photometry. To constrain the stellar properties of TYC 8998-760-1 we used existing photometry measurements from Tycho-2 (Høg et al., 2000), APASS (Henden & Munari, 2014), Gaia (Gaia Collaboration et al., 2018), 2MASS (Cutri et al., 2012a), and WISE (Cutri et al., 2012b) catalogues. Consistent with our previous results, we assumed a negligible extinction and fitted a grid of BT-Settl models (Baraffe et al., 2015) with the abundances from Caffau et al. (2011) to the data. This fit provides an effective temperature of K and a luminosity of dex. Comparison to the B15 pre-main sequence isochrones plotted in an Hertzsprung-Russell (HR) diagram as presented in panel (b) of Figure 2, results in a stellar mass of and a system age of Myr.
The derived stellar properties for both methods are consistent within their uncertainties. In Table 1 we cite the more precise mass, temperature and luminosity estimates for TYC-8998-760-1. As the determined effective temperature suggests a spectral type of K3 instead of K4 when comparing it to the scale presented in Pecaut & Mamajek (2013), we adopt the former for our final classification. For the age of the system, we apply the average of Myr based on our Lithium-absorption and HR diagram analysis. This estimate is in good agreement with the average age of LCC of Myr as determined by Pecaut & Mamajek (2016).
To accurately characterise the companion around TYC 8998-760-1, we determined the magnitudes of the primary in the applied SPHERE and NACO filters. For all wavelengths shorter than 2500 nm (i.e. all SPHERE filters) we measured these fluxes directly from our calibrated X-SHOOTER spectrum. To assess the stellar magnitudes in and bands, we used the BT-Settl model instead that we have previously fitted to the available photometric data. The results of this analysis are presented in Table 4.
4.2 Companion properties
We extracted astrometry and magnitude contrasts of the companion for all epochs using the SimplexMinimizationModule of PynPoint as described in Stolker et al. (2019). This injects a negative artificial companion into each individual science frame aiming to iteratively minimize the curvature in the final image around the position of the companion using a simplex-based Nelder-Mead algorithm (Nelder & Mead, 1965). For the SPHERE data we obtained this template PSF from the non-coronagraphic flux images and for the NACO data this negative artificial companion was modelled from the unsaturated stellar PSF of the science data itself. For the latter case we have an individual template for each science frame that directly accounts for the different PSF shapes due to wind effects or varying AO performance. As the parallactic rotation of the SPHERE datasets is not sufficient to perform ADI-based post-processing strategies, we derotated and median combined the images. For both NACO datasets, we performed ADI+PCA (Amara & Quanz, 2012; Soummer et al., 2012) and subtracted one principal component from the images. We then applied a Gaussian filter with a kernel size equivalent to the pixel scale to smooth pixel to pixel variations before evaluating the curvature in the residual image in an aperture with a radius of one FWHM around the companion.
When studying the residuals after the minimization, it became clear that this analysis method is non-optimal for determining the companion’s astrometry and photometry in the SPHERE data. Whereas in the NACO data the residuals around the companion agree with the average background noise at the same radial separation, the minimisation does not provide similarly smooth results for the SPHERE data. We attribute this to the different shapes of flux and companion PSFs collected under differing atmospheric conditions.
We therefore proceeded with aperture photometry to extract the magnitude contrast of the companion in the SPHERE data and the astrometry was calibrated by a two-dimensional Gaussian fit, instead. We chose circular apertures with a radius equivalent to the average FWHM measured in the flux images, and used identical apertures around the position of the companion that was determined by the Gaussian fit. For an accurate estimate of the background noise at this position, we placed several apertures at the same radial separation from the primary. The average flux within these background apertures was subtracted from the measured flux of the companion. As a sanity check, we applied this aperture photometry approach also to the NACO data. The resulting astrometry and photometry of this analysis is consistent with the previously derived values within their uncertainties.
4.2.1 Astrometric analysis
The astrometry of the companion for several epochs and filters is presented in Table 3.
| Epoch | Filter | Separation | PA |
|---|---|---|---|
| (yyyy-mm-dd) | (″) | (°) | |
| 2017-07-05 | |||
| 2019-03-17 | |||
| 2019-03-23 | |||
| 2019-03-23 | |||
| 2019-03-23 | |||
| 2019-03-23 | |||
| 2019-03-23 | |||
| 2019-03-23 | |||
| 2019-03-23 | |||
| 2019-03-23 | |||
| 2019-05-18 | |||
| 2019-06-03 |
As the companion is visible in a single exposure, we extracted its radial separation and position angle directly in the reduced center frames to achieve highest astrometric accuracy. In these frames we can simultaneously fit the position of the companion and the star behind the coronagraph using the four waffle spots. We thus do not include the band measurements in Table 3, as these data were collected without any center frames.
The extracted radial separations and position angles of TYC 8998-760-1 b are mostly consistent within their corresponding uncertainties. Only in the NACO data we measure a systematically larger position angle compared to the SPHERE astrometry. This systematic effect has the same magnitude as the applied true north correction of adapted from Musso Barcucci et al. (2019). Due to the very consistent SPHERE measurements it is thus likely that this correction factor - which Musso Barcucci et al. (2019) present for reference epochs from 2016 to 2018 - is not valid for our NACO data collected in 2019. This marginal inconsistency, however, does not affect the further companionship assessments of the object.
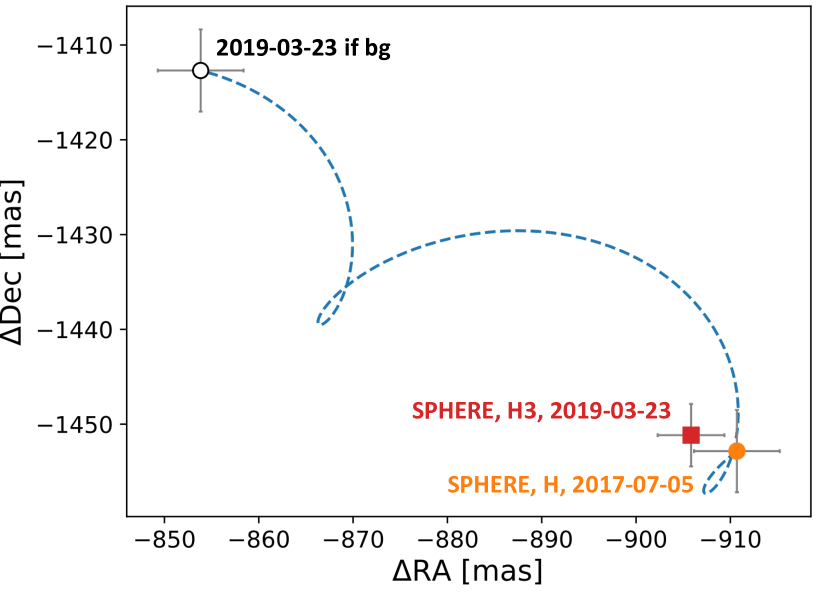
Analysis towards common proper motion shows that TYC 8998-760-1 b is clearly co-moving with its host. As visualised in Figure 3, the relative position of the companion is incompatible with a stationary background object at a significance considerably greater than 5.
A similar study was performed for the 15 remaining point sources detected around TYC 8998-760-1. As presented in Appendix A their astrometry is highly consistent with background contaminants, instead.
4.2.2 Photometric analysis
We present the magnitude contrasts of the companion for all filters in Table 4.
| Filter | Magnitude star | Mag | Flux companion |
|---|---|---|---|
| (mag) | (mag) | () | |
| Y2 | 9.47 | ||
| Y3 | 9.36 | ||
| J2 | 9.13 | ||
| J3 | 8.92 | ||
| H2 | 8.46 | ||
| H3 | 8.36 | ||
| K1 | 8.31 | ||
| K2 | 8.28 | ||
| J | 9.02 | ||
| H | 8.44 | ||
| 8.29 | |||
| L’ | 8.27 | ||
| M’ | 8.36 |
The SPHERE broadband photometry is rather inconsistent with the dual band measurements, especially in and band. This is mainly caused by the very variable observing conditions during these observations. During the SPHERE band observations seeing and coherence time between flux and science images degraded from 108 to 122 and 3.2 ms to 2.9 ms, respectively. In band the conditions were even worse as the seeing increased from 074 to 111 and the coherence time dropped from 4.5 ms to 3.5 ms between flux and science exposures. Due to these very unstable atmospheric conditions the AO performance was highly variable during these sequences. Although these fluctuations in flux are included in our statistical uncertainties, the degrading AO performance naturally causes an underestimation of the companion’s flux in the science images, leading to an overestimation of the derived magnitude contrast. Without any additional knowledge of the actual AO performance, it is however not straightforward to correct for this effect. In our further analysis we thus focus on the results originating from the SPHERE DBI observations that were obtained in more stable weather conditions (see Table 2). These variable weather conditions, however, do not affect the astrometric measurements on TYC 8998-760-1 b that we present in Section 4.2.1. As the companion’s position angle and separation is directly extracted from the SPHERE center frames, our accuracy is only limited by the precision of the Gaussian fits to the waffle spots and the companion’s PSF in these individual frames.
To model the companion’s SED we converted the apparent magnitudes to physical fluxes using VOSA (Bayo et al., 2008). These measurements are presented in Table 4 and visualised as red squares in Figure 4. To characterise the companion, we fitted a grid of BT-Settl models (Allard et al., 2012) to the photometric data by a linear least squares approach. In agreement with our characterisation of the primary we assumed a negligible extinction and focused on solar metallicity models. We constrained our input parameter space to effective temperatures between 1200 K and 2500 K and surface gravities in the range of 3.0 dex to 5.5 dex with step sizes of 100 K and 0.5 dex, respectively. The flux for each model was integrated over the photometric band passes of the applied filters and we determined the scaling that minimises the Euclidean norm of the residual vector. We compared the resulting residuals for all models from the grid and chose the one that yielded the minimum residual as the best fit. This is provided by a model with an effective temperature of 1700 K and a surface gravity of dex as presented by the blue curve in Figure 4.
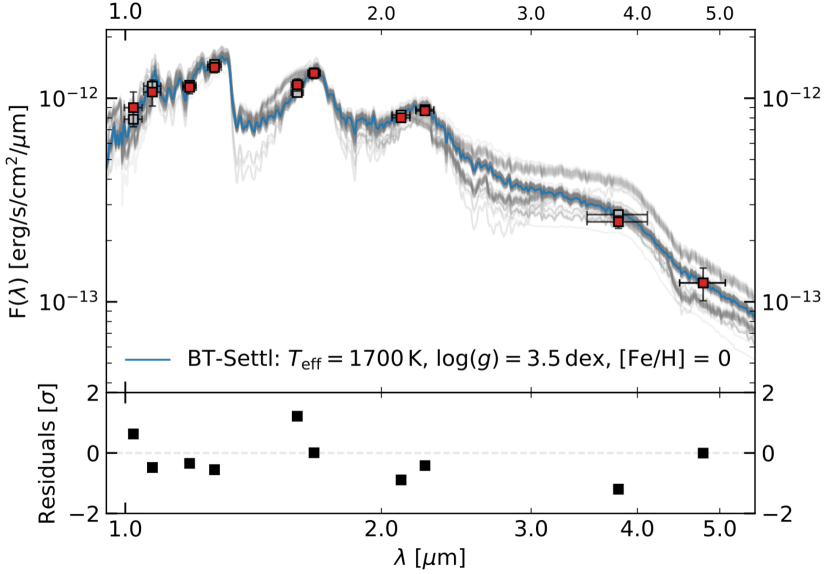
To evaluate the the impact of the photometric uncertainties on the resulting best fit model, we repeated the fitting procedure times, drawing the fitted fluxes from a Gaussian distribution centered around the actual data point and using the uncertainty as standard deviation of the sampling. In Figure 4, we show 200 randomly selected best fit models from this Monte Carlo approach as indicated by the grey curves. The posterior distributions for the best-fit parameters are presented in Figure 5.
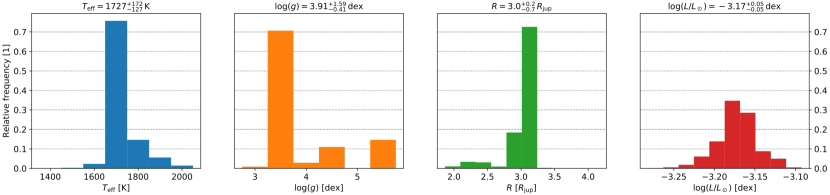
This procedure provides estimates of K, , , and dex for the companion’s effective temperature, surface gravity, radius, and luminosity, respectively. The uncertainties of these values are determined as the 2.5 and 97.5 percentiles of the corresponding posterior distributions. Both radius and luminosity depend on the distance to the system, which is constrained by Gaia DR2 astrometry. The radius estimate arises from the scaling factor that needs to be applied to the model and the luminosity is obtained by integrating the resulting model over the entire wavelength range. We note that the predicted radius is larger than the usual value of that is associated with gas giant planets and brown dwarfs (e.g. Chabrier et al., 2009). This unexpected property is discussed in Section 5.1.
4.2.3 Companion mass
To convert the derived photometric properties of the companion to a mass, we used BT-Settl isochrones (Allard et al., 2012) that we evaluated at the derived system age of 16.71.4 Myr. As we only fitted photometric data that does not resolve any lines or molecular features, the object’s surface gravity is not strongly constrained from our analysis. We base our mass estimate on the better constrained effective temperature and luminosity of the companion instead. Comparing these values to BT-Settl isochrones yields masses of and for measured temperature and luminosity, respectively. We obtained similar mass estimates when using the AMES-dusty isochrones (Allard et al., 2001; Chabrier et al., 2000) instead of the the BT-Settl models.
To test these results, we converted the absolute magnitudes of the companion to mass estimates using the BT-Settl isochones evaluated at the corresponding band passes444The models were downloaded from http://perso.ens-lyon.fr/france.allard/.. For the SPHERE data this gives values consistent with our previous mass estimates in the range of 14 to 16 . In the thermal infrared we obtain masses of approximately 18 and 25 for the absolute and magnitudes. This gradient towards longer wavelengths is usual for sub-stellar companions, as these are often redder than the predictions from the models (Janson et al., 2019).
We additionally determined the spectral type of the companion following the analysis demonstrated in Janson et al. (2019). This analysis was performed analogously to the SED fit described before; it was however confined to the SPHERE photometry, because the input models only support this wavelength coverage. Using the empirical spectra for M-L dwarfs of Luhman et al. (2017) we derive a best-fit spectral type of L0. This is equivalent to the spectral type derived for HIP 79098 (AB)b (Janson et al., 2019), which is indeed an ideal object for comparison, as it is also located in Sco-Cen – though in the Upper Scorpius sub-group instead of LCC – with an estimated age of Myr. The absolute magnitudes for the companion around TYC 8998-760-1 are approximately 1.5 mag fainter than the values derived for HIP 79098 (AB)b, supporting the theory that TYC 8998-760-1 b is less massive than the object of this comparison, for which Janson et al. (2019) derive a mass range of .
To verify the derived properties, we compared the colour of TYC 8998-760-1 b to that of known sub-stellar companions of similar spectral type. Based on the NIRSPEC Brown Dwarf Spectroscopic Survey (McLean et al., 2003, 2007), the IRTF Spectral library (Rayner et al., 2009; Cushing et al., 2005), and the L and T dwarf data archive (Knapp et al., 2004; Golimowski et al., 2004; Chiu et al., 2006), we compiled a sample of M, L, and T dwarfs. The spectra of these objects were evaluated at the bandpasses of the SPHERE and filters that we chose for the colour analysis. To determine the absolute magnitudes of these field dwarfs we used distance measurements provided by Gaia DR2 (Gaia Collaboration et al., 2018; Bailer-Jones et al., 2018), the Brown Dwarf Kinematics Project (Faherty et al., 2009), and the Pan-STARRS1 3 Survey (Best et al., 2018). Targets without any parallax measurement were discarded from the sample. In addition to these field objects, we compared the colour of TYC 8998-760-1 b to photometric measurements555For companions that have not been observed with the identical combination of SPHERE and dual band filters, we based the presented magnitudes and colours on the corresponding broadband photometry, instead. of confirmed sub-stellar companions (based on data from Cheetham et al., 2019; Janson et al., 2019; Lafrenière et al., 2008; Chauvin et al., 2005; Currie et al., 2013; Bonnefoy et al., 2011; Keppler et al., 2018; Müller et al., 2018; Chauvin et al., 2017b; Zurlo et al., 2016). The results of this analysis are presented in a colour-magnitude diagram in Figure 6.
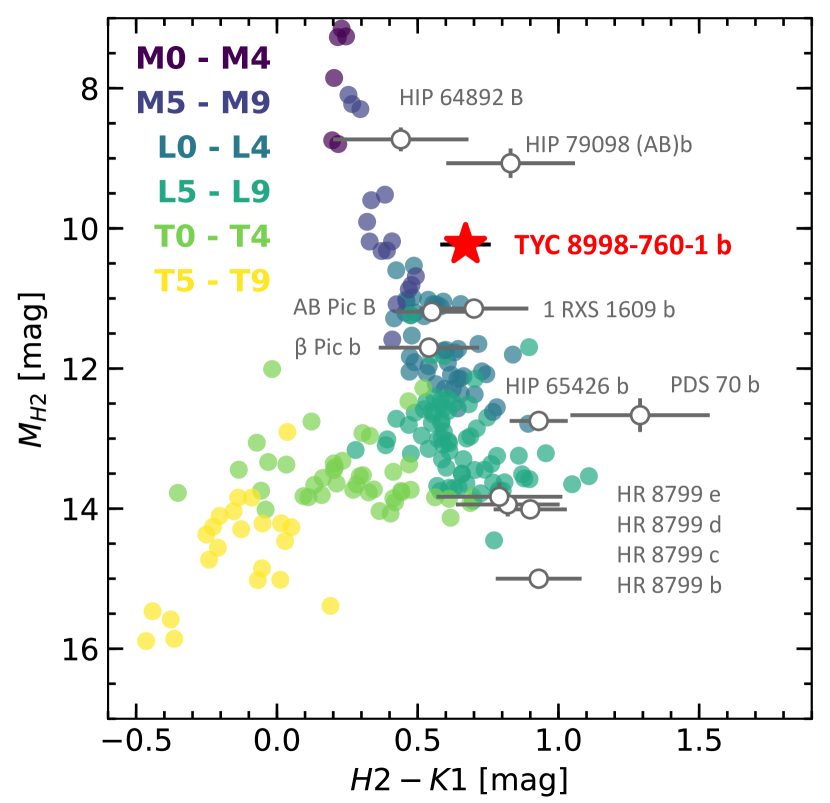
TYC 8998-760-1 b is located at the transition between late M and early L-type dwarfs, which is in very good agreement with the previously assigned spectral type of L0. As observed for many other young, directly imaged L-type companions, TYC 8998-760-1 b is considerably redder than the sequence of evolved field dwarfs of similar spectral type. This appearance is associated with lower surface gravities of these young objects in comparison to their field counterparts (e.g. Gizis et al., 2015; Janson et al., 2019).
All our analyses, therefore, indicate that the detected companion is sub-stellar in nature. Accounting for the spread among the various methods used to infer the object’s mass, we adopt a conservative estimate of , yielding a mass ratio of between primary and companion. We conclude that TYC-8998-760-1 forb is a sub-stellar companion to TYC-8998-760-1 at the boundary between giant planets and low mass brown dwarfs. Further studies at higher spectral resolution are required to confine this parameter space and to test the planetary nature of the object.
4.3 Detection limits
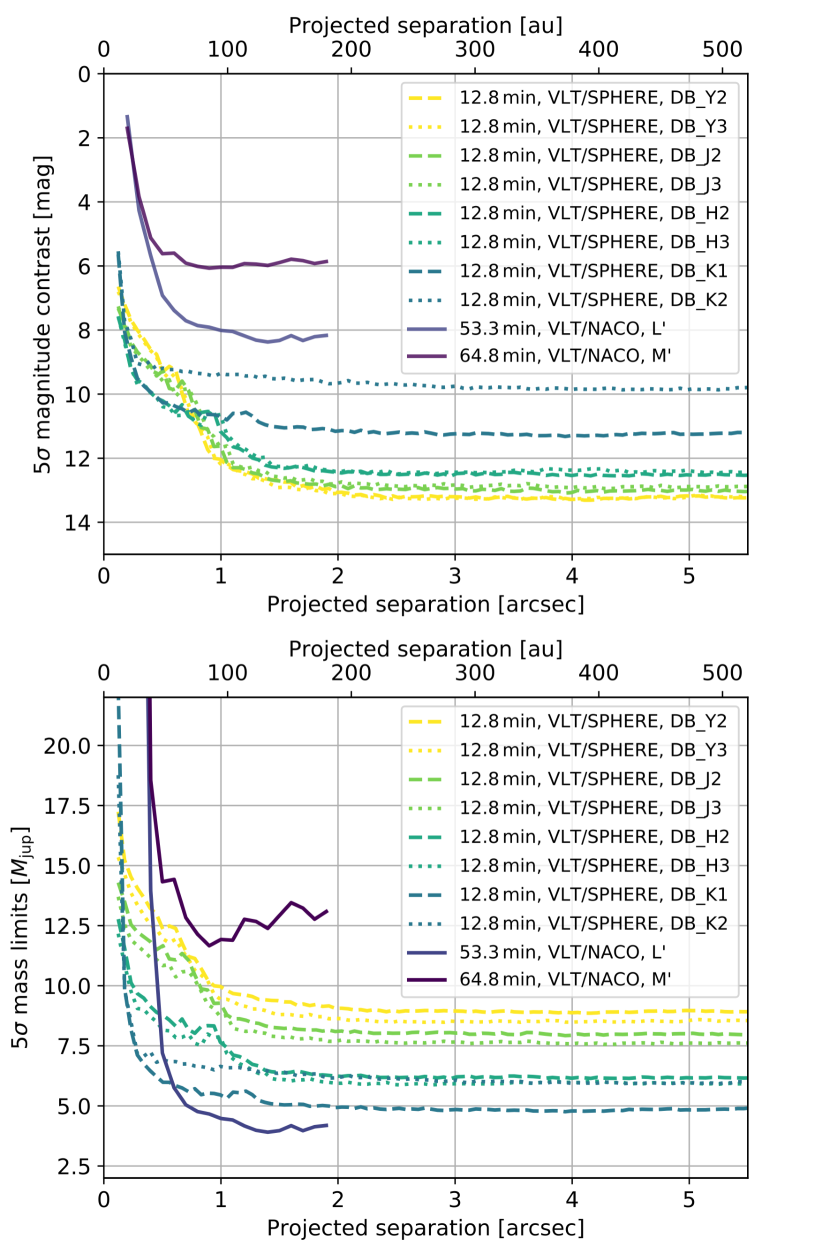
To assess our sensitivity to further companions in the system, we determined the contrast limits for each of the datasets. For the SPHERE data, which do not provide a large amount of parallactic rotation, we did not perform any PSF subtraction. Instead we determined the contrast in the derotated and median combined images by measuring the standard deviation of the residual flux in concentric annuli around the star. To exclude flux of candidate companions that might distort these noise measurements, we performed a 3 clipping of the flux values inside the annuli, before calculating the standard deviation of the remaining pixels. The annuli have widths of the FWHM at the corresponding wavelength and we evaluate the statistics at radial separations between 01 and 55 with a step size of 50 mas. With these noise terms and the peak flux of the PSF in the corresponding median flux image, we derived the 5 contrast curves for the SPHERE data, presented in the top panel of Figure 7.
Due to the poor weather conditions and shorter integration times, we neglect the SPHERE broadband imaging data for this analysis.
The NACO data was analysed with the ContrastCurveModule of PynPoint. For both and data we injected artificial planets into the data and fitted one principal component for PSF subtraction before de-rotation. The planets were injected at six equidistantly distributed angles with radial separations increasing from 02 to 20 and a step size of 100 mas. The magnitude of the injected planets was optimised so that these are detected at 5 significance applying an additional correction for small sample statistics at small angular separations (Mawet et al., 2014). To obtain the final contrast curves as presented in the top panel of Figure 7 we averaged the data along the azimuthal dimension.
To convert the derived magnitude contrasts to detectable planetary masses we used the AMES-dusty models (Allard et al., 2001; Chabrier et al., 2000) and evaluated the isochrones at a system age of 16.7 Myr. The SPHERE observations provide the best performance for small angular separations. The data rules out any additional companions more massive than for separations larger than 120 mas. This is equivalent to ruling out additional stellar or brown dwarf companions separated farther than 12 au from TYC 8998-760-1. For angular separations larger than 05 up to approximately 2″, NACO band imaging yields the tightest constraints for additional companions in the system. For separations in the range of 1″to 2″we can rule out additional companions that are more massive than approximately . Farther out, the background limit is approximately .
Due to deeper integrations in the SPHERE observations collected on the night of March 23, 2019, we detect additional point sources to the 16 objects that were found in the first epoch data from July 5, 2017. The contrasts of these objects are above the derived detection limits. Statistical evaluation based on the first epochs already indicates a very high fraction of background contaminants in the IRDIS field of view around TYC 8998-760-1; as we do not have additional data to test the proper motion of these new candidate companions we cannot entirely rule out the possibility that these are co-moving with TYC 8998-760-1.
5 Discussion
5.1 Companion properties
Whilst effective temperature, surface gravity and luminosity of TYC 8998-7601 b that we have derived in Section 4.2.2 seem to agree with general properties of similar low-mass companions (e.g. Bonnefoy et al., 2013; Chauvin et al., 2017b) the radius estimate of is larger than expected from these analogous systems. Empirical data suggest an almost constant radius of approximately 1 for planets in the range of up to stellar masses (e.g. Chabrier et al., 2009) - but these relations are derived from field populations of sub-stellar objects. Their young, gravitationally bound counterparts tend to be inflated instead as these are still contracting (Baraffe et al., 2015). This leads to earlier spectral types, lower surface gravities, and larger radii of young companions in comparison to field objects of the same mass (Asensio-Torres et al., 2019). Furthermore, the constraints that are imposed on the radius are only very weak. The lower bound from the Monte Carlo analysis already implies that smaller radii are not ruled out by our best-fit models. As the masses that are derived from effective temperature, luminosity, individual photometry, and spectral type are all in very good agreement, it is unlikely that the object is not a low-mass companion to TYC 8998-760-1.
Another possible explanation for the radius anomaly might be given by the scenario that TYC 8998-760-1 b is an unresolved binary with two components of near equal brightness. To test this hypothesis, we repeated the SED modeling, allowing for two objects contributing to the observed photometry. The best-fit result is obtained by binary components with effective temperatures of 1700 K and 1800 K and corresponding radii of and . These results are in better agreement with potential radii of inflated, young sub-stellar objects (Baraffe et al., 2015). As the PSF of TYC 8998-760-1 b is azimuthally symmetric, this potential binary pair of nearly equal brightness would have to be unresolved in our data. Applying the FWHM for our observations at highest angular resolution in Y2 band (see Table 2) implies that a binary companion must have a angular separation smaller than 37.2 mas to be unresolved in the data. At the distance of this system this translates to a physical separation smaller than 3.5 au, which lies well within the Hill sphere of a secondary with a mass of approximately . Although this hypothesis might explain the large radius that we find for TYC 8998-760-1 b, additional data of the companion is required to thoroughly test this scenario of binarity. An infra-red medium resolution spectrum of the companion would thus be very valuable for confirming this hypothesis.
5.2 Comparison to other directly imaged sub-stellar companions
Although tens of low-mass, sub-stellar companions have been directly imaged, the majority of the host stars are either more massive than the Sun (e.g. Lagrange et al., 2010; Marois et al., 2008; Rameau et al., 2013; Chauvin et al., 2017b; Carson et al., 2013; Janson et al., 2019), are located at the lower end of the stellar mass distribution (e.g. Luhman et al., 2005; Delorme et al., 2013; Artigau et al., 2015; Béjar et al., 2008; Luhman et al., 2009; Rebolo et al., 1998; Kraus et al., 2014; Bowler et al., 2013; Gauza et al., 2015; Naud et al., 2014; Itoh et al., 2005), or of sub-stellar nature themselves (e.g. Todorov et al., 2010; Gelino et al., 2011; Liu et al., 2012). The sample of planetary mass companions that are unambiguously confirmed around solar-type stars is still small, containing PDS 70 b and c (Keppler et al., 2018; Haffert et al., 2019), 2M 2236+4751 b (Bowler et al., 2017), AB Pic b (Chauvin et al., 2005), 1RXS 1609 b (Lafrenière et al., 2008), HN Peg b (Luhman et al., 2007), CT Cha b (Schmidt et al., 2008), HD 203030 b Metchev & Hillenbrand (2006), and GJ 504 b Kuzuhara et al. (2013). This selection was compiled666For this analysis we used the http://exoplanet.eu/ database (Schneider et al., 2011) applying conservative mass thresholds in the range of to for host stars to be considered solar type. In Fig. 8, we visualise the properties of TYC 8998-760-1 b among this sample of directly imaged sub-stellar companions around solar-mass stars.
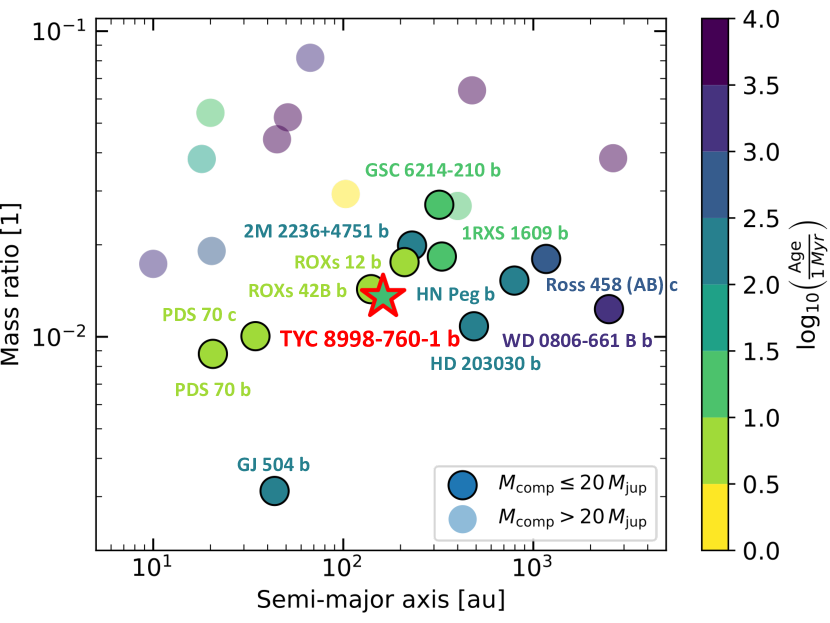
To estimate the semi-major axis of the object, we use the projected separation of 162 au that we derived earlier. This value is thus a lower limit of the actual semi-major axis, as it is the case for many directly imaged companions on wide orbits.
From Fig. 8 it is apparent that TYC 8998-760-1 is among the youngest systems with a directly imaged sub-stellar companion around a solar-mass host star. Its mass ratio is one of the smallest within the sample, only surpassed by HD 203030 b, GJ 504 b, and both planets around PDS 70. The distance at which it is detected is interesting as it is well separated from the host. This facilitates long-term monitoring and spectroscopic characterisation of the companion with both ground and space based missions. Near infrared observations towards the photometric variability of the object would help to constrain its rotation period and potential cloud coverage (e.g Yang et al., 2016); additional spectroscopic data will allow to constrain the mass of TYC 8998-760-1 b and to determine molecular abundances in its atmosphere (e.g. Hoeijmakers et al., 2018).
5.3 Formation scenarios
The origin of giant planetary-mass companions at large separations from their host stars is a highly debated topic. Studies by Kroupa (2001) and Chabrier (2003) argue that these objects can form in situ and represent the lower mass limit of multiple star formation via fragmentation processes in the collapsing protostellar cloud. If the companion has formed via the core accretion channel (Pollack et al., 1996; Alibert et al., 2005; Dodson-Robinson et al., 2009; Lambrechts & Johansen, 2012) or via gravitational instabilities of the protoplanetary disc (Boss, 1997; Rafikov, 2005; Durisen et al., 2007; Kratter et al., 2010; Boss, 2011) this must have happened closer to the star and after formation, the protoplanet needs to be scattered to the large separation at which it is observed. For regions with a high number density of stars such as Sco-Cen, also capture of another low-mass member of the association needs to be considered as a potential pathway of producing wide orbit companions (e.g. Varvoglis et al., 2012; Goulinski & Ribak, 2018). TYC 8998-760-1 b is an ideal candidate to test potential scenarios of (i) formation closer to the host and scattering to its current location, (ii) in-situ formation, and (iii) capture of a low mass Sco-Cen member.
Scenario (i) requires a third component in the system in addition to host star and companion. This component has to be more massive than the companion to scatter the protoplanet off the system to its current location. Even though the detection limits of our high-contrast observations rule out additional companions that are more massive than for projected separations that are larger than 12 au, this does not rule out a binary companion in a close orbit around TYC 8998-760-1. To constrain the parameter space of a close, massive companion in the system, reflex motion measurements of the host star are required. This analysis could be performed by combining our high-contrast imaging data with additional radial velocity observations of the system as for instance presented by Boehle et al. (2019). High-precision astrometry provided by future data releases of the Gaia mission (Gaia Collaboration et al., 2016) will be valuable to identifying potential close-in binaries.
One way to discriminate between the three potential formation scenarios is provided by a precise determination of TYC 8998-760-1 b’s orbit. This can be achieved by monitoring of the relative astrometric offset between primary and secondary in combination with additional radial velocity measurements. The primary’s radial velocity is measured by Gaia as and for the companion - as it is reasonably far separated from the host - this will be accessible by medium resolution spectroscopy. Polarimetric observations of the target and detection of a potential circumstellar or even circumplanetary disc around either of the components would impose further constraints on the orbital dynamics of the system.
With the currently available data it is not possible to unambiguously identify the mechanism that shaped the appearance of the young solar system around TYC 8998-760-1, but with future observations as outlined in the previous paragraphs, it should be possible to discern which is the most likely scenario that shaped the architecture of this young, solar-like system.
6 Conclusion
After the discovery of a shadowed protoplanetary disc at transition stage around Wray 15-788 (Bohn et al., 2019), we report the detection of a first planetary mass companion within the scope of YSES. The companion is found around the K3IV star TYC 8998-760-1, located in the LCC subgroup of Sco-Cen. Using X-SHOOTER and archival photometric data, we determine a mass of , an effective temperature of K, a luminosity of dex, and an age of Myr for the primary. The companion is detected at a projected separation of approximately 17 which translates to a projected physical separation of 162 au at the distance of the system. Fitting the companion’s photometry with BT-Settl models provides an effective temperature of K, a surface gravity of , a radius of , and a luminosity of dex. At the age of the system we adopt a mass estimate of , which is equivalent to a mass ratio of between primary and secondary. TYC 8998-760-1 b is among the youngest and least massive companions that are directly detected around solar-type stars. The large radius we have derived suggests that the companion is either inflated, or is an unresolved binary in a spatially unresolved orbit with a semi-major axis smaller than au. From our high-contrast imaging data we can exclude any additional companions in the system with masses larger than at separations larger than 12 au. This discovery opens many pathways for future ground and space-based characterisation of this solar-like environment at a very early stage of its evolution.
Acknowledgements
We thank the anonymous referee for the valuable feedback that helped improving the quality of the manuscript.
The research of AJB and FS leading to these results has received funding from the European Research Council under ERC Starting Grant agreement 678194 (FALCONER).
Part of this research was carried out at the Jet Propulsion Laboratory, California Institute of Technology, under a contract with the National Aeronautics and Space Administration.
The research leading to these results has received funding from the European Research Council (ERC) under the EuropeanUnion’s Horizon 2020 research and innovation programme (grant agreement no. 679633; Exo-Atmos).
CFM acknowledges an ESO fellowship. This project has received funding from the European Union’s Horizon 2020 research and innovation programme under the Marie Sklodowska-Curie grant agreement No 823823 (DUSTBUSTERS). This work was partly supported by the Deutsche Forschungs-Gemeinschaft (DFG, German Research Foundation) - Ref no. FOR 2634/1 TE 1024/1-1.
This research has used the SIMBAD database, operated at CDS, Strasbourg, France (Wenger et al., 2000). This work has used data from the European Space Agency (ESA) mission Gaia (https://www.cosmos.esa.int/gaia), processed by the Gaia Data Processing and Analysis Consortium (DPAC, https://www.cosmos.esa.int/web/gaia/dpac/consortium). Funding for the DPAC has been provided by national institutions, in particular the institutions participating in the Gaia Multilateral Agreement.
This publication makes use of VOSA, developed under the Spanish Virtual Observatory project supported by the Spanish MINECO through grant AyA2017-84089.
We used the Python programming language777Python Software Foundation, https://www.python.org/, especially the SciPy (Jones et al., 01), NumPy (Oliphant, 2006), Matplotlib (Hunter, 2007), scikit-image (Van der Walt et al., 2014), scikit-learn (Pedregosa et al., 2012), photutils (Bradley et al., 2016), and astropy (Astropy Collaboration et al., 2013, 2018) packages. We thanks the writers of these software packages for making their work available to the astronomical community.
References
- Alibert et al. (2005) Alibert Y., Mordasini C., Benz W., Winisdoerffer C., 2005, A&A, 434, 343
- Allard et al. (2001) Allard F., Hauschildt P. H., Alexander D. R., Tamanai A., Schweitzer A., 2001, ApJ, 556, 357
- Allard et al. (2012) Allard F., Homeier D., Freytag B., 2012, Philosophical Transactions of the Royal Society of London Series A, 370, 2765
- Amara & Quanz (2012) Amara A., Quanz S. P., 2012, MNRAS, 427, 948
- Artigau et al. (2015) Artigau É., Gagné J., Faherty J., Malo L., Naud M.-E., Doyon R., Lafrenière D., Beletsky Y., 2015, The Astrophysical Journal, 806, 254
- Asensio-Torres et al. (2019) Asensio-Torres R., et al., 2019, A&A, 622, A42
- Astropy Collaboration et al. (2013) Astropy Collaboration et al., 2013, A&A, 558, A33
- Astropy Collaboration et al. (2018) Astropy Collaboration et al., 2018, AJ, 156, 123
- Bailer-Jones et al. (2018) Bailer-Jones C. A. L., Rybizki J., Fouesneau M., Mantelet G., Andrae R., 2018, AJ, 156, 58
- Baraffe et al. (2015) Baraffe I., Homeier D., Allard F., Chabrier G., 2015, A&A, 577, A42
- Bayo et al. (2008) Bayo A., Rodrigo C., Barrado Y Navascués D., Solano E., Gutiérrez R., Morales-Calderón M., Allard F., 2008, A&A, 492, 277
- Béjar et al. (2008) Béjar V. J. S., Zapatero Osorio M. R., Pérez-Garrido A., Álvarez C., Martín E. L., Rebolo R., Villó-Pérez I., Díaz-Sánchez A., 2008, The Astrophysical Journal, 673, L185
- Best et al. (2018) Best W. M. J., et al., 2018, ApJS, 234, 1
- Beuzit et al. (2019) Beuzit J. L., et al., 2019, arXiv e-prints, p. arXiv:1902.04080
- Boehle et al. (2019) Boehle A., Quanz S. P., Lovis C., Sègransan D., Udry S., Apai D., 2019, arXiv e-prints, p. arXiv:1907.04334
- Bohn et al. (2019) Bohn A. J., et al., 2019, A&A, 624, A87
- Bonnefoy et al. (2011) Bonnefoy M., et al., 2011, A&A, 528, L15
- Bonnefoy et al. (2013) Bonnefoy M., et al., 2013, A&A, 555, A107
- Boss (1997) Boss A. P., 1997, Science, 276, 1836
- Boss (2011) Boss A. P., 2011, ApJ, 731, 74
- Bowler et al. (2013) Bowler B. P., Liu M. C., Shkolnik E. L., Dupuy T. J., 2013, The Astrophysical Journal, 774, 55
- Bowler et al. (2017) Bowler B. P., et al., 2017, The Astronomical Journal, 153, 18
- Bradley et al. (2016) Bradley L., et al., 2016, Photutils: Photometry tools (ascl:1609.011)
- Caffau et al. (2011) Caffau E., Ludwig H. G., Steffen M., Freytag B., Bonifacio P., 2011, Sol. Phys., 268, 255
- Carson et al. (2013) Carson J., et al., 2013, The Astrophysical Journal, 763, L32
- Chabrier (2003) Chabrier G., 2003, PASP, 115, 763
- Chabrier et al. (2000) Chabrier G., Baraffe I., Allard F., Hauschildt P., 2000, ApJ, 542, 464
- Chabrier et al. (2009) Chabrier G., Baraffe I., Leconte J., Gallardo J., Barman T., 2009, in Stempels E., ed., American Institute of Physics Conference Series Vol. 1094, 15th Cambridge Workshop on Cool Stars, Stellar Systems, and the Sun. pp 102–111 (arXiv:0810.5085), doi:10.1063/1.3099078
- Chauvin et al. (2005) Chauvin G., et al., 2005, Astronomy and Astrophysics, 438, L29
- Chauvin et al. (2017a) Chauvin G., et al., 2017a, in SF2A-2017: Proceedings of the Annual meeting of the French Society of Astronomy and Astrophysics. p. Di
- Chauvin et al. (2017b) Chauvin G., et al., 2017b, Astronomy and Astrophysics, 605, L9
- Chauvin et al. (2018) Chauvin G., et al., 2018, A&A, 617, A76
- Cheetham et al. (2019) Cheetham A. C., et al., 2019, A&A, 622, A80
- Chiu et al. (2006) Chiu K., Fan X., Leggett S. K., Golimowski D. A., Zheng W., Geballe T. R., Schneider D. P., Brinkmann J., 2006, AJ, 131, 2722
- Claudi et al. (2008) Claudi R. U., et al., 2008, in Ground-based and Airborne Instrumentation for Astronomy II. p. 70143E, doi:10.1117/12.788366
- Currie et al. (2013) Currie T., et al., 2013, ApJ, 776, 15
- Cushing et al. (2005) Cushing M. C., Rayner J. T., Vacca W. D., 2005, ApJ, 623, 1115
- Cutri et al. (2012a) Cutri R. M., et al., 2012a, VizieR Online Data Catalog, p. II/281
- Cutri et al. (2012b) Cutri R. M., et al., 2012b, VizieR Online Data Catalog, p. II/311
- Delorme et al. (2013) Delorme P., et al., 2013, Astronomy and Astrophysics, 553, L5
- Dodson-Robinson et al. (2009) Dodson-Robinson S. E., Veras D., Ford E. B., Beichman C. A., 2009, ApJ, 707, 79
- Dohlen et al. (2008) Dohlen K., et al., 2008, in Ground-based and Airborne Instrumentation for Astronomy II. p. 70143L, doi:10.1117/12.789786
- Durisen et al. (2007) Durisen R. H., Boss A. P., Mayer L., Nelson A. F., Quinn T., Rice W. K. M., 2007, in Reipurth B., Jewitt D., Keil K., eds, Protostars and Planets V. p. 607 (arXiv:astro-ph/0603179)
- Faherty et al. (2009) Faherty J. K., Burgasser A. J., Cruz K. L., Shara M. M., Walter F. M., Gelino C. R., 2009, AJ, 137, 1
- Fusco et al. (2006) Fusco T., et al., 2006, Optics Express, 14, 7515
- Gaia Collaboration et al. (2016) Gaia Collaboration et al., 2016, A&A, 595, A1
- Gaia Collaboration et al. (2018) Gaia Collaboration Brown A. G. A., Vallenari A., Prusti T., de Bruijne J. H. J., Babusiaux C., Bailer-Jones C. A. L., 2018, preprint, p. arXiv:1804.09365 (arXiv:1804.09365)
- Galicher et al. (2014) Galicher R., et al., 2014, A&A, 565, L4
- Gauza et al. (2015) Gauza B., Béjar V. J. S., Pérez-Garrido A., Zapatero Osorio M. R., Lodieu N., Rebolo R., Pallé E., Nowak G., 2015, The Astrophysical Journal, 804, 96
- Gelino et al. (2011) Gelino C. R., et al., 2011, The Astronomical Journal, 142, 57
- Gizis et al. (2015) Gizis J. E., Allers K. N., Liu M. C., Harris H. C., Faherty J. K., Burgasser A. J., Kirkpatrick J. D., 2015, ApJ, 799, 203
- Golimowski et al. (2004) Golimowski D. A., et al., 2004, AJ, 127, 3516
- Goulinski & Ribak (2018) Goulinski N., Ribak E. N., 2018, MNRAS, 473, 1589
- Greenbaum et al. (2018) Greenbaum A. Z., et al., 2018, AJ, 155, 226
- Guizar-Sicairos et al. (2008) Guizar-Sicairos M., Thurman S. T., Fienup J. R., 2008, Optics letters, 33, 156
- Haffert et al. (2019) Haffert S. Y., Bohn A. J., de Boer J., Snellen I. A. G., Brinchmann J., Girard J. H., Keller C. U., Bacon R., 2019, Nature Astronomy, 3, 749
- Henden & Munari (2014) Henden A., Munari U., 2014, Contributions of the Astronomical Observatory Skalnate Pleso, 43, 518
- Hoeijmakers et al. (2018) Hoeijmakers H. J., Schwarz H., Snellen I. A. G., de Kok R. J., Bonnefoy M., Chauvin G., Lagrange A. M., Girard J. H., 2018, A&A, 617, A144
- Høg et al. (2000) Høg E., et al., 2000, A&A, 355, L27
- Hunter (2007) Hunter J. D., 2007, Computing in Science and Engineering, 9, 90
- Hunziker et al. (2018) Hunziker S., Quanz S. P., Amara A., Meyer M. R., 2018, A&A, 611, A23
- Itoh et al. (2005) Itoh Y., et al., 2005, The Astrophysical Journal, 620, 984
- Janson et al. (2019) Janson M., et al., 2019, A&A, 626, A99
- Jones et al. (01 ) Jones E., Oliphant T., Peterson P., et al., 2001–, SciPy: Open source scientific tools for Python, http://www.scipy.org/
- Kausch et al. (2015) Kausch W., et al., 2015, A&A, 576, A78
- Keppler et al. (2018) Keppler M., et al., 2018, A&A, 617, A44
- Knapp et al. (2004) Knapp G. R., et al., 2004, AJ, 127, 3553
- Kratter et al. (2010) Kratter K. M., Murray-Clay R. A., Youdin A. N., 2010, ApJ, 710, 1375
- Kraus et al. (2014) Kraus A. L., Ireland M. J., Cieza L. A., Hinkley S., Dupuy T. J., Bowler B. P., Liu M. C., 2014, The Astrophysical Journal, 781, 20
- Kroupa (2001) Kroupa P., 2001, MNRAS, 322, 231
- Kuzuhara et al. (2013) Kuzuhara M., et al., 2013, The Astrophysical Journal, 774, 11
- Lafrenière et al. (2007) Lafrenière D., Marois C., Doyon R., Nadeau D., Artigau É., 2007, ApJ, 660, 770
- Lafrenière et al. (2008) Lafrenière D., Jayawardhana R., van Kerkwijk M. H., 2008, The Astrophysical Journal, 689, L153
- Lagrange et al. (2010) Lagrange A. M., et al., 2010, Science, 329, 57
- Lagrange et al. (2019) Lagrange A.-M., et al., 2019, A&A, 621, L8
- Lambrechts & Johansen (2012) Lambrechts M., Johansen A., 2012, A&A, 544, A32
- Lenzen et al. (2003) Lenzen R., et al., 2003, in Iye M., Moorwood A. F. M., eds, Society of Photo-Optical Instrumentation Engineers (SPIE) Conference Series Vol. 4841, Instrument Design and Performance for Optical/Infrared Ground-based Telescopes. pp 944–952, doi:10.1117/12.460044
- Liu et al. (2012) Liu M. C., Dupuy T. J., Bowler B. P., Leggett S. K., Best W. M. J., 2012, The Astrophysical Journal, 758, 57
- Lodders et al. (2009) Lodders K., Palme H., Gail H. P., 2009, Landolt Börnstein, 4B, 712
- Luhman et al. (2005) Luhman K. L., Adame L., D’Alessio P., Calvet N., Hartmann L., Megeath S. T., Fazio G. G., 2005, The Astrophysical Journal, 635, L93
- Luhman et al. (2007) Luhman K. L., et al., 2007, The Astrophysical Journal, 654, 570
- Luhman et al. (2009) Luhman K. L., Mamajek E. E., Allen P. R., Muench A. A., Finkbeiner D. P., 2009, The Astrophysical Journal, 691, 1265
- Luhman et al. (2017) Luhman K. L., Mamajek E. E., Shukla S. J., Loutrel N. P., 2017, AJ, 153, 46
- Macintosh et al. (2014) Macintosh B., et al., 2014, Proceedings of the National Academy of Science, 111, 12661
- Macintosh et al. (2015) Macintosh B., et al., 2015, Science, 350, 64
- Maire et al. (2016) Maire A.-L., et al., 2016, in Ground-based and Airborne Instrumentation for Astronomy VI. p. 990834, doi:10.1117/12.2233013
- Manara et al. (2013a) Manara C. F., et al., 2013a, A&A, 551, A107
- Manara et al. (2013b) Manara C. F., Beccari G., Da Rio N., De Marchi G., Natta A., Ricci L., Robberto M., Testi L., 2013b, A&A, 558, A114
- Manara et al. (2017) Manara C. F., Frasca A., Alcalá J. M., Natta A., Stelzer B., Testi L., 2017, A&A, 605, A86
- Marois et al. (2006) Marois C., Lafrenière D., Doyon R., Macintosh B., Nadeau D., 2006, ApJ, 641, 556
- Marois et al. (2008) Marois C., Macintosh B., Barman T., Zuckerman B., Song I., Patience J., Lafrenière D., Doyon R., 2008, Science, 322, 1348
- Mawet et al. (2014) Mawet D., et al., 2014, ApJ, 792, 97
- McLean et al. (2003) McLean I. S., McGovern M. R., Burgasser A. J., Kirkpatrick J. D., Prato L., Kim S. S., 2003, ApJ, 596, 561
- McLean et al. (2007) McLean I. S., Prato L., McGovern M. R., Burgasser A. J., Kirkpatrick J. D., Rice E. L., Kim S. S., 2007, ApJ, 658, 1217
- Metchev & Hillenbrand (2006) Metchev S. A., Hillenbrand L. A., 2006, The Astrophysical Journal, 651, 1166
- Modigliani et al. (2010) Modigliani A., et al., 2010, in Proc. SPIE. p. 773728, doi:10.1117/12.857211
- Müller et al. (2018) Müller A., et al., 2018, A&A, 617, L2
- Musso Barcucci et al. (2019) Musso Barcucci A., et al., 2019, arXiv e-prints, p. arXiv:1906.01391
- Naud et al. (2014) Naud M.-E., et al., 2014, The Astrophysical Journal, 787, 5
- Nelder & Mead (1965) Nelder J. A., Mead R., 1965, The computer journal, 7, 308
- Nielsen et al. (2019) Nielsen E. L., et al., 2019, AJ, 158, 13
- Oliphant (2006) Oliphant T. E., 2006, A guide to NumPy. Vol. 1, Trelgol Publishing USA
- Pecaut & Mamajek (2013) Pecaut M. J., Mamajek E. E., 2013, ApJS, 208, 9
- Pecaut & Mamajek (2016) Pecaut M. J., Mamajek E. E., 2016, MNRAS, 461, 794
- Pedregosa et al. (2012) Pedregosa F., et al., 2012, arXiv e-prints, p. arXiv:1201.0490
- Pollack et al. (1996) Pollack J. B., Hubickyj O., Bodenheimer P., Lissauer J. J., Podolak M., Greenzweig Y., 1996, Icarus, 124, 62
- Rafikov (2005) Rafikov R. R., 2005, ApJ, 621, L69
- Rameau et al. (2013) Rameau J., et al., 2013, The Astrophysical Journal, 772, L15
- Rayner et al. (2009) Rayner J. T., Cushing M. C., Vacca W. D., 2009, ApJS, 185, 289
- Rebolo et al. (1998) Rebolo R., Zapatero Osorio M. R., Madruga S., Bejar V. J. S., Arribas S., Licandro J., 1998, Science, 282, 1309
- Rousset et al. (2003) Rousset G., et al., 2003, in Wizinowich P. L., Bonaccini D., eds, Society of Photo-Optical Instrumentation Engineers (SPIE) Conference Series Vol. 4839, Adaptive Optical System Technologies II. pp 140–149, doi:10.1117/12.459332
- Samland et al. (2017) Samland M., et al., 2017, A&A, 603, A57
- Schmidt et al. (2008) Schmidt T. O. B., Neuhäuser R., Seifahrt A., Vogt N., Bedalov A., Helling C., Witte S., Hauschildt P. H., 2008, Astronomy and Astrophysics, 491, 311
- Schneider et al. (2011) Schneider J., Dedieu C., Le Sidaner P., Savalle R., Zolotukhin I., 2011, A&A, 532, A79
- Smette et al. (2015) Smette A., et al., 2015, A&A, 576, A77
- Smith & Terrile (1984) Smith B. A., Terrile R. J., 1984, Science, 226, 1421
- Soderblom et al. (1993) Soderblom D. R., Jones B. F., Balachand ran S., Stauffer J. R., Duncan D. K., Fedele S. B., Hudon J. D., 1993, AJ, 106, 1059
- Soummer (2005) Soummer R., 2005, ApJ, 618, L161
- Soummer et al. (2012) Soummer R., Pueyo L., Larkin J., 2012, ApJ, 755, L28
- Stolker et al. (2019) Stolker T., Bonse M. J., Quanz S. P., Amara A., Cugno G., Bohn A. J., Boehle A., 2019, A&A, 621, A59
- Todorov et al. (2010) Todorov K., Luhman K. L., McLeod K. K., 2010, ApJ, 714, L84
- Van der Walt et al. (2014) Van der Walt S., Schönberger J. L., Nunez-Iglesias J., Boulogne F., Warner J. D., Yager N., Gouillart E., Yu T., 2014, PeerJ, 2, e453
- Varvoglis et al. (2012) Varvoglis H., Sgardeli V., Tsiganis K., 2012, Celestial Mechanics and Dynamical Astronomy, 113, 387
- Vernet et al. (2011) Vernet J., et al., 2011, A&A, 536, A105
- Vigan et al. (2010) Vigan A., Moutou C., Langlois M., Allard F., Boccaletti A., Carbillet M., Mouillet D., Smith I., 2010, MNRAS, 407, 71
- Wang et al. (2016) Wang J. J., et al., 2016, AJ, 152, 97
- Wang et al. (2018) Wang J. J., et al., 2018, AJ, 156, 192
- Wenger et al. (2000) Wenger M., et al., 2000, A&AS, 143, 9
- Yang et al. (2016) Yang H., et al., 2016, ApJ, 826, 8
- Zacharias et al. (2005) Zacharias N., Monet D. G., Levine S. E., Urban S. E., Gaume R., Wycoff G. L., 2005, VizieR Online Data Catalog, p. I/297
- Zurlo et al. (2016) Zurlo A., et al., 2016, A&A, 587, A57
- de Zeeuw et al. (1999) de Zeeuw P. T., Hoogerwerf R., de Bruijne J. H. J., Brown A. G. A., Blaauw A., 1999, AJ, 117, 354
Appendix A Proper motion analysis of other point sources
In our first epoch data, we detect 16 point sources around TYC 8998-760-1. All these candidate companions are re-detected in our deeper second epoch data from March 23, 2019. We analysed the relative motion of all these object towards common proper motion with the primary. As presented in Figure 9 all candidate companions but TYC 8998-760-1 b have to be considered background contaminants, as their relative positions are not compatible with a bound companion.
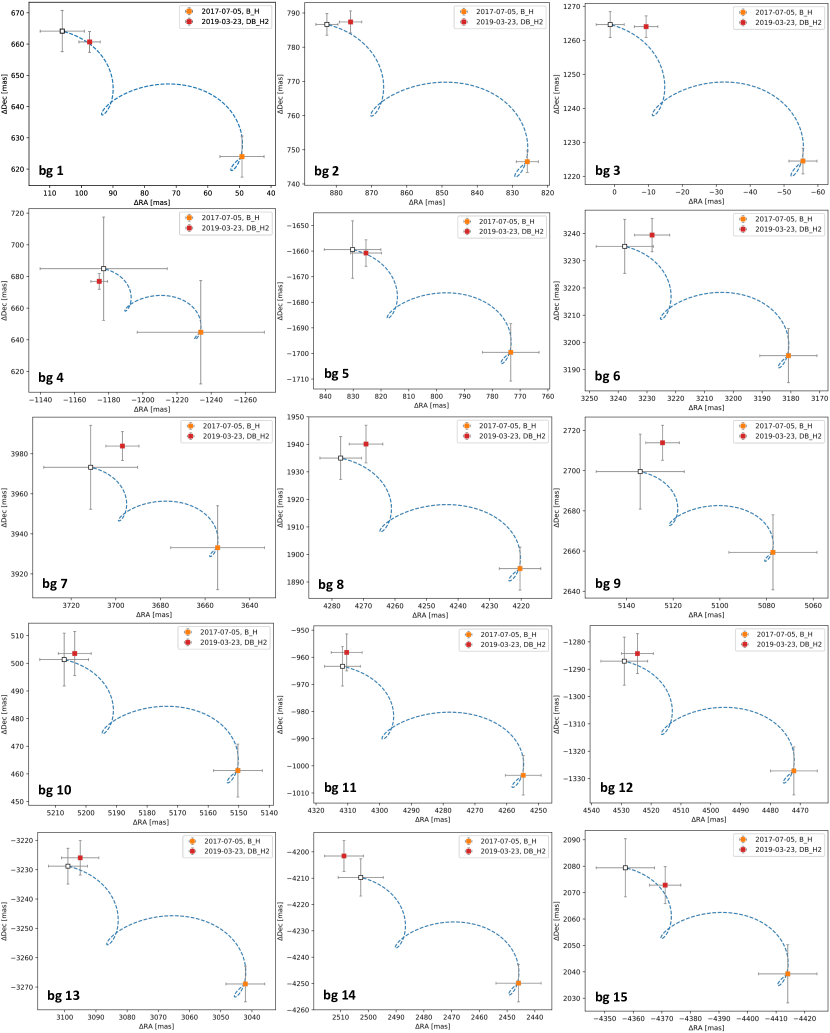
In most cases our measurements agree well with the predicted trajectory of a static background object. Small deviations from this prediction indicate an intrinsic non-zero proper motion of the object, instead.