Chandra Observations of High Energy X-ray Sources Discovered by INTEGRAL
Abstract
The International Gamma-Ray Astrophysics Laboratory (INTEGRAL) satellite has detected in excess of 1000 sources in the 20–100 keV band during its surveys of the sky over the past 17 years. We obtained 5 ks observations of 15 unclassified IGR sources with the Chandra X-ray Observatory in order to localize them, to identify optical/IR counterparts, to measure their soft X-ray spectra, and to classify them. For 10 of the IGR sources, we detect Chandra sources that are likely (or in some cases certain) to be the counterparts. IGR J18007–4146 and IGR J15038–6021 both have Gaia parallax distances, placing them at and kpc, respectively. We tentatively classify both of them as intermediate polar-type Cataclysmic Variables. Also, IGR J17508–3219 is likely to be a Galactic source, but it is unclear if it is a Dwarf Nova or another type of transient. For IGR J17118–3155, we provide a Chandra localization, but it is unclear if the source is Galactic or extragalactic. Based on either near-IR/IR colors or the presence of extended near-IR emission, we classify four sources as Active Galactic Nuclei (IGR J16181–5407, IGR J16246–4556, IGR J17096–2527, and IGR J19294+1327), and IGR J20310+3835 and IGR J15541–5613 are AGN candidates. In addition, we identified an AGN in the INTEGRAL error circle of IGR J16120–3543 that is a possible counterpart.
,
1 Introduction
Since 2002, the INTEGRAL satellite has been carrying out observations with its large field of view coded aperture mask instruments (Winkler et al., 2003). In particular, as the exposure time in the 20-100 keV band across the sky and especially in the Galactic plane has increased, more new or previously poorly studied “INTEGRAL Gamma-Ray” (IGR) sources have been found. INTEGRAL has now detected in excess of 1000 sources (Bird et al., 2016; Krivonos et al., 2017) with the majority being new sources.
The hard X-ray bandpass of INTEGRAL provides a way to select sources where extreme physics is occurring. The high energy emission can be produced by accretion onto a compact object (magnetic white dwarf, neutron star, or black hole) or when particle acceleration leads to non-thermal emission. The Bird et al. (2016) INTEGRAL source catalog includes 939 sources. Over the whole sky, Active Galactic Nuclei (AGN) dominate and account for 369 of the sources. The Galactic population is dominated by 129 low mass X-ray binaries (LMXBs), 116 high mass X-ray binaries (HMXBs), and 56 cataclysmic variables (CVs). Pulsar wind nebulae (PWNe), supernova remnants (SNRs), and galaxy clusters are also among the IGR sources. Thus, INTEGRAL is providing a much more complete picture of the populations of hard X-ray sources, and making discoveries about Galactic sources, including two new classes of HMXBs: obscured HMXBs (Matt & Guainazzi, 2003; Walter et al., 2006) and Supergiant Fast X-ray Transients (Negueruela et al., 2006; Sguera et al., 2006; Romano et al., 2014); larger numbers of hard X-ray emitting intermediate polars (IPs; Bonnet-Bidaud et al., 2007; Landi et al., 2009; Tomsick et al., 2016b); and highly energetic PWNe (Tomsick et al., 2012b; Pavan et al., 2013).
While INTEGRAL excels at detecting sources in the 20-100 keV band, it only localizes the sources to –, which is not adequate for finding optical/IR counterparts. Thus, in most cases, sources are not classified until higher angular resolution X-ray observations are obtained, providing an image to identify extended sources or to improve the source localization, allowing for multi-wavelength counterparts to be found. Large X-ray follow-up programs include the use of the Neil Gehrels Swift Observatory X-ray Telescope (Swift/XRT; Landi et al., 2017, and references therein) and the Chandra X-ray Observatory (e.g., Tomsick et al., 2006, 2008, 2016a). The X-ray localizations enable optical and near-IR spectroscopy (e.g., Chaty et al., 2008; Masetti et al., 2013; Coleiro et al., 2013; Fortin et al., 2018), at which point confident source classifications are nearly always obtained.
1.1 Target Selection
When the Bird et al. (2016) catalog was released, there were 219 unidentified sources in the catalog, and we selected sources to observe with Chandra based on the following criteria:
1. the selected sources have IGR names, indicating discovery in the hard X-rays by INTEGRAL;
2. the nature is completely unknown for the selected sources (i.e., the type is listed as “?”);
3. the sources are “new” in that they did not appear in the Bird et al. (2010) catalog, implying that there has been little opportunity for follow-up observations; and
4. they are within of the Galactic plane, increasing the chances that they are Galactic (we note that the highest Galactic latitude in our final list is ).
After applying these four criteria, 56 sources remained, but we reduced the list further based on available information about performed or planned observations with Chandra, the X-ray Multi-Mirror Mission (XMM-Newton), and Swift. For example, when we selected targets, 20 of the 56 sources had planned Swift observations, and these were removed from our list (although we kept some sources that already had Swift observations after confirming that the Swift localization did not identify a unique optical or near-IR counterpart). We also found that some of the sources show evidence for being variable or strongly variable in the hard X-rays based on the analysis of Bird et al. (2016). Strong variability (changes in INTEGRAL detection significance over time by 400%) could indicate that the source is truly transient, which means that it could be too faint to be detected in a short Chandra observation, and so none of the sources in our final list are in the strongly variable category. However, most Galactic sources (and certainly X-ray binaries) are variable, so we kept the sources in the variable category (changes in INTEGRAL detection significance over time by between 10% and 400%), and these are indicated in Table 1.
After the above considerations, the list of 15 IGR sources in Table 1 remained. They were observed with Chandra, and we describe the observations in Section 2. In Section 3, we describe the analysis of the data and present the results. The primary goal is to obtain X-ray positions of the IGR sources with arcsecond accuracy, but this also includes assessing which is the most likely Chandra counterpart for each IGR source. For this, we follow methods that are similar to those we have developed in earlier works (Tomsick et al., 2009, 2012a). We discuss the results in Section 4 and summarize our conclusions in Section 5.
2 Chandra Observations
The list of IGR targets and information about the Chandra observations is provided in Table 2. For all 15 observations, the target was observed with the ACIS-I instrument (Garmire et al., 2003), which has a bandpass of 0.3–10 keV. IGR sources are typically relatively bright, with X-ray fluxes of erg cm-2 s-1. At these flux levels, exposure times of 5 ks are sufficient to detect tens or hundreds of counts, depending on spectral shape and variability. Although some highly absorbed or highly variable IGR sources could have significantly lower X-ray flux levels, longer exposure times would not necessarily lead to the identification of the Chandra counterpart. With the 90% confidence INTEGRAL error circles having radii between and , we would expect the sky density of field sources to make it difficult to select the true counterpart if it had a significantly lower X-ray flux level than expected.
Table 2 also provides the pointing positions used for each IGR source. In 11 cases, we simply used the INTEGRAL position reported in the Bird et al. (2016) catalog. However, for four sources (IGR J19294+1327, IGR J16181–5407, IGR J20310+3835, and IGR J18007–4146), Swift/XRT observations identified a possible counterpart, and we used the XRT position for the Chandra pointing. However, in each case, the full INTEGRAL error circle was included in the ACIS-I field of view, and in searching for the IGR source, we considered our search region to be the INTEGRAL error circle.
3 Analysis and Results
3.1 Chandra Source Detection, Localization, and Photometry
We reduced the data using the Chandra Interactive Analysis of Observations (CIAO, Fruscione et al., 2006) version 4.11 software along with the Calibration Database (CALDB) version 4.8.4.1. We used chandra_repro to reprocess the data, which results in an event list along with several other files with information about the spacecraft aspect, bad detector pixels, etc. After reprocessing, the steps in our analysis are to search for sources on the four ACIS-I detector chips, cross-correlate with the Gaia Data Release 2 (DR2) optical source catalog (Prusti et al., 2016; Gaia Collaboration et al., 2018) to register the images and reduce the contribution of the systematic pointing uncertainty to the source localization uncertainties, and perform aperture photometry to determine the number of counts for each detected source. We generally follow the instructions in the CIAO science threads111See http://asc.harvard.edu/ciao/threads/index.html.
For each of the 15 observations, we used fluximage to produce an exposure-corrected image in the 0.3–10 keV energy band, and applied the wavdetect source detection algorithm to this image with wavelet scales of 1, 2, 4, 6, 8, 12, 16, 24, and 32 and the detection threshold set at a level to produce a list of sources for which only one spurious source is expected. Table 3 shows that between 6 and 28 Chandra sources were detected per ObsID. We used the imaging program SAOImage (ds9) to search the Gaia DR2 catalog for optical sources in the ACIS-I field and cross-correlated the Chandra and Gaia source lists using CIAO’s wcs_match. For 11 of the ObsIDs, between 3 and 7 matches were found, allowing for a position shift to be calculated to register the Chandra image to the Gaia reference frame. The shifts are listed in Table 3 along with the average residuals between the Chandra and Gaia positions, which are between and . We take these values to be the systematic pointing uncertainty. The four remaining ObsIDs have zero or one match, and we do not perform any position shifts for these. Thus, the systematic pointing uncertainty in these four cases is (90% confidence)222See http://cxc.cfa.harvard.edu/cal/ASPECT/celmon/.
We carried out the Chandra aperture photometry to determine the number of counts for all of the detected sources. We made a point spread function (PSF) map using mkpsfmap for an energy of 2.3 keV (the typical average photon energy for the full 0.3–10 keV Chandra bandpass), and determined the 95% encircled energy radius for each source. After defining large (typically 15 arcmin2) source-free background regions for each observation, we used dmextract to extract background-subtracted counts in the 0.3–2 keV, 2–10 keV, and 0.3–10 keV energy bands. Based on our previous work (e.g., Tomsick et al., 2012a), for each source, we calculated the probability that the source would be detected in a search area with a radius of . In cases where the source is within the 90% confidence INTEGRAL error radius (), . If the source is outside the INTEGRAL error radius then is equal to the angular distance from the best estimate of the INTEGRAL position.
The predicted surface density of sources is the other factor that is important for determining the spurious source probability. In Tomsick et al. (2012a), we used
| (1) |
which is based on the - curve from the Advanced Satellite for Cosmology and Astrophysics (ASCA; Sugizaki et al., 2001). However, this work only included the Galactic sources, so we also consider a more recent determination of the - in the Norma Region of the Galactic Plane
| (2) |
which also includes AGN (Fornasini et al., 2014). In addition, the Norma Region is centered on the Galactic plane, covering –, likely representing an upper bound on the source density. While we use these exact equations in Section 3.2 to determine the absolute spurious source probabilities for Chandra sources that are likely candidates to be associated with the IGR sources, we first determine the relative probabilities for all sources using
| (3) |
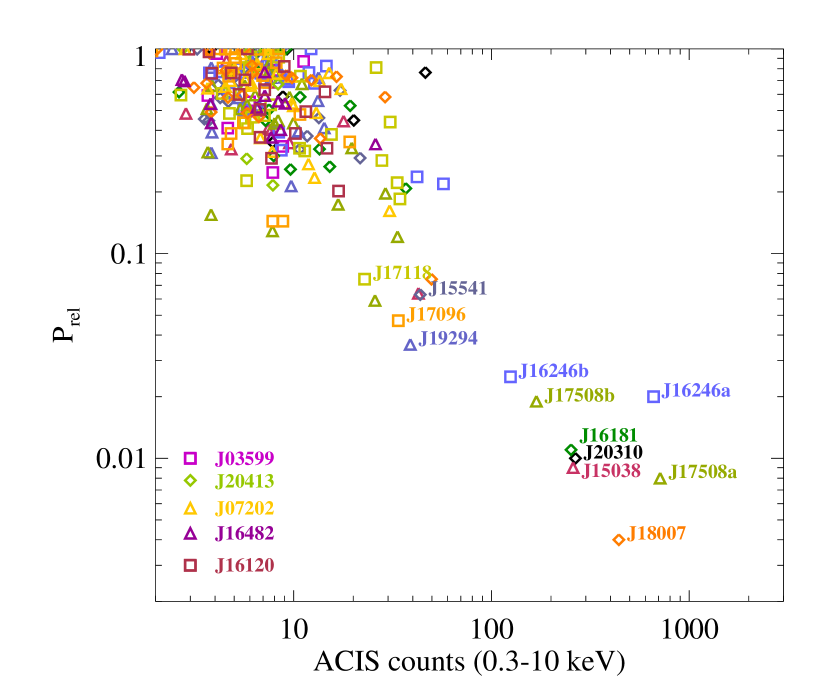
where is the number of counts in the 2–10 keV band, is an arbitrary normalization constant set so that the brightest sources have values near 1%, and we use –1.0 as the slope of the - since this is the midpoint between the Sugizaki et al. (2001) and Fornasini et al. (2014) values.
Using Equation 3, with , we calculate for all the sources detected in the 15 Chandra observations, and these are plotted in Figure 1. This parameter space leads to a large cluster of low count/high field sources and relatively clear separation between this cluster and the Chandra sources that are candidates to be counterparts to the IGR sources. For ten of the IGR fields, the most likely counterpart is labeled in Figure 1, and there are two fields with two potential counterparts.
For these 12 sources, Table 4 gives the Chandra names and positions, the angular distance from the center of the INTEGRAL error circle (), the number of ACIS counts in the 0.3–10 keV band, and the hardness ratio. The uncertainties in the positions include systematic and statistical contributions added in quadrature. The determination of the systematic uncertainty is described above (see Table 3). For the statistical contribution, we use Equation 13 from Kim et al. (2007), which uses the number of counts and the angular distance of the source from the Chandra aimpoint. The information in Table 4 provides additional information about the likelihood that the Chandra sources are the true counterparts to the IGR sources. In particular, J16246a is a questionable counterpart because it is one of the softer sources in the list, and it is well outside the INTEGRAL error circle ( compared to the error circle radius of ). Also, J17508a is questionable since it is a very soft source, and it is outside the INTEGRAL error circle.
3.2 Chandra and INTEGRAL Energy Spectra
For the 12 candidate counterparts, we extracted Chandra energy spectra using specextract. For the source extraction region, we used a circle with a radius corresponding to 95% encircled energy, which we determined from the PSF map. However, we also checked each source for photon pile-up by making an image for energies greater than 10 keV. For the three sources with evidence for pile-up (J16181, J18007, and J20310), we used an annular source extraction region with an inner radius of 1 pixel to cut out the core of the PSF. We also extracted a background spectrum using the same region used for the photometry. The spectra were rebinned to require a detection in each bin at the 3 level unless this resulted in fewer than five bins, in which case a 2 requirement was used.
Using XSPEC (Arnaud, 1996), we fit the Chandra spectra with an absorbed power-law model, and the parameters are reported in Table 5. We performed the fits by minimizing the C-statistic, and we give the values and number of degrees of freedom (dof) in Table 5. We use these values along with the variances in , calculated according to equations 20-22 in Kaastra (2017), to quantify the quality of the fits. The values in Table 5 indicate the probability that an absorbed power-law does not provide a good description of the spectrum. The most significant deviations from an absorbed power-law are for J16246a, J18007, and J17508a, which have values of 99.7%, 88%, and 84%, respectively. While an absorbed power-law fit is not a formally acceptable model in these cases, the residuals do not show clear evidence for spectral features such as emission lines.
The measured values exceed the Galactic column density (see Table 5 for both) for J16181 ( cm-2; 90% confidence errors are given) and J19294 ( cm-2). Several other sources have upper limits on that are higher than the Galactic (HI4PI Collaboration et al., 2016), but we note that there may be spatial variations in on scales smaller than the angular resolution of the survey. The measured values show that most of the spectra are intrinsically hard. Nine of the sources have photon indices with best fit values less than or equal to 1.5. J17058a is the softest source with . While J17096 and J17508b have and , respectively, the errors are relatively large. We use these fits to determine the fluxes in the 2–10 keV band. The “unabsorbed” fluxes are only corrected for the interstellar (Galactic) column density. With these fluxes, we use
| (4) |
to assess the absolute probability of finding a source in the search region (defined by ) as bright as the candidate sources. We find using the unabsorbed fluxes in Table 5 and Equations 1 and 2, which provides a range of probabilities depending on whether we use the Sugizaki et al. (2001) or the Fornasini et al. (2014) expression. The range of probabilities for each source is given in Table 5. The least likely sources to be chance coincidences are J15038 (0.97–1.03%), J18007 (1.3–1.7%), and J20310 (1.5–1.6%), and the sources that are most likely to be chance coincidences are J15541 (5.4–10.7%) and J17096 (4.7–13.7%).
While these are the formal probabilities, we can also obtain information by exploring how the Chandra spectra extrapolate into the INTEGRAL band. To accomplish this comparison, we produced 2-bin INTEGRAL spectra using the fluxes in the Bird et al. (2016) catalog, and refit the Chandra spectra jointly with these two higher-energy points. An important caveat is that the INTEGRAL fluxes are averages over 7–8 years (up to 2010) while the Chandra spectrum is from a single observation in 2017. While the source flux (and possibly spectral shape) may be different for Chandra and INTEGRAL, we carry out fits without allowing for an offset between the two. Thus, a mismatch between Chandra and INTEGRAL could be caused by variability or it could indicate that the Chandra counterpart is incorrect. Also, for many of the INTEGRAL spectra, the flux is dropping between the 20–40 and 40–100 keV energy bands, indicating that the spectrum must change slope between Chandra and INTEGRAL. For this reason, we use a power-law with an exponential cutoff, and fit each spectrum with the XSPEC model tbabs*cutoffpl.
Figure 2 shows the Chandra+INTEGRAL spectra, and the parameters are given in Table 6. We also used XSPEC for these fits, but we minimized instead of because the INTEGRAL points are based on fluxes rather than Poissonian counts. In nearly all cases, the tbabs*cutoffpl model provides a reasonably good description of the spectra. One notable exception is J17508a, for which the power-law index is well-constrained by the Chandra spectrum to be soft, and the extrapolation into the INTEGRAL bandpass is below the INTEGRAL fluxes by orders of magnitude. Although this might indicate that J17508b is the correct counterpart, the model does not fit the Chandra+INTEGRAL spectrum very well for J17508b either (), and we discuss the case of IGR J17508–3219 further in Section 4.1. J17096 is another case where the tbabs*cutoffpl model does not provide a very good fit, but it is clear that a better spectrum is required to understand the cause of the residuals. It is possible that J17096 and J18007 both require an extra spectral component at low energies.
3.3 Optical/IR Identifications
We used the VizieR database to search for optical/IR counterparts to the 12 Chandra sources. In seven cases, a Gaia DR2 optical source with a position consistent with the Chandra position was found, and these are listed in Table 7. Parallax measurements are available for six of the sources. They are negative in two cases, but for the four sources with positive parallaxes, the distance estimates from Bailer-Jones et al. (2018) are , , , and kpc for J15038, J16246a, J17508a, and J18007, respectively. Thus, all four sources are Galactic, but it is doubtful that J17508a333Catalog searches also uncovered that this source is the star HD 162186. is the correct counterpart to the IGR source, and J16246a is a questionable counterpart. However, IGR J15038–6021 is a Galactic source at a distance of kpc, and IGR J18007–4146 is a Galactic source at a distance of kpc.
Six of the 12 Chandra sources are present in the AllWISE IR catalog (Cutri & et al., 2014), and the Wide-field Infrared Survey Explorer (WISE) magnitudes at 3.4m (), 4.6m (), 12m () and 22m () are given in Table 8. The WISE colors - and - have been used to identify AGN and blazars (e.g., Massaro et al., 2012; Secrest et al., 2015; Massaro & D’Abrusco, 2016), and we plot these colors for the six sources in Figure 3. It has already been reported by Ursini et al. (2018) that IGR J16181–5407 (and the Chandra source J16181) is likely to be an AGN based on its WISE colors, and Figure 3 shows that the same criterion leads to IGR J17096–2527 (J17096) being a likely AGN. Figure 3 also shows that the two Galactic sources (based on Gaia as discussed above) are far away from the AGN region. J16246b and J19294 are the other two sources in the AllWISE catalog, but we cannot conclude on their nature based on their location in the WISE color-color diagram. However, we note that all four AGN candidates (J16181, J17096, J16246b, and J19294) are listed in AllWISE as having spatial profiles that are inconsistent with a point source in at least one photometric band, and the two Galactic sources (J16246a and J17508a) do not show evidence for extension (see Table 8).
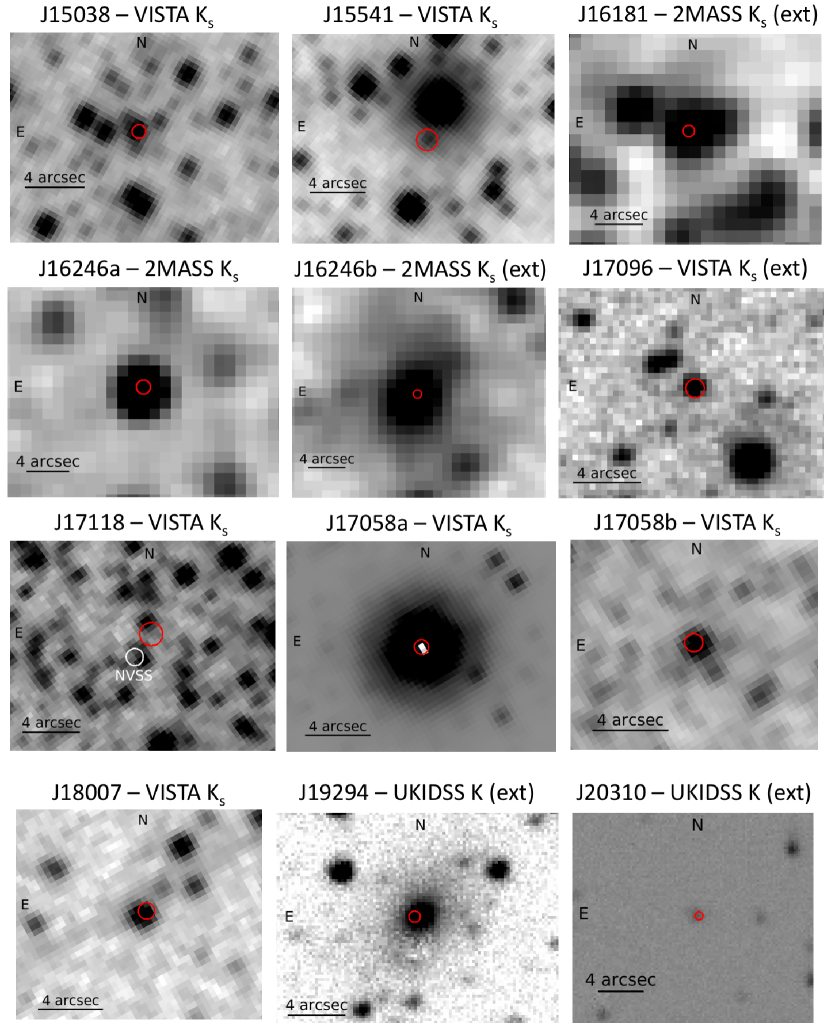
In addition to Gaia and WISE, we found many more optical/IR counterparts to the 12 Chandra sources in the VizieR database. Here, we focus on the near-IR information from the Visible and Infrared Survey Telescope for Astronomy (VISTA; Minniti et al., 2010; McMahon et al., 2013; Minniti et al., 2017), the UKIRT Infrared Deep Sky Survey (UKIDSS; Lucas et al., 2008), and the 2 Micron All-Sky Survey (2MASS; Cutri et al., 2003), providing the , , and / magnitudes in Table 9 and the / images in Figure 4. In the / bands, the sources range in brightness with the faintest sources being J17118 () and J20310 () and the brightest sources being J17508a () and J16246a (). Although J15541 does not appear in the catalogs, Figure 4 shows that it has a faint -band counterpart that is very close to a bright star. In addition, the -band images for J16246b, J19294, and probably J16181 confirm that these sources are extended, making it very likely that they are AGN. It is unclear from the VISTA image whether J17096 is extended, and it is also classified as being a star in the VISTA catalog (see Table 9); however, we still consider it to be likely that J17096 is an AGN based on the WISE information. For J20310, the -band image from UKIDSS may show some extension, and the source is classified as being a galaxy in the UKIDSS catalog.
In summary, the parallax measurements for J15038, J16246a, J17058a, and J18007 show that these four Chandra sources are Galactic, and the / images (Figure 4) are consistent with this in that they do not show evidence that these sources are extended. Based on the sources being extended and/or the WISE colors, J16181, J16246b, J17096, and J19294 are AGN, and J20310 is an AGN candidate based on the UKIDSS information. We discuss the nature of the remaining three sources (J15541, J17118, and J17058b) below.
4 Discussion
The main goal of this work is to determine the nature of the 15 IGR sources (see Table 2) by determining the most likely Chandra counterparts and then using the Chandra localizations along with information in on-line catalogs and databases to classify the sources. There are two IGR sources with two possible Chandra counterparts: IGR J16246–4556 and IGR J17508–3219; and we discuss those cases first. Then, we consider the two sources definitively classified as being Galactic: IGR J18007–4146 and IGR J15038–6021. After that, we discuss the unclassified sources with Chandra counterparts: IGR J15541–5613 and IGR J17118–3155 and then the cases without likely Chandra counterparts.
4.1 IGR sources with 2 candidate Chandra counterparts
For IGR J16246–4556, the two candidate Chandra counterparts that we are considering are J16246a (3.0–3.5%) and J16246b (2.9–3.5%). Both of them have hard spectra ( and , respectively, from the Chandra-only fits) that are consistent with the INTEGRAL fluxes (see Figure 2), and their spurious probabilities are the same because J16246a is about three times brighter while J16246b is only 1.56′ from the center of the INTEGRAL error circle, while for J16246a. Given that the 90% confidence INTEGRAL radius is , an offset of corresponds to the 3 error radius; thus, it is unlikely that the source would be offset by this much, and we note that none of the other Chandra counterparts have values of that are more than (see Table 4). While J16246a may be an interesting source and worthy of attention, we identify J16246b with IGR J16246–4556, making this IGR source an AGN. The fact that J16246b is a galaxy is confirmed by the VizieR search, which shows a detection of the source in the Parkes HI zone of avoidance survey (Staveley-Smith et al., 2016). It is the galaxy HIZOA J1624-45B, which has a distance of 78.7 Mpc. Based on the Chandra and INTEGRAL spectrum, the unabsorbed 0.3–100 keV flux is erg cm-2 s-1, making the luminosity erg s-1.
IGR J17508–3219 has the two candidate Chandra counterparts J17508a and J17508b. Both are outside the (90% confidence) INTEGRAL error circle with and for J17508a and J17508b, respectively. As mentioned earlier, J17508a is a soft source () and is inconsistent with the INTEGRAL fluxes (see Figure 2); thus, we rule out J17508a as the counterpart. For J17508b, the VizieR search shows that it is coincident with the source OGLE-BLG-DN-0184, which is a dwarf nova (DN) non-magnetic CV with a few optical outbursts per year. The typical outburst duration for OGLE-BLG-DN-0184 is 13.1 days where the optical brightness increases from to 15.7 (Mróz et al., 2015). Although 56 CVs appear in the Bird et al. (2016) catalog, nearly all of the CVs that have been classified are IPs or polars, which have highly magnetized white dwarfs. However, some non-magnetic DNe can produce hard X-ray emission above at least 14 keV (Mukai, 2017), and J17508b has a relatively hard spectrum with . Although we consider J17508b to be a possible counterpart, we also note that Landi et al. (2017) reported on a Swift/XRT observation where a third source (#1 in the work of Landi) was detected within the INTEGRAL error circle with a 2–10 keV flux of erg cm-2 s-1 and . Landi source #1 is not detected in the Chandra observation, and the upper limit on the 2–10 keV flux is approximately an order of magnitude lower than the flux detected by Swift. If Landi source #1 is the true counterpart of IGR J17508–3219, this level of variability is surprising given that it is noted to be a persistent source in Bird et al. (2016). Given that Landi source #1 is a hard source within the INTEGRAL error circle, it must be considered as a strong candidate, but we also cannot rule out the possibility that J17508b also contributes to the flux seen by INTEGRAL.
4.2 Galactic Source IGR J18007–4146
IGR J18007–4146 is associated with an XMM-Newton slew source XMMSL1 J180042.8–414651, and the source was also detected by Swift/XRT (Landi et al., 2017). Multiple optical/IR sources are consistent with the XMM and Swift localizations (Landi et al., 2017), but the Chandra position for CXOU J180042.6–414650 that we report allows for a unique identification in multiple optical/IR surveys, including VISTA and Gaia. It is the VISTA source VVV J180042.71–414650.23, and the Gaia counterpart has a parallax distance measurement of kpc. The Chandra energy spectrum is a very hard power-law (), and combining it with the INTEGRAL fluxes indicates that the spectrum turns over at around 25 keV. The 0.3–100 keV flux is erg cm-2 s-1, and this corresponds to a luminosity of erg s-1. Known Galactic source types that may match these properties are CV/IPs or accreting pulsars, which are most often found in HMXBs.
The origin of the optical/IR emission is unclear. If the source is a CV/IP, the emission would be a combination of an accretion disk and a star. Most CV/IPs have late-type stars, and the accretion disk dominates. If the source is an HMXB, then the high-mass star (O- or B-type) would dominate. In either case, the emission is thermal, and we can estimate the temperature using the near-IR colors. The X-ray spectrum does not show evidence for any absorption, with a 90% confidence upper limit of cm-2, corresponding to (Güver & Özel, 2009). Using the VISTA near-IR magnitudes and the Cardelli et al. (1989) extinction law, the dereddened magnitudes are –15.60 and –15.24. Thus, – is between 0.21 and 0.26, which corresponds to a temperature of 6500 K. If this was a stellar temperature, it would correspond to an F5V spectral type, which has . For IGR J18007–4146, if the extinction is zero, then , and if the extinction is at the maximum value (), it would be , and these values correspond to a spectral type of G2V. To accomodate a F5V star, the source distance would need to be 3.5 kpc, which is higher than the Bailer-Jones et al. (2018) value at the 2 level. Regardless of whether the distance could be as high as 3.5 kpc, these calculations show that IGR J18007–4146 does not harbor a high-mass O or B type star. In fact, if there is a significant contribution to the optical/IR emission from an accretion disk, it is possible that the source is a binary with a late-type star. Given the possible classifications mentioned above (a CV/IP or an HMXB), a CV/IP is strongly favored. However, follow-up optical spectroscopy is needed for confirmation.
4.3 Galactic Source IGR J15038–6021
IGR J15038–6021 was also previously reported as a Swift/XRT source by Landi et al. (2017), but the X-ray localization was not adequate to identify a unique optical/IR counterpart. The detection of this source by Chandra as CXOU J150415.7–602123 provides the unique optical/IR identification with the VISTA source VVV 150415.72–602122.87 as well as a Gaia source, which provides a parallax distance of kpc. The X-ray energy spectrum is slightly harder than IGR J18007–4146, and the 0.3–100 keV flux is erg cm-2 s-1, corresponding to a luminosity of erg s-1. This suggests the same possibilities for classifications mentioned above: HMXB or CV/IP.
We carry out a similar calculation as for IGR J18007–4146 using the and magnitudes along with the Gaia distance. Even though IGR J15038–6021 is closer than IGR J18007–4146, it is in the Galactic plane ( = – compared to = – for IGR J18007–4146), and although the best fit value for is zero for both sources, the upper limit for IGR J15038–6021 is higher ( cm-2). This limit on the column density corresponds to (Güver & Özel, 2009), and we calculate dereddened magnitudes of –16.13 and –15.48, giving a range of – values between 0.24 and 0.65 and a range of temperatures between 4000 and 6500 K. This allows for a range of stellar spectral types between K5V and F5V.
Turning to the measurement of the absolute magnitude, assuming the Gaia distance ( kpc), if there is no extinction, then , and if the extinction is maximal (), then . If the errors are included, these absolute magnitudes correspond to spectral types between K5V and A5V. Although this is a large range, it does not cover O and B stars. However, in this case, we must treat the Gaia distance with some caution because the Gaia DR2 catalog indicates that the astrometric noise for this source is significant. Thus, we performed an additional calculation and found that the distance would need to be 10 kpc to move the absolute magnitude of IGR J15038–6021 into the late B-type range. Thus, based on both the temperatures derived above and the fact that it is very unlikely for the true distance to be larger than the Gaia measurement by 6, we conclude that IGR J15038–6021 is likely to be a CV/IP.
4.4 Unclassified Sources with Chandra Counterparts
Although our candidate Chandra counterpart to IGR J15541–5613, CXOU J155413.0–560932, has a relatively high spurious probability of 5.4–10.7%, Figure 2 shows that the spectrum rises throughout the Chandra band with , and the source is also unusual for a Galactic source in having a higher flux in the 40–100 keV band than in the 20–40 keV band. This suggests that IGR J15541–5613 is more likely to be an AGN than a Galactic source. It is conceivable that the high point in the Chandra spectrum at 2 keV is a redshifted iron line, but the statistical significance of the putative line is low. Also, the implied redshift is , and this would indicate a very luminous and rare AGN. Figure 4 shows that, with the bright nearby source, obtaining an optical or near-IR spectrum of IGR J15541–5613 will be challenging, but it may be possible.
For our candidate Chandra counterpart to IGR J17118–3155, CXOU J171135.8–315504, a search of the SIMBAD database shows a possible Very Large Array radio counterpart, NVSS J171135–315506. This radio source is quite bright, and is seen in several radio surveys (Intema et al., 2017; Douglas et al., 1996; Murphy et al., 2007; Condon et al., 1998): the Giant Metrewave Radio Telescope/GMRT (1496 mJy at 150 MHz); the Texas Survey/TXS (606 mJy at 365 MHz); the Molonglo Galactic Plane Survey/MGPS-2 (225 mJy at 843 MHz); and the NRAO VLA Sky Survey/NVSS (165 mJy at 1420 MHz). However, considering the best estimates for the radio positions, only the TXS position is within the Chandra error circle with the other sources being (GMRT), (MGPS-2), and (NVSS) away from the center of the Chandra error circle. The NVSS error circle is shown on the VISTA image (Figure 4), and it is clear that the error region does not overlap with Chandra. We also plotted the NVSS error circle on the Chandra/ACIS image, and none of the 23 ACIS counts fall within the NVSS error circle. We repeated this analysis without the position registration shift (see Table 3), and there are still no ACIS counts in the NVSS error circle. While it would be a somewhat surprising coincidence for these two relatively unusual sources to be as close to each other as they are and not be associated, our analysis does not support an association between the two.
4.5 IGR Sources without Likely Chandra Counterparts
Although Chandra sources were detected in the INTEGRAL error circles for all 15 IGR sources included in this work, there were five cases (IGR J03599+5043, IGR J07202+0009, IGR J16482–2959, IGR J16120–3543, and IGR J20413+3210) where the Chandra sources all had relatively high probability of being chance detections of field sources. The Chandra sources in INTEGRAL error circles of these five IGR sources with the lowest values of are 24.9%, 27.9%, 37.0%, 20.2%, and 21.6%, respectively. We searched the VizieR database to check whether any of the Chandra sources have classified counterpart, and the source with % (CXOU J161147.0–354634)444The Chandra position is R.A. = 16h11m47.04s, Decl. = –35∘46′34.9′′, equinox 2000.0 with a 90% confidence position uncertainty of . is a WISE source (AllWISE J161147.06–354635.0) that has been classified as an AGN based on its WISE colors (Secrest et al., 2015). The 2–10 keV X-ray flux is erg cm-2 s-1. While this may still be a spurious identification, we consider the CXOU/AllWISE source to be a candidate counterpart.
Within the INTEGRAL error circles of the other four IGR sources (IGR J03599+5043, IGR J07202+0009, IGR J16482–2959, and IGR J20413+3210), the Chandra sources with the lowest values have between 5 and 7 counts in the 2–10 keV band. Taking 7 counts (0.0014 c/s) as the upper limit, we can use PIMMS555See https://asc.harvard.edu/toolkit/pimms.jsp to determine the approximate flux upper limit. If we assume and cm-2, we find a flux limit of erg cm-2 s-1 in the 2–10 keV energy band. There are several possible interpretations for these IGR sources. When similar results have previously been obtained for other IGR sources, Tomsick et al. (2016a) consider that those IGR sources may be variable or may have hard spectra (either due to high column densities or hard power-law slopes). It is notable that IGR J03599+5043, IGR J07202+0009, IGR J16482–2959, and IGR J20413+3210 are marked as being variable in Bird et al. (2016) (see Table 1). Another possibility is that these IGR sources are spurious, but the INTEGRAL signal-to-noise values are between 5.9 and 7.5 (Table 1).
5 Summary and Conclusions
Our final results for each of the 15 IGR sources are summarized in Table 10, including the name of the Chandra counterpart or upper limit on the X-ray flux, our conclusion about the source type, and the main evidence we use to come to our conclusion. IGR J15038–6021 and IGR J18007–4146 are strong CV/IP candidates, and this could be confirmed in the future with optical or near-IR spectroscopy. We definitively classify four IGR sources as AGN and three as AGN candidates. This relatively high fraction of AGN may not be too surprising as the new IGR sources found recently are, on-average, fainter than the IGR sources found earlier in the mission. We also note that the plot of near-IR colors measured by WISE (Figure 3), which has been used to identify AGN, may be a useful tool for identifying Galactic sources as well. Finally, although we detected likely Chandra counterparts to IGR J17508–3219 and IGR J17118–3155, the classifications are unclear. Additional X-ray observations of IGR J17508–3219 may be useful to determine if the true counterpart is CXOU J175108.7–322122 or the Landi et al. (2017) Swift source. For IGR J17118–3155, the uncertainty on the X-ray position could be reduced with a longer Chandra observation with the source on-axis.
References
- Arnaud (1996) Arnaud, K. A., 1996, in Astronomical Data Analysis Software and Systems V, ed. G. H. Jacoby, J. Barnes, Vol. 101, Astronomical Society of the Pacific Conference Series, 17
- Bailer-Jones et al. (2018) Bailer-Jones, C. A. L., Rybizki, J., Fouesneau, M., Mantelet, G., & Andrae, R. 2018, AJ, 156, 58
- Bird et al. (2010) Bird, A. J., Bazzano, A., Bassani, L., et al. 2010, ApJS, 186, 1
- Bird et al. (2016) Bird, A. J., Bazzano, A., Malizia, A., et al. 2016, ApJS, 223, 15
- Bonnet-Bidaud et al. (2007) Bonnet-Bidaud, J. M., de Martino, D., Falanga, M., Mouchet, M., & Masetti, N. 2007, A&A, 473, 185
- Cardelli et al. (1989) Cardelli, J. A., Clayton, G. C., & Mathis, J. S. 1989, ApJ, 345, 245
- Chaty et al. (2008) Chaty, S., Rahoui, F., Foellmi, C., et al. 2008, A&A, 484, 783
- Coleiro et al. (2013) Coleiro, A., Chaty, S., Zurita Heras, J. A., Rahoui, F., & Tomsick, J. A. 2013, A&A, 560, A108
- Condon et al. (1998) Condon, J. J., Cotton, W. D., Greisen, E. W., et al. 1998, AJ, 115, 1693
- Cutri & et al. (2014) Cutri, R. M., & et al. 2014, VizieR Online Data Catalog, II/328
- Cutri et al. (2003) Cutri, R. M., Skrutskie, M. F., van Dyk, S., et al. 2003, 2MASS All Sky Catalog of point sources.
- Douglas et al. (1996) Douglas, J. N., Bash, F. N., Bozyan, F. A., Torrence, G. W., & Wolfe, C. 1996, AJ, 111, 1945
- Fornasini et al. (2014) Fornasini, F. M., Tomsick, J. A., Bodaghee, A., et al. 2014, ApJ, 796, 105
- Fortin et al. (2018) Fortin, F., Chaty, S., Coleiro, A., Tomsick, J. A., & Nitschelm, C. H. R. 2018, A&A, 618, A150
- Fruscione et al. (2006) Fruscione, A., McDowell, J. C., Allen, G. E., et al. 2006, CIAO: Chandra’s data analysis system, Vol. 6270, Society of Photo-Optical Instrumentation Engineers (SPIE) Conference Series, 62701V
- Gaia Collaboration et al. (2018) Gaia CollaborationBrown, A. G. A., Vallenari, A., et al. 2018, A&A, 616, A1
- Garmire et al. (2003) Garmire, G. P., Bautz, M. W., Ford, P. G., Nousek, J. A., & Ricker, G. R. 2003, in X-Ray and Gamma-Ray Telescopes and Instruments for Astronomy. Edited by Joachim E. Truemper, Harvey D. Tananbaum. Proceedings of the SPIE, 4851, 28
- Güver & Özel (2009) Güver, T., & Özel, F. 2009, MNRAS, 400, 2050
- HI4PI Collaboration et al. (2016) HI4PI CollaborationBen Bekhti, N., Flöer, L., et al. 2016, A&A, 594, A116
- Intema et al. (2017) Intema, H. T., Jagannathan, P., Mooley, K. P., & Frail, D. A. 2017, A&A, 598, A78
- Kaastra (2017) Kaastra, J. S., 2017, A&A, 605, A51
- Kim et al. (2007) Kim, M., Kim, D.-W., Wilkes, B. J., et al. 2007, ApJS, 169, 401
- Krivonos et al. (2017) Krivonos, R. A., Tsygankov, S. S., Mereminskiy, I. A., et al. 2017, MNRAS, 470, 512
- Landi et al. (2017) Landi, R., Bassani, L., Bazzano, A., et al. 2017, MNRAS, 470, 1107
- Landi et al. (2009) Landi, R., Bassani, L., Dean, A. J., et al. 2009, mnras, 392, 630
- Landi et al. (2012) Landi, R., Bassani, L., Masetti, N., et al. 2012, The Astronomer’s Telegram, 4233
- Lucas et al. (2008) Lucas, P. W., Hoare, M. G., Longmore, A., et al. 2008, MNRAS, 391, 136
- Masetti et al. (2013) Masetti, N., Parisi, P., Palazzi, E., et al. 2013, A&A, 556, A120
- Massaro & D’Abrusco (2016) Massaro, F., & D’Abrusco, R. 2016, ApJ, 827, 67
- Massaro et al. (2012) Massaro, F., Paggi, A., D’Abrusco, R., & Tosti, G. 2012, ApJ, 750, L35
- Mateos et al. (2012) Mateos, S., Alonso-Herrero, A., Carrera, F. J., et al. 2012, MNRAS, 426, 3271
- Matt & Guainazzi (2003) Matt, G., & Guainazzi, M. 2003, MNRAS, 341, L13
- McMahon et al. (2013) McMahon, R. G., Banerji, M., Gonzalez, E., et al. 2013, The Messenger, 154, 35
- Minniti et al. (2017) Minniti, D., Lucas, P., & VVV Team 2017, VizieR Online Data Catalog, II/348
- Minniti et al. (2010) Minniti, D., Lucas, P. W., Emerson, J. P., et al. 2010, New Astronomy, 15, 433
- Mróz et al. (2015) Mróz, P., Udalski, A., Poleski, R., et al. 2015, Acta Astronomica, 65, 313
- Mukai (2017) Mukai, K., 2017, PASP, 129, 062001
- Murphy et al. (2007) Murphy, T., Mauch, T., Green, A., et al. 2007, MNRAS, 382, 382
- Negueruela et al. (2006) Negueruela, I., Smith, D. M., Reig, P., Chaty, S., & Torrejón, J. M. 2006, in ESA SP-604: The X-ray Universe 2005, ed. A. Wilson, 165
- Pavan et al. (2013) Pavan, L., Bordas, P., Puehlhofer, G., et al. 2013, arXiv:1309.6792
- Pavan et al. (2011) Pavan, L., Bozzo, E., Pühlhofer, G., et al. 2011, A&A, 533, A74
- Prusti et al. (2016) Prusti, T., de Bruijne, J. H. J., Brown, A. G. A., et al. 2016, A&A, 595, A1
- Romano et al. (2014) Romano, P., Krimm, H. A., Palmer, D. M., et al. 2014, A&A, 562, A2
- Secrest et al. (2015) Secrest, N. J., Dudik, R. P., Dorland, B. N., et al. 2015, ApJS, 221, 12
- Sguera et al. (2006) Sguera, V., Bazzano, A., Bird, A. J., et al. 2006, ApJ, 646, 452
- Staveley-Smith et al. (2016) Staveley-Smith, L., Kraan-Korteweg, R. C., Schröder, A. C., et al. 2016, AJ, 151, 52
- Sugizaki et al. (2001) Sugizaki, M., Mitsuda, K., Kaneda, H., et al. 2001, ApJS, 134, 77
- Tomsick et al. (2012a) Tomsick, J. A., Bodaghee, A., Chaty, S., et al. 2012a, ApJ, 754, 145
- Tomsick et al. (2012b) Tomsick, J. A., Bodaghee, A., Rodriguez, J., et al. 2012b, ApJ, 750, L39
- Tomsick et al. (2006) Tomsick, J. A., Chaty, S., Rodriguez, J., et al. 2006, ApJ, 647, 1309
- Tomsick et al. (2009) Tomsick, J. A., Chaty, S., Rodriguez, J., Walter, R., & Kaaret, P. 2009, ApJ, 701, 811
- Tomsick et al. (2008) Tomsick, J. A., Kalemci, E., Kaaret, P., et al. 2008, ApJ, 680, 593
- Tomsick et al. (2016a) Tomsick, J. A., Krivonos, R., Wang, Q., et al. 2016a, ApJ, 816, 38
- Tomsick et al. (2016b) Tomsick, J. A., Rahoui, F., Krivonos, R., et al. 2016b, MNRAS, 460, 513
- Ursini et al. (2018) Ursini, F., Bassani, L., Malizia, A., et al. 2018, The Astronomer’s Telegram, 11890, 1
- Verner et al. (1996) Verner, D. A., Ferland, G. J., Korista, K. T., & Yakovlev, D. G. 1996, ApJ, 465, 487
- Walter et al. (2006) Walter, R., Zurita Heras, J., Bassani, L., et al. 2006, A&A, 453, 133
- Wilms et al. (2000) Wilms, J., Allen, A., & McCray, R. 2000, ApJ, 542, 914
- Winkler et al. (2003) Winkler, C., Courvoisier, T. J.-L., Di Cocco, G., et al. 2003, A&A, 411, L1
| IGR Name | 666Galactic longitude converted from INTEGRAL position. | 777Galactic latitude converted from INTEGRAL position. | RA888Source position measured by INTEGRAL and reported in Bird et al. (2016). | Decc | Uncertainty99990% confidence INTEGRAL error radius. | Flux101010The flux measured by INTEGRAL in units of mCrab. | Fluxe | Variability111111As described in Bird et al. (2016), “Y” indicates that the source’s detection significance in the INTEGRAL data is variable at a level of between 10% and 400%. | Significance121212The significance of the INTEGRAL detection in terms of signal-to-noise. |
| (deg) | (deg) | (deg) | (deg) | (arcmin) | (20–40 keV) | (40–100 keV) | |||
| J20310+3835 | 77.77 | –0.49 | 307.755 | +38.576 | 4.54 | 0.3 | — | 5.5 | |
| J15038–6021 | 318.60 | –1.57 | 225.941 | –60.357 | 3.95 | — | 6.4 | ||
| J03599+5043 | 150.58 | –1.74 | 59.973 | +50.728 | 4.01 | Y | 6.3 | ||
| J15541–5613 | 326.38 | –1.90 | 238.527 | –56.216 | 4.32 | 0.2 | Y | 5.8 | |
| J19294+1327 | 49.22 | –2.12 | 292.374 | +13.451 | 3.43 | — | 7.5 | ||
| J16246–4556 | 336.83 | +2.46 | 246.091 | –45.923 | 4.61 | 0.3 | Y | 5.4 | |
| J16181–5407 | 330.35 | –2.62 | 244.533 | –54.103 | 4.61 | — | 5.4 | ||
| J17508–3219 | 357.68 | –2.72 | 267.721 | –32.330 | 2.31 | — | 11.6 | ||
| J17118–3155 | 353.48 | +4.41 | 257.959 | –31.927 | 2.84 | 0.2 | Y | 9.2 | |
| J20413+3210 | 73.96 | –6.02 | 310.384 | +32.219 | 3.42 | 0.3 | 0.4 | Y | 7.5 |
| J07202+0009 | 216.12 | +6.47 | 110.063 | +0.127 | 4.25 | 0.4 | 0.7 | Y | 5.9 |
| J17096–2527 | 358.47 | +8.56 | 257.432 | –25.470 | 2.73 | — | 9.6 | ||
| J18007–4146 | 350.38 | –9.12 | 270.202 | –41.802 | 3.19 | — | 8.1 | ||
| J16482–2959 | 351.94 | +9.52 | 252.145 | –30.019 | 4.25 | Y | 5.9 | ||
| J16120–3543 | 342.36 | +11.35 | 242.974 | –35.754 | 4.69 | Y | 5.3 |
| IGR Name | ObsID | Start Time (UT) | Exposure | RA | Dec | Reference |
|---|---|---|---|---|---|---|
| Time (s) | (deg) | (deg) | ||||
| J20310+3835 | 18969 | 2017 Feb 26, 19.2 h | 4880 | 307.73052 | +38.56095 | our analysis131313We determined this position via analysis of Swift/XRT data. The XRT position is now published in Landi et al. (2017). |
| J15038–6021 | 18970 | 2017 Apr 26, 13.5 h | 4899 | 225.941 | –60.357 | Bird et al. (2016) |
| J03599+5043 | 18971 | 2017 Mar 20, 1.8 h | 5056 | 59.973 | +50.728 | Bird et al. (2016) |
| J15541–5613 | 18972 | 2017 May 22, 5.3 h | 4995 | 238.527 | –56.216 | Bird et al. (2016) |
| J19294+1327 | 18973 | 2017 Feb 24, 5.9 h | 4880 | 292.37417 | +13.45151 | Pavan et al. (2011) |
| J16246–4556 | 18974 | 2017 May 3, 12.6 h | 4886 | 246.091 | –45.923 | Bird et al. (2016) |
| J16181–5407 | 18975 | 2017 May 20, 14.1 h | 5019 | 244.53342 | –54.10272 | Landi et al. (2012) |
| J17508–3219 | 18976 | 2017 May 8, 22.6 h | 5013 | 267.721 | –32.330 | Bird et al. (2016) |
| J17118–3155 | 18977 | 2017 Jan 27, 16.8 h | 4883 | 257.959 | –31.927 | Bird et al. (2016) |
| J20413+3210 | 18978 | 2017 Feb 24, 7.8 h | 4730 | 310.384 | +32.219 | Bird et al. (2016) |
| J07202+0009 | 18979 | 2017 Sep 9, 18.1 h | 4899 | 110.063 | +0.127 | Bird et al. (2016) |
| J17096–2527 | 18980 | 2017 Jan 25, 11.0 h | 4845 | 257.432 | –25.470 | Bird et al. (2016) |
| J18007–4146 | 18981 | 2017 Aug 22, 5.2 h | 4994 | 270.17792 | –41.78028 | our analysisa |
| J16482–2959 | 18982 | 2017 Jun 20, 15.6 h | 4979 | 252.145 | –30.019 | Bird et al. (2016) |
| J16120–3543 | 18983 | 2017 Mar 31, 16.8 h | 4880 | 242.974 | –35.754 | Bird et al. (2016) |
| IGR Name | ObsID | 141414The number of Chandra sources detected on the four ACIS-I detector chips. | 151515The number of matches between the Chandra detections and the Gaia DR2 catalog. | 161616The shifts in the x and y detector coordinate directions in pixels. The conversion is 1 pixel = . | c | Residual171717Average residual (in arcseconds) between the Chandra and Gaia DR2 sources. |
| J20310+3835 | 18969 | 11 | 5 | –0.46 | 0.75 | 0.34 |
| J15038–6021 | 18970 | 12 | 3 | 0.59 | 0.21 | 0.42 |
| J03599+5043 | 18971 | 10 | 0 | — | — | — |
| J15541–5613 | 18972 | 21 | 5 | –0.11 | –0.20 | 0.63 |
| J19294+1327 | 18973 | 17 | 3 | –1.20 | 0.77 | 0.32 |
| J16246–4556 | 18974 | 27 | 5 | 0.09 | –0.41 | 0.43 |
| J16181–5407 | 18975 | 14 | 4 | –0.02 | –0.41 | 0.49 |
| J17508–3219 | 18976 | 28 | 7 | –0.49 | 0.18 | 0.41 |
| J17118–3155 | 18977 | 25 | 4 | 0.54 | –0.21 | 0.62 |
| J20413+3210 | 18978 | 6 | 0 | — | — | — |
| J07202+0009 | 18979 | 26 | 3 | –0.70 | 0.10 | 0.35 |
| J17096–2527 | 18980 | 23 | 7 | 0.20 | 0.69 | 0.38 |
| J18007–4146 | 18981 | 22 | 4 | 0.65 | –0.45 | 0.50 |
| J16482–2959 | 18982 | 13 | 0 | — | — | — |
| J16120–3543 | 18983 | 17 | 1 | — | — | — |
| IGR Name | CXOU Name | Chandra R.A. | Chandra Decl. | Uncertainty18181890% confidence. | 191919The angular distance between the center of the INTEGRAL error circle and the source./202020The size of the 90% confidence INTEGRAL error radius given in Bird et al. (2016). | ACIS | Hardness212121The hardness is given by , where is the number of counts in the 2–10 keV band and is the number of counts in the 0.3–2 keV band. |
| (J2000) | (J2000) | (arcseconds) | (arcminutes) | Counts222222The number of counts, after background subtraction, measured by Chandra/ACIS-I in the 0.3–10 keV band. | |||
| J15038 | J150415.7–602123 | 15h04m15.70s | –60∘21′23.0′′ | 0.46 | 3.69/3.95 | + | |
| J15541 | J155413.0–560932 | 15h54m13.09s | –56∘09′32.6′′ | 0.75 | 3.54/4.32 | + | |
| J16181 | J161807.7–540612 | 16h18m07.74s | –54∘06′12.5′′ | 0.50 | 0.04/4.61 | + | |
| J16246a | J162425.2–460316 | 16h24m25.20s | –46∘03′16.5′′ | 0.67 | 7.92/4.61 | + | |
| J16246b | J162430.7–455514 | 16h24m30.77s | –45∘55′14.1′′ | 0.46 | 1.56/4.61 | + | |
| J17096 | J170950.2–252934 | 17h09m50.27s | –25∘29′34.4′′ | 0.55 | 2.02/2.73 | + | |
| J17118 | J171135.8–315504 | 17h11m35.89s | –31∘55′04.5′′ | 0.81 | 3.08/2.84 | + | |
| J17508a | J175106.8–321827 | 17h51m06.85s | –32∘18′27.9′′ | 0.44 | 3.21/2.31 | – | |
| J17508b | J175108.7–322122 | 17h51m08.78s | –32∘21′22.2′′ | 0.48 | 3.68/2.31 | + | |
| J18007 | J180042.6–414650 | 18h00m42.69s | –41∘46′50.0′′ | 0.51 | 1.68/3.19 | + | |
| J19294 | J192930.1+132705 | 19h29m30.14s | +13∘27′05.7′′ | 0.39 | 0.10/3.43 | + | |
| J20310 | J203055.2+383347 | 20h30m55.28s | +38∘33′47.1′′ | 0.35 | 1.39/4.54 | + |
| IGR Name | 232323The errors on the parameters are 90% confidence. The column density is calculated assuming Wilms et al. (2000) abundances and Verner et al. (1996) cross sections. | 242424From the HI4PI survey (HI4PI Collaboration et al., 2016). | Absorbed Flux252525In units of erg cm-2 s-1. | Unabsorbed Flux262626Only corrected for Galactic absorption. | /dof | 272727The probability that an absorbed power-law does not provide a good description of the spectrum based on a calculation of the variance of according to the method described in Kaastra (2017). | Probability282828Absolute probability that a source of this brightness would be found by chance in the search region. | |
| ( cm-2) | ( cm-2) | (2–10 keV) | (2–10 keV) | |||||
| J15038 | 1.0 | 1.3 | 25/23 | 21% | 0.97–1.03% | |||
| J15541 | 4.3 | 0.8 | 5.8/6 | – | 5.4–10.7% | |||
| J16181 | 0.5 | 5.0/7 | – | 2.3–2.8% | ||||
| J16246a | 0.8 | 90/57 | 99.7% | 3.0–3.5% | ||||
| J16246b | 0.8 | 16/10 | 75% | 2.9–3.5% | ||||
| J17096 | 3.6 | 0.2 | 5.6/4 | 31% | 4.7–13.7% | |||
| J17118 | 4.2 | 0.3 | 2.8/2 | 19% | 3.9–6.4% | |||
| J17508a | 0.5 | 75/59 | 84% | 1.9–3.2% | ||||
| J17508b | 0.5 | 17/13 | 51% | 3.1–5.6% | ||||
| J18007 | 0.14 | 0.12 | 23/14 | 88% | 1.3–1.7% | |||
| J19294 | 0.8 | 2.1/5 | – | 2.3–4.0% | ||||
| J20310 | 5.6 | 1.5 | – | 9.2/9 | 3% | 1.5–1.6% |
| IGR Name | 292929The errors on the parameters are 90% confidence. The column density is calculated assuming Wilms et al. (2000) abundances and Verner et al. (1996) cross sections. | Unabsorbed Flux303030In units of erg cm-2 s-1, and corrected for Galactic absorption. | /dof | ||
|---|---|---|---|---|---|
| ( cm-2) | (keV) | (0.3–100 keV) | |||
| J15038 | 1.0 | – | 22/24 | ||
| J15541 | 2.4 | 36 | 5/7 | ||
| J16181 | 5/8 | ||||
| J16246a | 22 | 86/58 | |||
| J16246b | 12 | 18/11 | |||
| J17096313131The quality of the fit does not allow for errors to be calculated. The tbabs*cutoffpl does not provide a good description of the spectrum. | 0.0 | –2.0 | 9 | 21/5 | |
| J17118 | 1.4 | 8 | 6/3 | ||
| J17508ac | 0.15 | 2.9 | 500 | 323232This is the flux for the model shown in Figure 2, which is well below the INTEGRAL measurements. | 192/60 |
| J17508b | 0.8 | 179 | 43/14 | ||
| J18007 | 0.12 | 43/15 | |||
| J19294 | – | 2/6 | |||
| J20310 | 4.6 | – | 9/10 |
| IGR Name | Gaia Number | Separation333333The angular separation between the Chandra position and the Gaia catalog position. | -Magnitude | Parallax | Distance343434From Bailer-Jones et al. (2018). |
|---|---|---|---|---|---|
| (in DR2) | (arcsec) | (milliarcsec) | (kpc) | ||
| J15038 | 5876459780108921216 | 0.072 | |||
| J15541 | 5836092447721411584 | 0.245 | – | — | |
| J16246a | 5942431027538084608 | 0.463 | |||
| J17096 | 4112378173142821248 | 0.049 | – | — | |
| J17508a | 4043524762244704000 | 0.240 | |||
| J17508b | 4043518508770139648 | 0.383 | — | — | |
| J18007 | 6725376279628784384 | 0.331 |
| IGR Name | AllWISE Name | Separation353535The angular separation between the Chandra position and the AllWISE catalog position. | ex363636A “0” indicates that the source is consistent with being a point source, and a “1” indicates that the profile is not well-described as a point source in at least one photometric band. | ||||
| (arcsec) | |||||||
| J16181 | J161807.75–540612.3 | 0.21 | 1 | ||||
| J16246a | J162425.20–460316.7 | 0.28 | — | 0 | |||
| J16246b | J162430.78–455514.4 | 0.35 | 1 | ||||
| J17096 | J170950.25–252934.7 | 0.41 | 1 | ||||
| J17508a | J175106.84–321827.8 | 0.11 | 0 | ||||
| J19294 | J192930.14+132705.9 | 0.32 | 1 |
| IGR Name | Catalog | Source (arcsec) | Separation373737The angular separation between the Chandra position and the catalog position. | / | Class383838The classification based on the spatial profile, where –2 is a probable star, –1 is a star with probability 90%, and 1 is a galaxy with probability 90%. | ||
| J15038 | VISTA | VVV J150415.72–602122.87 | 0.230 | –1 | |||
| J15541 | — | — | — | — | — | See Figure 4. | — |
| J16181 | 2MASS | 2MASS J16180771–5406122 | 0.365 | — | — | ||
| J16246a | 2MASS | 2MASS J16242520–4603169 | 0.409 | — | |||
| J16246b | 2MASS | 2MASS J16243080–4555144 | 0.519 | — | |||
| J17096 | VISTA | VHS 472814537075 | 0.135 | — | –1 | ||
| J17118 | VISTA | VVV J171135.91–315503.61 | 0.929 | –2 | |||
| J17508a | 2MASS | 2MASS J17510684–3218276 | 0.054 | — | |||
| J17508b | VISTA | VVV J175108.76–322122.39 | 0.306 | –1 | |||
| J18007 | VISTA | VVV J180042.71–414650.23 | 0.339 | –1 | |||
| J19294 | UKIDSS | UGPS J192930.11+132705.7 | 0.372 | 1 | |||
| J20310 | UKIDSS | UGPS J203055.29+383347.1 | 0.180 | 1 |
| IGR Name | Chandra counterpart or | Source Type | Evidence |
| 2–10 keV flux limit | |||
| J03599+5043 | — | — | |
| J07202+0009 | — | — | |
| J15038–6021 | CXOU J150415.7–602123 | CV/IP? | Gaia distance, near-IR magnitudes, X-ray spectrum |
| J15541–5613 | CXOU J155413.0–560932 | AGN? | X-ray spectrum |
| J16120–3543 | CXOU J161147.0–354634? | AGN? | WISE colors |
| J16181–5407 | CXOU J161807.7–540612 | AGN | WISE colors and extended in near-IR |
| J16246–4556 | CXOU J162430.7–455514 | AGN | Extended in near-IR |
| J16482–2959 | — | — | |
| J17096–2527 | CXOU J170950.2–252934 | AGN | WISE colors and extended in near-IR |
| J17118–3155 | CXOU J171135.8–315504 | ? | ? |
| J17508–3219 | CXOU J175108.7–322122? | ?393939While CXOU J175108.7–322122 is classified as a Dwarf Nova and may be the counterpart, source #1 detected in the field by Swift (Landi et al., 2017) is a variable source that is another possible counterpart. | ? |
| J18007–4146 | CXOU J180042.6–414650 | CV/IP? | Gaia distance, near-IR magnitudes, X-ray spectrum |
| J19294+1327 | CXOU J192930.1+132705 | AGN | Extended in near-IR |
| J20310+3835 | CXOU J203055.2+383347 | AGN? | Likely extended in near-IR |
| J20413+3210 | — | — |