Measurement of Beam-Correlated Background Neutrons from the Fermilab Booster Neutrino Beam in ANNIE Phase-I
Abstract
The Accelerator Neutrino Neutron Interaction Experiment (ANNIE) aims to make a unique measurement of neutron yield from neutrino-nucleus interactions and to perform R&D for the next generation of water-based neutrino detectors. In this paper, we characterize beam-induced neutron backgrounds in the experimental hall at Fermi National Accelerator Laboratory. It is shown that the background levels are sufficiently low to allow the next stage of the experiment to proceed. These measurements are relevant to other Booster Neutrino Beam (BNB) [1] experiments located adjacent to ANNIE Hall, where dirt neutrons and sky-shine could present similar backgrounds.
1 Introduction
The Accelerator Neutrino Neutron Interaction Experiment (ANNIE) [2] aims to make the first detailed measurement of the number of neutrons produced by muon neutrinos interacting with nuclei. Measurements of the final-state neutron multiplicity are key to improving our understanding of neutrino-nucleus interactions. This in turn improves our understanding of systematic uncertainties in neutrino oscillation experiments, where the energy carried by difficult-to-detect final-state neutrons can degrade the resolution of the reconstructed neutrino energy. Identifying and counting final-state neutrons also provides a new and critical handle on signal-background separation in future proton decay and neutrino experiments [3].
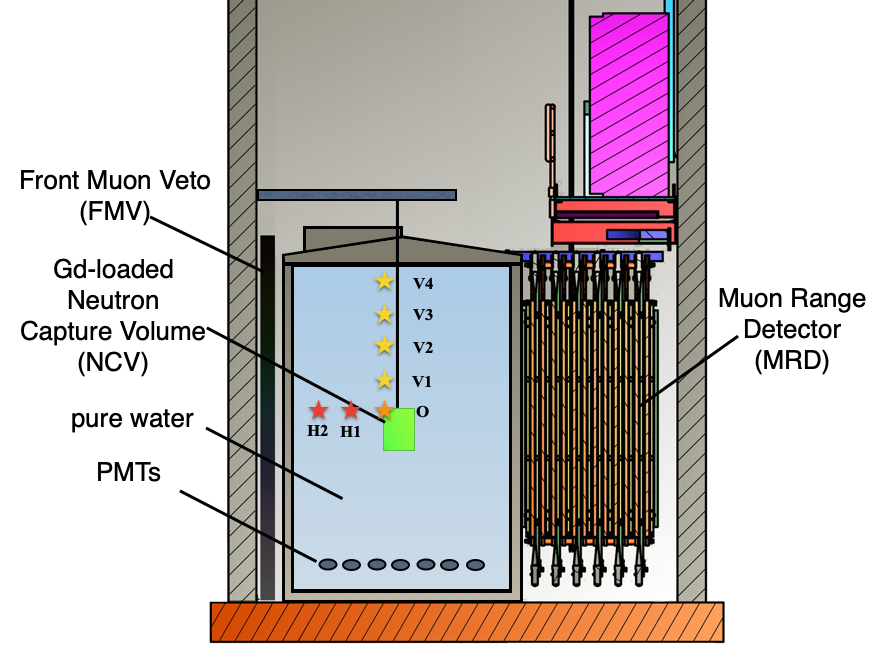
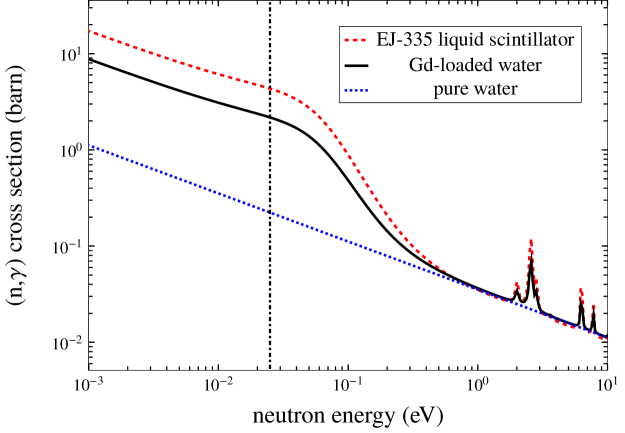
The lower panel of figure 1 shows the detector configuration (referred to as Phase-II) used to perform the final-state neutron multiplicity measurement. The main target consists of an upright cylindrical steel tank filled with of gadolinium-loaded (Gd-loaded) ultra-pure deionized water, instrumented with photodetectors and partially enclosed by a muon detection system. A muon produced by a neutrino interaction in the fiducial volume is reconstructed using the tank photodetectors and muon detection system. Neutrons produced by the neutrino interaction scatter and lose energy through thermalization, allowing them to capture on either H or Gd in the active volume. The fall-off in the neutron capture cross-section with energy for both pure and Gd-loaded water is shown in figure 2. Gd-loading dramatically enhances the cross-section relative to pure water for energies near and below the thermal neutron energy of . The capture produces a delayed signal in the form of a de-excitation -ray cascade, with properties determined by the capturing nuclide. In particular, captures on Gd produce a more easily-detected -ray cascade compared with the cascade from H-capture. At concentrations of Gd by mass, the enhanced cross-section has the added benefit of shortening the time constant for neutron capture from to . These combined effects make Gd-loading essential to the final-state neutron multiplicity measurement.
Because final-state neutrons in ANNIE can travel over a meter before thermalizing and capturing in the ANNIE active volume, neutrino-induced neutrons and background neutrons are spatially indistinguishable. As a consequence, any neutrons entering the tank that are unrelated to the neutrino interaction constitute a potential background for the ANNIE physics program. Restricting the analysis to a narrow time window around the arrival of the neutrino beam spill suppresses a large fraction of the constant-in-time (CIT) background activity arising from processes unrelated to the beam. The residual CIT background can be characterized by taking off-beam triggers. All remaining backgrounds are correlated in time with the beam.
There are two dominant types of beam-correlated neutron backgrounds, both of which are delayed relative to the prompt component from beam neutrino interactions. The first type, referred to as sky-shine, consists of secondary neutrons produced in the beam dump that leak into the atmosphere and enter the detector after undergoing multiple scattering [4, 5]. Preliminary results from the SciBooNE experiment, which previously occupied the ANNIE experimental hall, show an excess of presumed sky-shine events after the beam spill with a clear dependence on detector depth [6]. The dependence of the event count with respect to depth suggests that using a fiducial volume away from the top of the detector would significantly reduce the sky-shine background. The second type of background, known as dirt neutrons, consists of neutrons that arise from beam neutrino interactions occurring in the dirt and rock upstream of the experimental hall. The optically isolated buffer region of water upstream of the ANNIE Phase-II active volume should reduce the dirt neutron flux.
 |
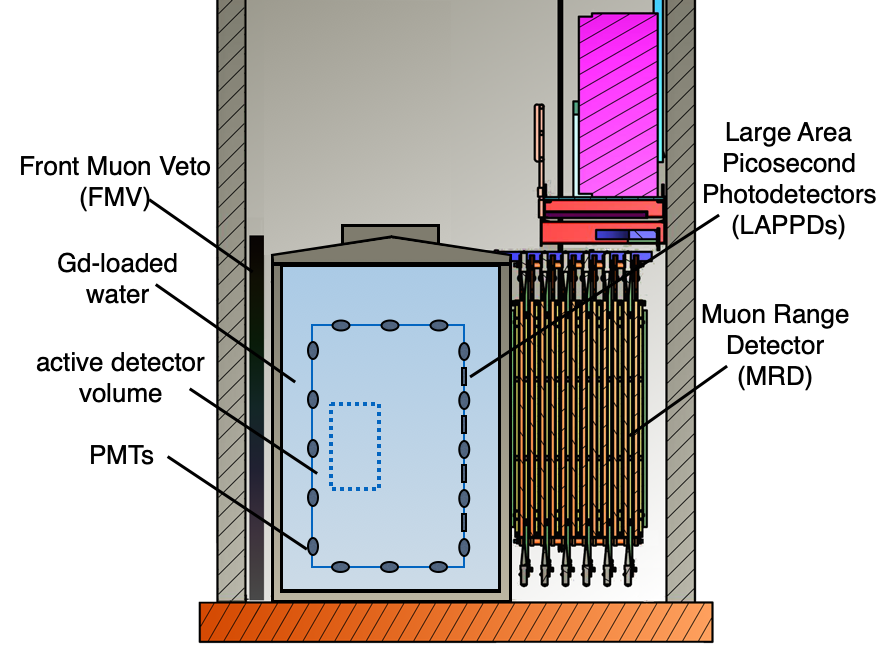 |
In this paper, we report a first measurement of beam-correlated background neutrons in the ANNIE tank as a function of position. This analysis uses data taken in a special configuration (ANNIE Phase-I) of the detector with a pure water target. This configuration is pictured schematically in the upper panel of figure 1. We measure a rapid fall-off of the neutron background with depth and demonstrate that neutron backgrounds in the detector volume are limited. We also use the measured fall-off as a function of distance from the surface of the water and the tank walls in Phase-I to verify that that the proposed buffer region surrounding the optically isolated volume for the main ANNIE neutrino interaction physics program, known as Phase-II (lower panel of figure 1), provides adequate shielding from background neutrons. As the size of this buffer region could only be increased by reducing the size of the optically isolated volume, this indicates that we can achieve the necessary background levels while accommodating a neutrino vertex fiducial volume large enough ( ) to contain the neutrons from neutrino interactions. These results establish the feasibility of the Phase-II physics program.
The measurements presented in this paper are relevant to other Booster Neutrino Beam (BNB) [1] experiments such as the Short Baseline Near Detector (SBND), located adjacent to ANNIE Hall, where dirt neutrons and sky-shine could present similar backgrounds. The techniques described in this paper will also be applicable to any future water-based near detectors, especially those with Gd-loading or water-based liquid scintillators.
2 Experimental design of the neutron background measurement
The ANNIE detector is installed in the BNB at Fermilab at the former location of the SciBooNE [8] detector. The BNB runs at an average rate of . Protons are delivered in 84 bunches over a spill time to a target and horn combination upstream of ANNIE Hall. The nominal number of protons-on-target () per spill is . The beam is estimated to produce pure , with an energy spectrum peaking at around [9].
The ANNIE Phase-I neutrino target and optical instrumentation (shown in figure 1) were contained in a steel tank roughly in diameter by in height. The interior of the tank was covered with a white reflective PVC liner in order to maximize light collection and was filled with of ultra-pure deionized water. An array of 58 upward-facing Hamamatsu R5912 photomultiplier tubes (PMTs) was installed inside the water volume at the base of the tank. All of these PMTs were mounted on an octagonal, stainless-steel inner structure that, along with the attached tank lid, could be lifted out and replaced without moving the tank itself. A set of six plastic scintillator paddles, each with an attached light guide and a PMT, was mounted in a metal frame placed on top of the tank lid. These paddles were used to generate triggers on directionally-selected cosmic muons.
2.1 Neutron Capture Volume (NCV)
The position dependence of beam-correlated neutron backgrounds is characterized using a movable Neutron Capture Volume (NCV) deployed within the tank. The NCV is a acrylic cylinder filled with EJ-335, a Gd-loaded (0.25% w/w) liquid scintillator manufactured by Eljen Technology [10]. Thermal neutron capture on Gd produces a -ray cascade with a total energy of around , which is detectable as a bright flash of light in the scintillator. The radiation length in the NCV is roughly , and thus neutron captures are often not fully contained, limiting the detection efficiency of the volume to around (see section 7). The NCV is moved within the water volume using a sliding winch. A slot on the hatch of the tank lid permits translation of the NCV in the beam direction. All of the data used in this paper were taken in a mode where the NCV was wrapped in successive layers of reflective white plastic to maximize total internal reflection and black plastic to optically isolate it from the rest of the tank. Two PMTs were installed on top of the NCV in order to tag energy depositions in the liquid scintillator.
2.2 Upstream and downstream veto and muon selection
A front muon veto (FMV) consisting of two layers of overlapping scintillator paddles (originally used by the CDF experiment [11]) sits between the tank and the beam. The FMV is used to reject charged particles produced in the dirt and rock upstream of the detector. A muon range detector (MRD) consisting of 11 alternating layers of iron absorber and vertical and horizontal plastic scintillator paddles (previously used by SciBooNE [12]) sits downstream from the neutrino target. For Phase-I, only two layers were instrumented, which was sufficient to tag outgoing muons. From simulation studies using the GENIE generator [13], it is estimated there are approximately charged-current muon neutrino interactions within the fiducial volume per year, of which roughly produce muons that enter and range-out in the MRD.
2.3 Electronics, trigger, and data acquisition system
 |
The detector electronics readout system consists of three subsystems. A Central Trigger Card (CTC) provides synchronization, time-stamping and event tagging. A VME-based system, originally designed for the K0TO experiment [14], digitizes the full waveforms from all of the water PMTs and NCV PMTs at 500 MSamples/sec into a deep buffer capable of recording up to . The VME system is also responsible for generating the triggers from the NCV and water PMTs. Finally, a CAMAC-based TDC system time stamps and records pulses above threshold from the FMV and the MRD.
These systems are integrated using the data acquisition (DAQ) framework ANNIEDAQ [15], a modular and scalable DAQ framework based on ToolDAQ [16]. The software runs in a distributed way on multiple servers and the VME computer cards. It is responsible for run and high voltage control, slow-control monitoring, maintaining the run status database, trigger mode configuration, and managing data from each of the asynchronously-running detector subsystems (FMV, water and NCV PMTs, and the MRD). The electronics and DAQ software are highly scalable and configurable and will serve as the baseline for the ANNIE Phase-II detector.
All trigger signals are managed by the configurable CTC, a CAEN V1495 general purpose VME board with ECL and LVDS inputs and a customizable FPGA. The CTC receives a signal from the BNB facility that provides advance notification of a beam spill arriving (beam trigger) and forwards appropriately time-delayed copies to the VME and CAMAC systems. The CTCalso passes through and timestamps a Global Positioning System (GPS) 1PPS signal, used for synchronization.
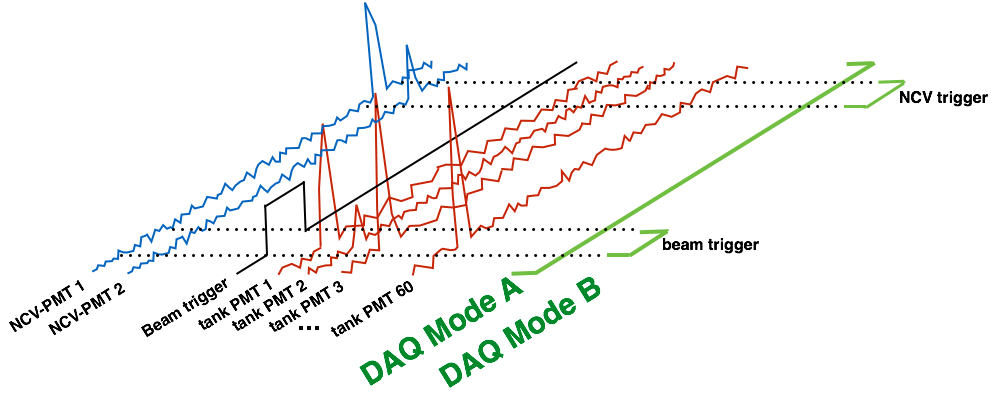
Data taking occurred in two different trigger modes. These two modes are depicted in figure 3. Mode A records the waveforms for all channels for an time window, large enough to include all prompt activity and the majority of subsequent neutron captures. The start of the beam trigger is placed into the buffer, providing a high statistics sample of the pre-beam random background. This mode has the advantage of being insensitive to the detection threshold for neutron captures. Mode B records all channels during a window around the beam trigger. Additional recordings of all channels are stored for any NCV triggers (defined as the OR of the two NCV PMT signals) within a gate following the beam trigger. An onboard 64-bit counter, calibrated using synchronization pulses from the central trigger card and the VME CPU UTC time, permits offline correlation of all ADC records associated with a Mode B trigger. This mode reduced deadtime while requiring a more sophisticated understanding of the relationship between neutron captures and trigger thresholds. It also required the adoption of pre-scaled off-beam triggers.
3 Data taking and selection
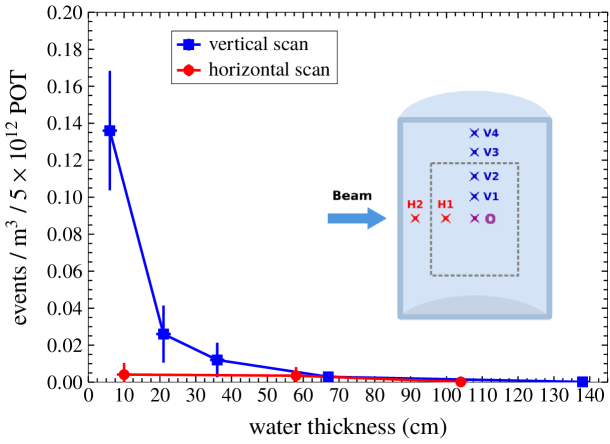
The beam data used in this paper were collected from February through August of 2017, representing a total exposure of . Data were collected with the NCV at seven different positions, shown in the top panel of figure 1 and using a mix of the two DAQ modes described in section 2.3. The NCV positions are numbered with respect to a reference position (position O) at the center of the tank. The H positions are numbered to increase with decreasing horizontal shielding. The V positions are numbered to increase with decreasing water overburden. An uncertainty of was estimated for all NCV position measurements.
All beam data at position V4 were taken in DAQ mode A. All data at positions V1–3 and H1–2 were taken in DAQ mode B. At position O, located in the center of the tank, total exposures of ( beam spills) and ( beam spills) were obtained in DAQ modes A and B, respectively. The measured rates were consistent within one-sigma uncertainties between the two approaches. In addition to the data in table 1, six \isotope[252]Cf source calibration runs were performed with the NCV at position V4, providing a total of source triggers.
Table 1 summarizes the number of beam spills, total exposure, and total number of cosmic muon triggers recorded at each position.
| NCV position | Water overburden101010The thickness of water above the NCV. () | Water shielding111111The thickness of water between the beam-side wall of the tank and the NCV. () | Beam spills | Total exposure () | Average per spill () | Cosmic triggers |
| O | ||||||
| H1 | ||||||
| H2 | ||||||
| V1 | ||||||
| V2 | ||||||
| V3 | ||||||
| V4 |
4 Signal processing
The Phase-I data were processed and analyzed using ToolAnalysis [17], an event reconstruction software package developed by ANNIE collaborators within the ToolDAQ framework [16]. All of the information used in neutron candidate reconstruction and selection is derived from PMTs attached to the NCV and the bottom of the tank. In this section we describe the PMT signal processing.
4.1 Pedestal estimation
The pedestal ADC value for each PMT channel, denoted , is estimated according to the ZE3RA algorithm [18]. To apply this algorithm, 40 time slices, each 25 ADC samples long, are chosen from regions of data that are expected to be pulse-free. For Mode A, the 40 time slices are contiguous and correspond to the first of the full readout window. For Mode B, the time slices are obtained from the first of 40 consecutive data records.
The mean and variance of the 25 ADC values in each time slice are calculated, and the sample variances of neighbouring slices are checked for statistical consistency using an F-test. Time slices that are identified as inconsistent, likely due to the presence of nuisance pulses or electrical transients, are flagged and removed. The pedestal is then taken to be the mean of all ADC values from the remaining slices. The standard deviation of the ADC samples selected in this way is used in PMT pulse finding.
4.2 Pulse finding
To ensure threshold consistency between Mode A and Mode B data, pulse finding is performed prior to pedestal subtraction and calibration for each PMT channel. Starting with the first digital sample in a waveform, ADC values are sequentially checked until the appropriate pulse finding threshold is exceeded. This corresponds to 357 ADC counts for the NCV PMTs and 7 ADC counts above pedestal for the tank PMTs.121212The 357 ADC count threshold was chosen to permit its implementation in hardware rather than software for Mode B. The first digital sample for which this occurs is defined as the beginning of a pulse. The subsequent samples are checked until one of the following conditions is met: (1) an ADC value is found that falls below , or (2) the end of the record is reached. The digital sample fulfilling the logical OR of these criteria is defined to be the end of the pulse.
4.3 Waveform calibration
After subtracting the pedestal, the ADC waveforms are calibrated. For the ANNIE ADC cards, the voltage corresponding to a recorded ADC value is given by the relation:
| (4.1) |
Calibrated waveforms are obtained by applying the conversion formula eq. 4.1 to each of the raw samples.
4.4 Feature extraction
The fully calibrated pulses are characterized using the following feature-extraction parameters: (1) start time: the starting sample index multiplied by the sampling period; (2) peak time: the time at which the maximum ADC value occurred within the pulse (If the maximum ADC value was reached more than once during the pulse, then the earliest sample for which this occurred is used to calculate the peak time); (3) end time: the time corresponding to the first sample after the start of the pulse at which either the ADC signal fell below or the data record ended; (4) raw amplitude: the maximum ADC value recorded during the pulse; (5) calibrated amplitude: the maximum voltage recorded during the pulse, calculated using eq. 4.1 with set equal to the raw amplitude of the pulse; and (6) charge: the time integral of the calibrated version of the pulse divided by the ADC input impedance ().
5 Neutron candidate selection
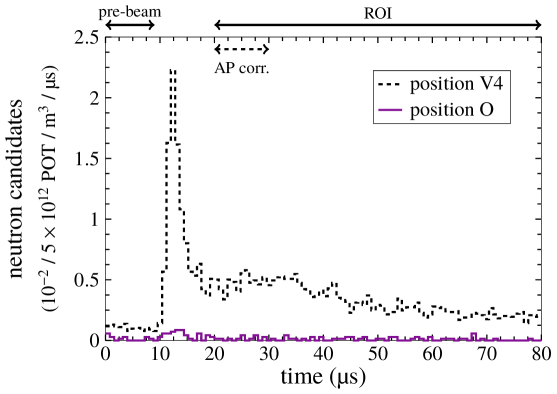
Neutrons are identified by a burst of scintillation light detected within the NCV over a time region of interest between after the beam arrival. Events are selected that have no prompt neutrino interaction in the tank but that have a delayed signal consistent with the capture of neutrons entering from outside the detector volume. The compact size of the NCV provides localization of the neutrons. The quantity and spread of the light detected on the PMTs at the bottom of the water volume are used to veto cosmic muons. The count of neutrons detected in the NCV is divided by the beam exposure and NCV volume to determine the rate of background neutrons per unit volume per beam spill.
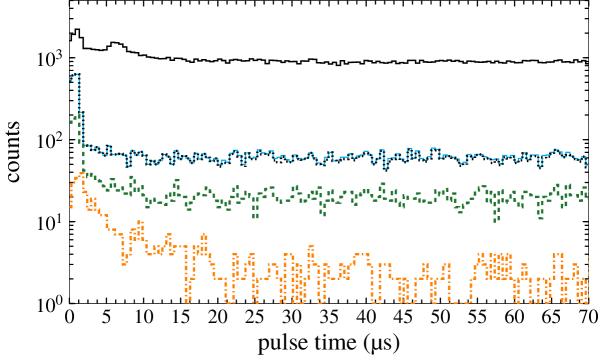
The solid black curve in figure 4 shows the time distribution (relative to the start of the beam spill) for all of the reconstructed pulses found on one NCV PMT (#1) during beam data taking in Mode B at NCV position O (the center of the tank). Three features of the distribution are immediately apparent. The first is a dominant flat component composed primarily of dark pulses with a contribution from cosmic-ray muons. The second is a peak synchronous with beam arrival. This corresponds primarily to beam neutrino interactions in the tank, with an admixture of beam-induced muons. A later peak, attributable to a combination of fast neutron scatters and after-pulsing, appears roughly after the first.
Rather than relying on simulations to estimate efficiencies for individual analysis cuts, we measure the combined efficiency from all cuts folded with the acceptance of the NCV, as described in section 7. Thus any cut efficiencies and purities described in this section are provided solely for heuristic purposes and have not been used directly in the final measurement.
5.1 NCV coincidence requirement
To reduce the number of spurious events due to dark noise and after-pulsing, neutron capture candidates were selected by requiring two pulses, one from each NCV PMT, whose start times (calculated as described in section 4.2) fell within a coincidence window. The earlier start time is designated as the time of the event. The solid cyan curve in figure 4 shows the time distribution of neutron candidates remaining after the NCV coincidence requirement is applied. While the beam-correlated peak at is still present, the second peak at has disappeared, as would be expected if it is largely composed of after-pulses on NCV PMT #1.
Given the measured dark rates of the NCV PMTs ( for PMT #1 and for PMT #2) we estimate the rate of accidental coincidences for our chosen coincidence window to be . This translates to a negligible contribution of counts per spill from accidental NCV coincidences.
5.2 After-pulsing requirement
NCV coincidences due to after-pulsing can be suppressed by requiring that a coincidence occur at least after the most recently-accepted neutron candidate. However, it is not possible to distinguish spurious candidates due to after-pulsing and events in which a fast neutron scatters within the NCV shortly before a true neutron capture. Neutrons produced by trace radioisotopes and cosmic-ray spallation constitute a CIT background that was considered in our calibration of the NCV (see section 6). Apart from these, the only important source of fast neutrons that may enter the ANNIE detector is the beam itself. We assume in our definition of the after-pulsing cut that, by after the start of the beam spill, any beam-correlated neutrons that are found inside the detector have dropped below the NCV detection threshold for proton recoils. In order to avoid losing signal while still suppressing the majority of after-pulses, the the after-pulsing suppression cut is only applied to NCV coincidences recorded between after beam arrival.
The dotted black histogram in figure 4 shows the small effect of applying the after-pulsing cut to the Position O beam data. Given a low overall probability of producing neutrons and a low probability of two genuine neutron captures occurring within , the signal efficiency for this cut is estimated to approach in the time window of interest.
5.3 Total charge cut
To suppress NCV coincidences from cosmic- and beam-induced muons, neutron candidates were eliminated if their energy deposition in the scintillator exceeded the maximum expected from a fully-contained neutron capture -ray cascade (see figure 7). Based on the NCV charge-to-energy calibration described in section 7.2, a loose cut of on the maximum total charge on the two NCV PMTs was adopted. This conservative choice, which corresponded to a deposited energy of about (see eq. 6.1 and table 2) minimized signal loss. The dashed green histogram in figure 4 shows the neutron candidates that remain after applying the cut , where and are the charges collected by NCV PMTs #1 and #2, respectively, to the candidates in the dotted black histogram. Since this cut is more than three times the energy expected from neutron captures, we expect negligible signal loss.
5.4 Water PMT veto cut
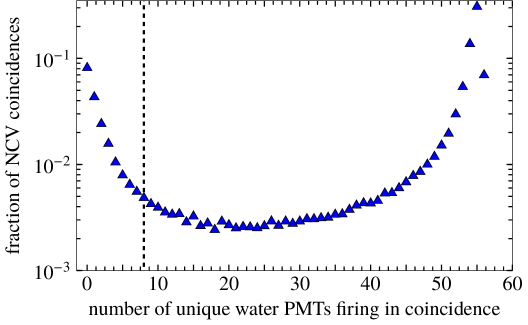
Muons that exit the NCV after traveling only a short distance through the scintillator may deposit an energy low enough to pass the NCV total charge cut. The majority of these muons will produce enough light to activate the PMTs at the bottom of the tank. On the other hand, from simulations we calculate that 98% of neutron captures occurring within the NCV produce pulses on 8 or fewer water tank PMTs. Figure 5 shows the number of water tank PMTs that recorded a pulse within of an NCV coincidence event (blue triangles). The coincident events show a bimodal distribution in the number of tank PMTs that fired. The peak near zero, corresponding to true neutron captures, drops to within a factor of three of the accidental background at 8 PMTs. The peak near 55 PMTs corresponds to muons traversing the NCV. We veto the latter events by rejecting neutron candidates with more than 8 water tank PMTs firing within of the event start time. The resulting pulse time distribution (after applying this and previous cuts) is shown by the dash-dotted orange curve in figure 4.
This cut removes of the cosmic-ray calibration sample. Any residual contamination is addressed via the CIT background subtraction in section 8.
6 Calibration measurements
The calibration measurements required to estimate the neutron detection efficiency of the NCV include a direct measurement of neutrons from a \isotope[252]Cf fission source and a measurement of the energy threshold of the NCV.
6.1 Arrival time distribution of detected neutrons from a \isotope[252]Cf source
Californium-252 is a commonly used radioisotope with a half-life of 2.6 years. In of its decays, \isotope[252]Cf undergoes spontaneous fission to produce an average of neutrons [19] and -rays [20] per fission. Since the fission -rays and neutrons are emitted nearly simultaneously, a -ray-based trigger provides a clean neutron sample. For our \isotope[252]Cf source calibration runs, the NCV was placed at position V4 at the top center of the tank. A small dark box containing an LYSO [21] scintillation crystal coupled to a small photomultiplier tube was placed on the tank hatch above the NCV. The output of the PMT observing the LYSO crystal was connected to a discriminator, and the \isotope[252]Cf source was placed directly above the crystal. Pulses above the discriminator threshold, attributable to fission -rays scattering within the crystal, triggered the acquisition of a DAQ Mode A readout window with a reduced () pre-trigger region.
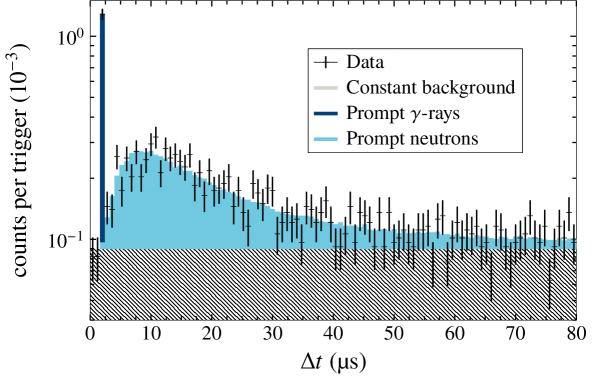
In order to obtain a useful calibration of the neutron detection efficiency, the CIT background and neutron candidates faked by -rays must be separated from the \isotope[252]Cf fission neutrons. We do this by measuring the time spectrum of all neutron candidates in the \isotope[252]Cf runs relative to the start of their respective data acquisition window. The structure of the resulting time distribution is shown in figure 6. The prompt -rays appear as a sharp spike in the third bin. The broad bump peaking just before has an exponential tail whose time constant matches the expected value for thermal neutron captures in the NCV liquid. In section 7.1 we fit simulations-derived models for these components to the neutron candidate time distribution to extract the NCV efficiency.
6.2 NCV energy threshold measurement using cosmic muon data
The cosmic muon trigger for ANNIE Phase-I selected a specific set of downward going muon tracks passing nearly directly through the NCV. This sample of through-going muons, combined with information from normal beam data, was used to calibrate the energy threshold of the NCV. This was done in several steps: (1) estimating the charge threshold for NCV coincidence events from PMT pulse data, (2) using through-going cosmic muon data to estimate the peak charge, and (3) combining the peak charge measurement with information from simulations to obtain a conversion factor between the summed charge on the two NCV PMTs and the energy deposited in the NCV liquid scintillator.
6.2.1 Charge threshold measurement
Because the algorithms used to reconstruct the PMT pulses rely on a threshold based on pulse amplitude rather than charge, the total charge collected by the two NCV PMTs for events at threshold should be distributed about some mean value (). To estimate the mean of the threshold charge distribution, a Gaussian fit was performed in the vicinity of the peak of the distribution of the total charge () collected on the two NCV PMTs for a large sample of NCV coincidence events (at all positions) with and with the after-pulsing cut applied. The result of the fit, , is given in the first row of table 2.
6.2.2 Peak charge measurement
To determine the total charge () on the two NCV PMTs associated with the corresponding peak in the cosmic trigger data, a sample of NCV coincidence events recorded at position O (center of the tank) was analyzed. Each of the selected events occurred within of a downward muon candidate being observed by the cosmic ray trigger. A Gaussian fit to the peak of the cosmic muon charge distribution in the data yielded the results shown in the second row of table 2.
6.2.3 Calculation of the energy threshold
To estimate the charge-to-energy conversion factor for the NCV, simulations of muons passing through the NCV were compared with data taken using the selection from section 6.2.2. In the simulations, a cosmic muon event generator originally written for the G4beamline code [22] was adapted for use with the RAT-PAC detector simulation package [23]. A Gaussian fit was used to estimate the peak location of the deposited energy () at .
| Parameter | Variable | Best-fit value131313Parameter errors are statistical only | Fit | DOF141414Degrees of freedom |
| Threshold summed NCV PMT charge peak | 5.1 | 14 | ||
| Downward muon summed NCV PMT charge peak | 7.7 | 7 | ||
| Simulated downward muon energy deposition peak | 2.3 | 6 |
Assuming that the total charge measured by the NCV PMTs is approximately a linear function of the energy deposited in the liquid scintillator, the NCV energy threshold may be written in the form
| (6.1) |
where is the summed charge on the NCV PMTs at threshold, and the ratio is used as a charge-to-energy conversion factor.
7 Estimation of the NCV efficiency
The NCV efficiency (i.e., the fraction of true neutron captures within the NCV that are actually detected) is estimated using two independent techniques. The first technique relies on a direct measurement of detected neutrons from the \isotope[252]Cf fission source. The second is an indirect estimate based on the energy threshold of the NCV, as calibrated using through-going cosmic muons. Both methods rely on simulations to relate the measured quantities to the NCV efficiency. However, they rely on independent calibration datasets and are primarily sensitive to different aspects of the simulation models. We combine the results from the two approaches to obtain the final measured value of the NCV efficiency and its estimated uncertainty (see Section 10.2).
7.1 Measuring the NCV efficiency with a \isotope[252]Cf source
As noted in section 3 and section 6.1, six \isotope[252]Cf source calibration runs were performed with the NCV at position V4, providing a total of Mode A data acquisition windows taken when the calibration system triggered on a prompt -ray from a \isotope[252]Cf fission. Figure 6 shows the arrival time distribution of neutron candidate events relative to the start of the associated data acquisition window. This distribution includes three components: a prompt flash from fission -rays interacting in the NCV (shown in dar blue), a flat, CIT component (shown in gray), and an excess following the flash with a characteristic shape due to neutron captures (shown in light blue).
To extract the NCV efficiency, a maximum likelihood fit to the time distribution in figure 6 is performed using the ROOT [24] interface to MINUIT [25]. The fission -rays only contribute to a single time bin and are modeled as a single-bin delta function. The CIT component is assumed to be flat, which is consistent with the pre-flash region of the time spectrum. The shape of the neutron time distribution is taken from ANNIE RAT-PAC detector simulations together with version 2.0.3 of the FREYA event generator [26, 27]. The neutron cross sections used in these simulations were taken from version 4.5 of the Geant4 Neutron Data Library [28].
Formally, the log-likelihood is
| (7.1) |
with corresponding to the measured number of events in the th time bin and the expected number of counts in the th time bin, , given by
| (7.2) |
The three fit parameters are the NCV efficiency , the CIT background rate in Hz (), and the fraction of fissions that result in a -ray detection in the NCV (). The quantity represents the neutron acceptance of the NCV, i.e., the probability that a \isotope[252]Cf fission produces a true neutron capture inside the NCV during the th time bin. This is derived from the \isotope[252]Cf source simulations via the formula
| (7.3) |
where is the number of simulated captures that occurred in the th time bin, and is the number of simulated fissions. and are the number of data acquisition windows and the width of a single time bin.
The values of the best-fit parameters are summarized in table 3. The comparison of this fit result to the source calibration data is shown in figure 6. This method results in a measured NCV efficiency of
| (7.4) |
| Parameter | Variable | Best-fit value |
| NCV efficiency | ||
| Background event rate (Hz) | ||
| -ray event probability | ||
| Reduced chi-squared statistic |
7.2 Estimating the NCV efficiency using the energy threshold
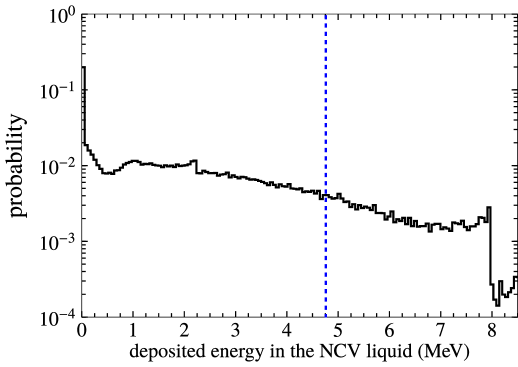
The second method for estimating the NCV efficiency uses simulations to predict the fraction of true neutron captures that deposit energy in the NCV liquid scintillator above the measured detection threshold of 4.76 MeV. The black curve in figure 7 shows the distribution of the total energy deposition within the scintillator for the simulated neutron captures that occured in the NCV liquid volume. A negligible number of external neutron captures produced energy deposits in the NCV. The dashed blue line in figure 7 shows the measured energy threshold of the NCV.
The NCV efficiency, is the ratio of the simulated NCV capture events with energy depositions above , divided by the total number of simulated NCV captures:
| (7.5) |
The statistical error shown in eq. 7.5 was found by computing with the value of adjusted by a plus or minus one-sigma error.
8 Computing the beam-induced neutron event count
8.1 Subtraction of the constant-in-time (CIT) background
As discussed in section 1, neutron backgrounds for ANNIE’s Phase-II physics measurements will consist of a CIT component arising from natural radioactivity and a component correlated in time with spills from the BNB. Because the first of these components can be characterized in situ using an off-beam or zero-bias trigger, the goal of ANNIE Phase-I is to isolate and estimate the rate of beam-induced neutron backgrounds in the detector.
We obtain an estimate of the number of beam-induced neutron events at each NCV position by subtracting an estimate of the CIT component from the total count of neutron candidates observed within window after the start of each beam spill.
8.1.1 CIT background estimation using pre-beam data
All of the data collected in position V4 and a portion of the position O data were recorded in DAQ Mode A, where the acquisition time window included of pre-beam data. In order to ensure that the sample had no contamination from the beam, the prior to beam start is excluded, leaving a total of per trigger for estimating the CIT background. We therefore designate the number of events from the first of the DAQ Mode A readout window that pass all selection cuts as . Figure 8 shows that the pre-beam event rate is substantially higher at position V4 than with the considerable shielding at position O. For those positions where Mode A data are not available, we used the pre-beam data from the most shielded position (O) to estimate the CIT background.
The general equation for , the pre-beam estimate for the number of neutron candidates attributable to CIT background, is
| (8.1) |
Here the scaling factor accounts for the difference in duration of the post-beam region of interest () and the pre-beam region used to estimate the CIT background (). The measured systematic uncertainty in the time intervals and is less than one part in and is therefore neglected in this analysis. The factor is the ratio of recorded beam triggers for the position in question and position O, and is only applicable for the positions where Mode A data are not available.
8.1.2 CIT background estimation using late-time data
At some point after a beam trigger (but before the arrival of a new beam trigger) the event rate should return to baseline. For positions with Mode B data available we had access to neutron candidate events recorded after the signal region of interest and used a period after beam arrival to obtain a second, independent estimate of the CIT component. We denote the number of events in this time period that pass all selection cuts by . The late-time estimate of the number of counts attributable to the CIT background can then be written as
| (8.2) |
where .
8.2 After-pulsing correction
As previously noted, the after-pulsing cut is applied uniformly to the pre-beam data but is not applied to neutron candidate pairs in beam data when the first neutron arrives during the initial after the beam. This prevents the suppression of neutron captures that follow shortly after proton recoils induced by fast neutrons. However, this also means that true after-pulses are not suppressed during this same time period.
| Signal criteria | Signal events | After-pulses | () |
| Beam data, mode A, position V4 | |||
| Beam data, mode B, all positions | |||
| Cf source data, mode A, position V4 | |||
| Weighted mean |
In order to correct for this effect, we calculate the ratio of after-pulses to neutron candidate events by comparing the neutron candidate yield before and after applying the after-pulsing suppression cut. This is done for time periods starting post-trigger, using both \isotope[252]Cf calibration data and beam data taken at several positions. The resulting after-pulse rates, with statistical errors, are summarized in table 4. After-pulse-per-neutron rates obtained in the first after beam crossing are roughly a factor of two higher, confirming the presence of additional fast neutrons during this time period. We take a weighted average of all results in table 4 to obtain an after-pulse-per-neutron rate of .
8.3 Beam-correlated neutron event counts
The final number of beam-correlated neutron candidate events, corrected for both the CIT background and after-pulsing, is given at any position by
| (8.3) |
where () is the raw neutron count in the first (remaining ) of our signal region of interest. The quantity
| (8.4) |
is a weighted average of the two different CIT background estimates where the weights
| (8.5) | ||||
| (8.6) |
are the reciprocals of the statisical variances from each measurement. The neutron event count results are summarized in table 5. In the third column, the statistical uncertainty on is given by the standard error . At position V4, for which no Mode B data were taken, we use with a statistical uncertainty of .
9 Computing the beam-induced neutron event rate
Figure 8 shows the exposure-normalized neutron candidate event rates as a function of time for NCV positions V4 and O, recorded using DAQ Mode A. Both distributions show a peak in coincidence with the neutrino beam due to prompt activity, distinct from neutron captures. In the center of the tank, a large fraction of the prompt activity likely corresponds to neutrino interactions within the NCV. At the surface, this activity extends a few microseconds after the beam and is likely dominated by fast neutrons scattering off of nuclei in the scintillator.
NCV position () O 339 69 48 0.013 0.11 0.16 H1 60 21 13 0.35 0.24 0.40 H2 743 192 62 0.41 0.19 0.60 V1 254 22 34 0.29 0.20 0.15 V2 866 229 59 1.2 0.23 0.9 V3 368 124 29 2.6 0.35 1.5 V4 3825 0 109 13.6 0.9 3.1
After removing the CIT background contribution, we can calculate the number of beam-induced neutrons that captured in the NCV by
| (9.1) |
where is the background-subtracted number of observed neutron candidate events integrated over the time window of interest and is the NCV efficiency.
The beam-induced neutron event rate (i.e., neutron captures per unit volume per spill) is calculated at each position from
| (9.2) |
where the exposure is the total number of normalized to nominal spills of , and is the volume of the NCV liquid. The results of this calculation, with full statistical and systematic errors, are summarized in table 5 and graphically illustrated in figure 9. Using these rates and correcting for differences in the time constant and capture rates between 0.25% Gd-loaded scintillator and 0.1% Gd-loaded water, it is possible to estimate the expected beam-induced neutron background rates for ANNIE Phase-II.
10 Systematic uncertainties in the beam-induced neutron event rate
10.1 Systematic uncertainties on
| NCV position | CIT event rate () | |
| pre-beam (Mode A) | V4 | |
| O | ||
| late-time (Mode B) | O | |
| H1 | ||
| H2 | ||
| V1 | ||
| V2 | ||
| V3 |
The largest systematic uncertainty on the raw neutron count arises from the CIT background subtraction. We have two independent estimates of the CIT background at every position except V4 (where only Mode A data are available). For positions other than V4 and O, the pre-beam estimate of the CIT background rate (see section 8.1.1) is taken to be identical to the most shielded position (O) and is thus likely to be an underestimate. The post-beam method, on the other hand, has the potential to overestimate the CIT background due to beam contamination. Table 6 summarizes the CIT event rates obtained with both methods. We see that for the inner positions (O, V1, and H1) the post-beam CIT background estimate is consistent with the position O pre-beam estimate. For the positions closer to the edge and top of the tank, the differences between the post-beam and position O pre-beam estimate noticeably increase, leading them to dominate the systematic uncertainty. As described in section 8.3, we estimate the final CIT background count at each position () and its statistical uncertainty using a statistically weighted mean of the two measurements and its standard error. Treating the two measurements as belonging to a simple random sample (of size two) allows one to compute a sample standard deviation
| (10.1) |
which we take as the systematic error.
The systematic uncertainty on the after-pulsing subtraction is small and has been neglected. Because of this the systematic errors on are identical to those on and have been omitted in table 5.
10.2 Measurement of and associated systematic error
To determine the final measured value of the NCV efficiency, we adopt the same general approach that was used to combine two independent measurements of the CIT neutron candidate event rate (see sections 8.3 and 10.1). In this case, the two measurements of interest are the NCV efficiency calibrations performed with a \isotope[252]Cf source (section 7.1) and with cosmic-ray muons (section 7.2). The NCV efficiency and its statistical error are calculated using a statistically weighted mean of the two measurements and its standard error. The reciprocal of each measurement’s statistical variance is used as a weighting factor. As in section 10.1, we treat the two efficiency measurements as forming a simple random sample, and we take the sample standard deviation as an estimate of the systematic uncertainty. The combined measurement of the NCV efficiency is thus given by
| (10.2) |
10.3 Systematic uncertainties in exposure and volume scaling
For the uncertainty on beam exposure , we adopt the systematic uncertainty found during routine calibrations of the beam current toroids [29]. We also adopt uncorrelated uncertainties of for the NCV vessel’s outer dimensions and for its wall thickness, leading to a relative uncertainty on the NCV liquid volume of .
10.4 Combined uncertainty estimate
The combined statistical and systematic uncertainty on the beam-induced neutron event rate at each position is derived by analytically propagating both the statistical and the previously described systematic uncertainties. The uncertainties on the factors , and (used to estimate the CIT background) are negligible and therefore omitted. The resulting systematic uncertainties appear in the last column of table 5.
11 Implications for the ANNIE neutron multiplicity measurement
We can predict both the dominant source and expected rate of beam-correlated background neutrons for the ANNIE Phase-II physics program. Table 5 shows that the background event rate observed at the top center of the tank (i.e., position V4) is significantly larger than at all other positions, including the most upstream location, H2. This result is consistent with the beam-induced neutron background being dominated by sky-shine rather than dirt neutrons, and it qualitatively agrees with previous SciBooNE results that showed a large excess of events near the top of the detector briefly after the beam crossing [6]. The rapid fall-off of the background event rate over just of depth is consistent with a soft neutron energy spectrum.
In order to ensure efficient containment of final-state neutrons, the Phase-II measurement will select only events with neutrino interaction vertices in a small () fiducial region vertically centered in the tank and slightly upstream of the tank center in the beam direction. The full water volume will be doped with a concentration by mass of dissolved Gd. Neutron capture candidates will be accepted anywhere in the active volume bounded by the tank PMTs.
The dashed line on the inset of figure 9 shows which NCV positions are located within the active detection volume of the ANNIE Phase-II detector. The active region will be located from below the water line (at the top) to below the water line (at the bottom). Similarly, the octagonal footprint of the inner region of the detector will be away from the wall of the tank at the octagon corners and as far as at the midpoint of each side. The highest beam-induced background neutron rate within this active volume was measured at position V2 to be 0.012 neutrons per per spill. This rate continued to drop with depth until position O where it is consistent with zero within errors.
The ANNIE Phase-II detector is expected to see an average of no more than one neutrino interaction per 150 BNB spills. Since neutrino interactions and background neutrons are statistically independent, the per-spill neutron rate can be thought of as the probability of detecting a background neutron following a signal neutrino interaction in Phase-II.
Using the estimated background rates within the expected active volume of ANNIE Phase-II, it is possible to place an upper bound on the contribution of the beam-induced neutron background to ANNIE signal events. The projections given here are highly conservative and rely on two assumptions. First, the rates along the horizontal scan are assumed to be radially symmetric. This assumption is likely accurate for any side-penetrating neutrons that originate from sky-shine. The dirt-neutron rates would, if anything, be lower on the downstream side of the tank. Second, we take the background rates below of water to be constant and consistent with those measured along the horizontal scan at depth (positions O, H1 and H2).
With these assumptions, we integrate the interpolated rates over the active volume to obtain an estimated average rate of beam-correlated background neutrons per ANNIE Phase-II signal event. This is nearly an order of magnitude below the expected 0.42 primary neutrons per charged-current neutrino interaction derived from GENIE simulations.
To account for correlations between NCV positions when assessing the uncertainty on , we relied on Monte Carlo simulations. In a set of five hundred thousand trials, for each NCV position was varied about its measured value based on the statistical and systematic uncertainties for each term in eq. 8.3. With the exception of and , which were treated as Poisson random variables, all other quantities were varied by sampling corrections from a normal distribution with mean zero and standard deviation equal to the quoted uncertainty of interest. The NCV detection efficiency , total exposure , and NCV volume were likewise varied about their central values for each trial, but the same factors were used at all NCV positions. Unphysical negative rates were set to zero during each trial in agreement with the “method of sensitivity limit” proposed by Lokhov and Tkachov [30]. One-sigma errors on were obtained by computing empirical confidence intervals using the results from the Monte Carlo trials.
There are two considerations that will bias our estimate of slightly high relative to the true neutron background in Phase-II. The first is that the shielding effect from Gd-loaded water (where thermal neutrons have a shortened diffusion length) is likely to be slightly higher than the measured shielding effect from the pure water volume in Phase-I. The second is that the neutron capture time in the Gd-loaded scintillator of the NCV is shorter than that in Gd-loaded water. This means that the Phase-I signal window will capture slightly more background neutrons (which have a higher probability of coming in at late times relative to the beam) relative to the same window in Phase-II. We can therefore confidently say that the beam-induced neutron background in ANNIE Phase-II will be acceptably low.
12 Conclusions
In this paper we present an estimate of neutron backgrounds derived from measurements in the Neutron Capture Volume of the ANNIE Phase-I detector. Quantifying the size of these backgrounds is important in establishing the feasibility of the ANNIE Phase-II physics program.
Neutron backgrounds are highest at the top of the tank at a rate of per cubic meter per spill. These backgrounds drop off rapidly with depth to be consistent with zero for most of the inner volume. With all of our assumptions erring on the side of overestimating these backgrounds, we still obtain an event rate of beam-induced background neutrons per neutrino interaction in ANNIE Phase-II. Comparing this result with a GENIE prediction of 0.42 neutrons per charged-current neutrino interaction in ANNIE allows us to conclude that the beam-correlated background neutron rate is acceptably low for the Phase-II physics measurements.
The position dependence of these backgrounds is consistent with a flux of low-energy sky-shine neutrons, mostly at the top of the tank, that drops off rapidly with depth. Optically isolating the active volume of the ANNIE Phase-II detector below the top of the water line and from the side will suffice to reduce these backgrounds to an acceptable rate.
The results presented in this paper are relevant to other BNB experiments such as SBND, located adjacent to ANNIE Hall, where dirt neutrons and sky-shine could present similar backgrounds. The techniques described in this paper will also be applicable to any future water-based near detectors, especially those with Gd-loading or water-based liquid scintillators. The operational experience gained during Phase-I has informed the design of ANNIE Phase-II.
Acknowledgements
This work could not have been accomplished without the support, personnel, facilities, and resources of Fermi National Accelerator Laboratory. The collaboration owes a special thanks to James Kilmer and the rest of the engineering staff for their guidance in the design and mechanical aspects of the detector. John Voirin and his technical staff were essential in the deployment and staging of this experiment. Geoffrey Savage and Michael Cherry provided critical guidance and assistance in the process of designing, certifying, and deploying our readout electronics. A special thanks to Yau Wah at the University of Chicago for his generous loan of the K0TO readout boards used in the data acquisition system. The ANNIE collaboration would like to dedicate the success of this effort to the memory of William “Bill" Lee, our experimental liaison who served as a guide, mentor, and friend to so many of our collaborators. The activities of the ANNIE experiment are supported by the U.S. Department of Energy, Office of Science, Office of High Energy Physics under contracts DE-SC0016326 and DE-SC0019214, together with the Science and Technology Facilities Council and the Scottish Universities Physics Alliance (United Kingdom). JF Beacom is supported by NSF Grant PHY-1714479. M Wetstein is supported by DE-SC0017946 and his startup fund at Iowa State. M. Sanchez, F. Krenrich, and A. Weinstein are supported by DE-SC0015684. M. Sanchez would like to acknowledge her support under NSF-1056262 and M. Wetstein acknowledges support through the McCormick Fellowship at U. Chicago for much of the early work that lead to the proposal of the ANNIE experiment. V. Fischer and S. Gardiner are supported by the DOE National Nuclear Security Administration through the Nuclear Science and Security Consortium under award number DE-NA0003180.
References
- Stancu et al. [2001] I. Stancu, et al., Technical Design Report for the 8 GeV Beam, Technical Report FERMILAB-DESIGN-2001-03, Fermi National Accelerator Laboratory, 2001.
- Back et al. [2017] A. Back, et al., Accelerator Neutrino Neutron Interaction Experiment (ANNIE): Preliminary results and physics phase proposal, arXiv preprint arXiv:1707.08222 (2017).
- Beacom and Vagins [2004] J. F. Beacom, M. R. Vagins, Anti-neutrino spectroscopy with large water Cherenkov detectors, Phys. Rev. Lett. 93 (2004) 171101.
- Lee et al. [1976] W. Lee, et al., Observation of the reaction , Phys. Rev. Lett. 37 (1976) 186–189.
- Mukherjee et al. [2001] B. Mukherjee, R. M. Ronningen, P. Grivins, P. Rossi, Further evaluation of neutron skyshine dose in vicinity of the K1200 superconducting cyclotron of the NSCL using bubble dosimeters, AIP Conf. Proc. 600 (2001) 108–110.
- Takei [2008] H. Takei, Identification of recoil proton tracks for a neutrino neutral-current elastic scattering cross-section measurement at SciBooNE, 2008. Talk presented at the April Meeting of the American Physical Society.
- Brown et al. [2018] D. Brown, et al., ENDF/B-VIII.0: The 8th major release of the nuclear reaction data library with CIELO-project cross sections, new standards and thermal scattering data, Nuclear Data Sheets 148 (2018) 1 – 142. Special Issue on Nuclear Reaction Data.
- Kurimoto [2009] Y. Kurimoto, The SciBooNE experiment at FNAL, Nucl. Phys. B - Proc. Suppl. 188 (2009) 182–184. Proceedings of the Neutrino Oscillation Workshop.
- Aguilar-Arevalo et al. [2009] A. A. Aguilar-Arevalo, et al., The Neutrino Flux prediction at MiniBooNE, Phys. Rev. D79 (2009) 072002.
- Eljen Technology [2016] Eljen Technology, Gadolinium Loaded EJ-331, EJ-335, 2016.
- Pauletta [2001] G. Pauletta, Scintillation counters for the CDF muon upgrade, Int. J. Mod. Phys. A 16 (2001) 1139–1142.
- Hiraide et al. [2008] K. Hiraide, et al., Search for charged current coherent pion production on carbon in a few-GeV neutrino beam, Phys. Rev. D78 (2008) 112004.
- Andreopoulos et al. [2010] C. Andreopoulos, et al., The GENIE Neutrino Monte Carlo Generator, Nucl. Instrum. Meth. A614 (2010) 87–104.
- Sugiyama et al. [2015] Y. Sugiyama, et al., The Data Acquisition System for the KOTO Experiment, IEEE Trans. Nucl. Sci. 62 (2015) 1115–1121.
- Richards and Eisch [2018] B. Richards, J. Eisch, ANNIEDAQ Phase 1, https://doi.org/10.5281/zenodo.1489338, 2018.
- Richards [2018] B. Richards, ToolDAQ Framework v2.1.1, https://doi.org/10.5281/zenodo.1482767, 2018.
- Richards et al. [2018] B. Richards, et al., ToolAnalysis Phase1, https://doi.org/10.5281/zenodo.1489983, 2018.
- Neves et al. [2011] F. Neves, et al., ZE3RA: the ZEPLIN-III reduction and analysis package, J. Inst. 6 (2011) P11004.
- Bé et al. [2008] M.-M. Bé, et al., Table of Radionuclides, volume 4 of Monographie BIPM-5, Bureau International des Poids et Mesures, Pavillon de Breteuil, F-92310 Sèvres, France, 2008.
- Valentine [2001] T. E. Valentine, Evaluation of prompt fission gamma rays for use in simulating nuclear safeguard measurements, Ann. Nucl. Energy 28 (2001) 191–201.
- Saint-Gobain Crystals [2018] Saint-Gobain Crystals, LYSO scintillation material, https://www.crystals.saint-gobain.com/sites/imdf.crystals.com/files/documents/lyso-material-data-sheet.pdf, 2018.
- Roberts and Kaplan [2007] T. J. Roberts, D. M. Kaplan, G4beamline simulation program for matter-dominated beamlines, in: Proceedings of the 2007 IEEE Particle Accelerator Conference (PAC), pp. 3468–3470.
- Seibert et al. [2014] S. Seibert, et al., RAT (is an Analysis Tool) User’s Guide, http://rat.readthedocs.io/en/latest/, 2014. Accessed: 2017-06-09.
- Brun and Rademakers [1997] R. Brun, F. Rademakers, ROOT — An object oriented data analysis framework, Nucl. Inst. and Meth. A 389 (1997) 81–86.
- James and Winkler [2004] F. James, M. Winkler, MINUIT User’s Guide, 2004.
- Verbeke et al. [2018] J. Verbeke, J. Randrup, R. Vogt, Fission Reaction Event Yield Algorithm FREYA 2.0.2, Comp. Phys. Comm. 222 (2018) 263–266.
- Verbeke et al. [2016] J. Verbeke, J. Randrup, R. Vogt, Fission Reaction Yield Algorithm FREYA 2.0.2 user manual, Technical Report LLNL-SM-705798, Lawrence Livermore National Laboratory, 2016.
- Agostinelli et al. [2003] S. Agostinelli, et al., Geant4–a simulation toolkit, Nucl. Inst. and Meth. A 506 (2003) 250–303.
- Aguilar-Arevalo et al. [2009] A. A. Aguilar-Arevalo, et al., Neutrino flux prediction at MiniBooNE, Phys. Rev. D 79 (2009) 072002.
- Lokhov and Tkachov [2015] A. V. Lokhov, F. V. Tkachov, Confidence intervals with a priori parameter bounds, Phys. Part. Nucl. 46 (2015) 347–365.