Weathering Adaptation: Grid Infrastructure Planning in a Changing Climate
Abstract
Decisions related to electric power systems planning and operations rely on assumptions and insights informed by historic weather data and records of past performance. Evolving climate trends are, however, changing the energy use patterns and operating conditions of grid assets, thus altering the nature and severity of risks the system faces. Because grid assets remain in operation for decades, planning for evolving risks will require incorporating climate projections into grid infrastructure planning processes. The current work traces a pathway for climate-aware decision-making in the electricity sector. We evaluate the suitability of using existing climate models and data for electricity planning and discuss their limitations. We review the interactions between grid infrastructure and climate by synthesizing what is known about how changing environmental operating conditions would impact infrastructure utilization, constraints, and performance. We contextualize our findings by presenting a case study of California, examining if and where climate data can be integrated into infrastructure planning processes. The core contribution of the work is a series of nine recommendations detailing advancements in climate projections, grid modeling architecture, and disaster preparedness that would be needed to ensure that infrastructure planning decisions are robust to uncertainty and risks associated with evolving climate conditions.
keywords:
Grid infrastructure , Climate change , Uncertainty analysis , Infrastructure planning , Risk mitigation1 Introduction and Motivation
A steady supply of electricity is fundamental to the normal and productive functioning of modern society. Climate change and severe weather make it more difficult to operate the electric system reliably. As a result, events such as Hurricanes Sandy and Maria, and recent wildfires in California, have led to blackouts. Electric power systems will need to adapt to new climate realities; to do so, it will be necessary to revise the models and types of data that inform operational and planning decisions [1].
Decades of scientific research inform our current understanding of climate science, energy systems, and the interactions between them. Yet questions remain about the underlying physical processes in both disciplines, as well as about how emissions will unfold over the next century. For example, methods for interpreting global climate projections to anticipate severe weather events are still under development [2]. The characteristics of severe weather events are also evolving, indicating that historic data are not representative of present or future conditions [3]. Continuing to use historic data is problematic because grid infrastructure components installed today will remain in operation for decades to come. Using climate projections to inform critical infrastructure investments may reduce our exposure to the risks we can anticipate, in light of what we currently know about climate change.
Despite abundant research characterizing climate impacts on grid infrastructure, making decisions about if and how to mitigate these impacts remains a challenge. It would be cost-prohibitive (and likely unnecessary) to build a system that could operate reliably in any possible climate future [4], and we may need to accept certain risks that we could opt to mitigate today. Yet research shows that climate trends will fundamentally transform the performance and risk exposure of grid assets [5, 6]. Failure to incorporate climate impacts into planning decisions could leave critical infrastructure unnecessarily exposed to risks that we could feasibly avoid [7].
In other sectors, agencies have established guidelines and best-practices for incorporating climate information into decision-making processes (see, for example, [8, 9, 10]). These efforts identify and quantify climate vulnerabilities and outline possible mitigation strategies. Though simple decision analysis models may be suitable in some planning contexts, the severe consequences associated with failure to detect unmitigated risks in electric power systems suggests that comprehensive analysis of climate impacts is warranted [11]. This analysis will require operationalizing climate projections, quantifying impacts on environmental and operating characteristics relevant to power systems, and evaluating near- and long-term implications of grid operations and planning decisions. Figure 1 illustrates these information flows. Collaboration between scientists and practitioners will be necessary [12, 13], and state or federal planning authorities can play a critical role in coordinating how information are acted upon by different types of decision-makers. Long-term investment decisions will ultimately need to assess the costs associated with mitigating climate risks and the ramifications of allocating limited resources to mitigate certain risks but not others. The societal implications of possible risk scenarios (i.e., wildfires, widespread blackouts, rising energy costs), motivate the need to incorporate climate information into assessments of infrastructure vulnerabilities that are (or will be) present. Effective policy can prevent duplication of efforts, educate practitioners about the nature and the limitations of existing climate data, and define best practices.
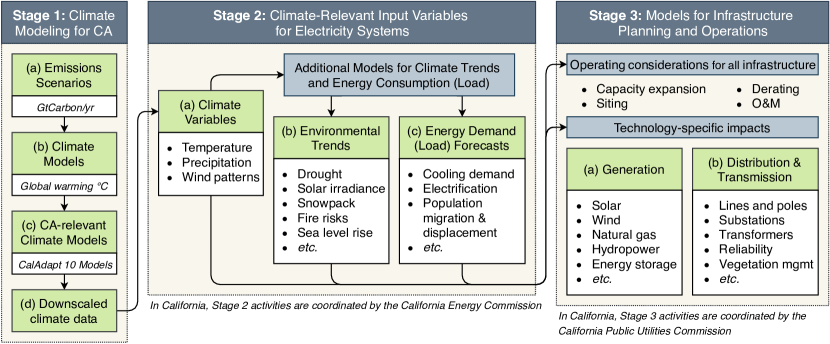
The current work synthesizes what is known now about the interactions between grid infrastructure and climate and provides recommendations for moving forward. We focus on a case study of California: a state that has already done a great deal of research to develop data and guidelines to begin incorporating climate considerations into decision-making processes. Our contributions are threefold: First, we provide background on climate models, grid planning models, and decision-making processes that inform if, how, and where investments are made. Next, we review the factors that must be considered for future planning and discuss how the models listed in Figure 1 would need to evolve to quantify grid/climate interactions in a detailed and comprehensive way. Finally, we offer recommendations for decision-makers in California’s electric sector to begin to act upon climate projections. With these recommendations, we identify specific actions that researchers, practitioners, and policymakers can take to ensure that our understanding of climate risks to grid infrastructure continues to advance.
We provide background on electricity infrastructure planning and climate adaptation efforts in California in Section 2. Then, following the flow of information in Figure 1, we provide background on climate modeling (Stage 1 activities) in Section 3. The climate-relevant input variables for electricity systems listed in Stage 2 are introduced and discussed in Section 4. Considerations for translating those climate inputs into infrastructure planning models are discussed in Section 5 (covering generation, distribution, and transmission). We provide overarching recommendations in Section 6 and conclude in Section 7.
2 The California planning context: Electricity systems and climate adaptation
2.1 Electricity system planning
In California, electric utilities share primary responsibility for energy- and electricity-related planning and oversight with two state agencies and the state’s independent grid operator (A). The California Energy Commission (CEC) generates hourly demand forecasts for its Integrated Energy Policy Report (IEPR). The California Public Utilities Commission (CPUC) and regulated utilities use these forecasts to identify investments needed to continue to provide reliable, safe, and cost-effective electricity service. Demand forecasts also inform transmission planning decisions overseen by the California Independent Systems Operator (CAISO).
The IEPR forecast includes scenarios related to weather, energy efficiency, and load growth futures [14]. Planning decisions that must be robust to extreme weather events are informed by a 1-in-10 weather year generated from statistical analysis of historic data [15].
Two of the IEPR scenarios include climate adjustments for “low” and “high” temperature rise scenarios. Further documentation is necessary to understand how these adjustments account for changes in consumption for each end use [16]. However, the documentation suggests that adjustments are based on the temperature-sensitivity of existing load and do not consider more profound changes in energy consumption (see Section 4.3). Because the IEPR load forecasts are used throughout the state to inform planning decisions, incorporating a rigorous assessment of climate impacts here could help decision-makers account for climate impacts in a consistent and coordinated manner [17].
Aside from load impacts, modeling processes that inform infrastructure planning do not account for climate trends. A contains a thorough discussion of existing infrastructure planning processes in California and the data flows between them. In many cases, modeling assumptions and architecture may need to be revised to comprehensively factor in existing climate-grid interactions (Section 5).
2.2 Climate change adaptation
The State of California initiated climate research and planning efforts in the late 1980’s; these efforts are detailed in [16] and [9]. Here, we summarize recent and ongoing efforts specifically related to adaptation and infrastructure. These include research into potential climate impacts, efforts to operationalize climate data, and legislative and regulatory directives for planning agencies.
California solicits adaptation research through the state’s climate change assessments, a joint effort by the Governor’s Office of Planning and Research, the California Natural Resources Agency, and the CEC. Starting in 2006, the state has completed four rounds of assessments. These examine physical vulnerabilities, adaptation options, and research needs [18].
Executive Order S-13-2008 initiated strategic planning processes for sea level rise and climate adaptation [19], resulting in guidance documents in both areas. The sea level rise guidance document (updated in 2018) provides a synthesis of state-of-the-art science on sea level rise, and outlines best-practices for coastal adaptation [20]. Notably, the document takes a step-wise approach to setting risk tolerances, and acknowledges that these may differ across categories of decision-making. For example, an “extreme” scenario is included for consideration for “high-stakes, long-term decisions” [20, p.4,25]. The climate adaptation guidance document, issued in 2009, underscores the importance of a data clearinghouse—namely CalAdapt, then under development—to “synthesize existing California climate change scenarios and climate impact research” [21].222Additional resources hosted by the CA Governor’s Office of Planning and Research include datasets and planning guidelines for climate adaptation by local planning agencies (e.g., see: [22]).
Legislative actions in 2015 and 2016 built on these efforts: Senate Bills 379 and 246 and Assembly Bills 1482 and 2800 established mechanisms to coordinate adaptation efforts, required state agencies to consider climate change while planning for state infrastructure, and directed stakeholders to use CalAdapt data when assessing local climate vulnerabilities [23, p.117]. One initiative formed out of this legislation was the Climate-Safe Infrastructure Working Group, which recommended adaptive planning, whereby decision-makers move forward with currently-available information while taking note of information gaps [24]. The working group emphasized the need to confront changes in both average and extreme weather conditions [24], and to use probabilistic methods to deal with uncertainty in risk [25]. Our own recommendations build on these principles (Section 6).
In April 2018, the CPUC opened a rulemaking focusing on climate change adaptation [26]. Designed to integrate climate awareness into grid infrastructure planning and regulatory decision-making statewide, the proceeding asked stakeholders to suggest approaches, data sources, and tools to “address climate adaptation in a consistent manner” [27]. Here, we contribute to this effort by examining climate information, modeling needs, and decision processes specific to adapting electric grid infrastructure to maintain safe and reliable service under evolving climate conditions.
3 Background on climate modeling
Climate models use assumptions about worldwide emissions to predict possible short- and long-term trends in weather variables. We do not know precisely how emissions or climate dynamics will play out over the next century. State-of-the-art climate projections use a range of modeling assumptions designed to capture different possible climate futures. The different stages of the climate modeling process are described in detail below.
3.1 Global emissions scenarios
Emissions scenarios describe the amount of carbon and other greenhouse gases injected into the atmosphere. The Intergovernmental Panel on Climate Change (IPCC) releases data for a range of possible emissions scenarios, or Representative Concentration Pathways (RCPs). These are numbered by the increase in radiative forcing (a metric of global warming, reported in W/m2), and include RCP2.6, 4.5, 6.5 and 8.5 W/m2.
Climate data localized to California are readily available for RCP8.5 and RCP4.5. RCP8.5 describes a “business as usual” trajectory where emissions increase at current rates for the remainder of the century. In RCP4.5, emissions increase over the next 50 years, then decrease to below 1990 levels by 2100.
These two scenarios were selected during a 2015 analysis of climate information for state water resources planning [28], when available data for other emissions scenarios were not as comprehensive. Climate projections are continuously being updated to reflect new emissions pathways and advances in our understanding of climate dynamics. Decisions about which data to use must be periodically revisited as climate science advances.
3.2 Climate models
Climate projections come from global circulation models (GCMs) that characterize the physical dynamics driving circulation and heat transfer between the Earth’s atmosphere, land, oceans, and ice caps. As these interactions are not perfectly understood, teams of scientists have developed a library of GCMs that incorporate modeling assumptions designed to capture different possible dynamics, reported in [29]. Over 50 climate projections for different GCMs and emissions scenarios are consolidated in the Coupled Model Intercomparison Project (CMIP) [30].
A 2015 study mined the most recent models (CMIP5) to identify suitable projections to inform water resource planning in California [28]. Fifteen models were found to accurately characterize regional weather systems. Of these, ten accurately predicted precipitation metrics particularly relevant to water resource planning [28], and were chosen for wide dissemination through CalAdapt [31]. The relevance of these models to support applications beyond water resources (e.g., grid infrastructure planning) remains to be examined.
The CEC selected a smaller subset of four models to support the Fourth Climate Change Assessment [32]. These models cover a similar range of temperature and precipitation outcomes as the 10 models. In 2017, the CEC recommended that these four models (with the RCP4.5 and RCP8.5 emissions scenarios) should be used for energy sector planning [23, p.137]. In 2019, the CPUC directed electric utilities to use the 10 GCMs available within CalAdapt (with RCP8.5) for decisions related to planning, investment, and operations [33].
3.3 Downscaled climate models
The spatial resolution of GCM outputs is very coarse (250 to 600 km), making raw climate projections ill-suited for use in granular planning decisions. A mathematical process called “downscaling” is used to infer variability in weather conditions within large GCM grid cells to estimate changes at finer geographic scales. Temporal downscaling may also infer variability on finer time-scales. Downscaling is necessary to generate data suitable to inform most applications, particularly those where climate impacts are sensitive to regional weather variation, and where planning decisions must be robust to extreme (rather than average) conditions.
There are two common approaches for downscaling GCM data. Dynamic downscaling methods use parametric models to approximate physical dynamics that give rise to regional variation. Statistical downscaling methods mine historical weather data to quantify regional variability, and generate projections exhibiting similar statistical properties. Dynamic downscaling is generally considered to be more accurate and better-suited to characterizing extremes, but it is very computationally intensive and may be biased by boundary conditions or imperfect understanding of physical dynamics. Statistical downscaling methods require less computational power, but assume that statistical properties of local weather phenomena will remain constant (or stationary) in spite of climate trends. This assumption is known to be false [3]. These differences and practical considerations for choosing a particular downscaling approach are discussed broadly in [2], and in the context of water resource planning in [28]. The CEC commissioned research to develop state-of-the-art statistical downscaling methods for California, known as Localized Constructed Analogs (LOCA) [34, 35]. LOCA downscaled versions of 10 climate models are available through CalAdapt.
4 Climate-relevant input variables for electricity systems
A number of climate trends will impact grid infrastructure. Chronic impacts, like sea level rise, more rapid equipment aging, and increasing electricity demand, will stress existing infrastructure over time. Acute impacts, like wildfires and severe weather, will lead to much more sudden consequences. Anticipating these effects can improve strategies for mitigating risks and responding to emergencies.
Using climate projections as inputs to infrastructure planning models (Section 5) can ensure that planning decisions are robust to the chronic and acute vulnerabilities. Here, we summarize relevant climate trends. We consider three types of inputs (referring to stages 2a, 2b, and 2c, respectively, in Figure 1): climate variables, which are direct outputs from climate models, environmental trends, which are derived from climate variables, and energy demand, which is heavily influenced by weather and climate. Table 1 summarizes data available through CalAdapt about climate variables and trends.
4.1 Climate variables
These variables can be obtained directly as outputs from climate models or at higher resolution from downscaled LOCA models. The following paragraphs describe electric power system impacts.
Temperature
Climate models largely agree that temperatures will rise and heat waves will become more frequent and more intense [36]. Rising temperatures will impact load growth, generator efficiency, equipment ratings, and degradation rates (among other factors) [37, 38]. Extreme heat events may have cascading effects [39].
Precipitation
The direction and magnitude of projected trends in precipitation vary across climate models. Models agree, however, that seasonal and spatial variability will increase, affecting power generation, heat dissipation, and maintenance needs. Greater variability makes characterizing extreme events critically important, as operational and planning decisions are often informed by extreme precipitation events [40].
Wind speed
Expected temperature increases and pressure changes in atmospheric currents as a result of climate change will have a direct impact on wind patterns. However, research is needed to determine how these changes will impact regional wind patterns relevant to grid planning decisions [5]. Climate change is expected to affect “the intensity and duration of sustained winds” [37] and to increase peak wind intensity [36]. These trends will impact the operation and performance of both wind turbines and the infrastructure that must withstand winds (i.e., power lines). Wind speeds are also a crucial input for calculating the potential heat impacts on equipment, as wind can provide cooling to offset high temperatures [6].
4.2 Environmental trends
These trends cannot be obtained directly from climate models, but instead follow from changes in the intensity, geography, and seasonality of climate variables discussed above. Projections are generated by analyzing climate model outputs.
Drought
Increasing temperatures and changing precipitation patterns may lead to more frequent and severe droughts. Drought will increase electricity demand associated with water pumping for drinking, irrigation, and other uses [37], and could introduce additional loads for desalination. Severe drought events may carry additional ramifications for power sector operations in California [41].
Solar irradiance
Changes in temperature and precipitation will impact atmospheric conditions that drive variables like humidity and cloud cover (occurrence, type, timing, and optical thickness) [5]. Changes in these conditions will impact surface solar radiation, thereby affecting solar generation, net load from rooftop solar PV, and the apparent temperature on the ground.
Snowpack
Warmer winters at high altitudes will lead to more precipitation falling as rain rather than snow and an earlier melting time for snowpack. These factors may lead to reduced water availability during the summer months due to the changing timing of runoff. Many reservoirs in California are dual-purpose: they were built to accommodate water from slow-melting snow into the summer months, and include extra storage capacity for flood control. Increased precipitation will lead to earlier snowmelt, which will increasingly coincide with the flood season. An increase in water released to protect against floods in the spring will reduce water availability through the summer [42]. Hydro resources will be further impacted as snowpack disappears from lower elevations [37]. Models predict that the Sierra snowpack may decrease by 48-65 percent by 2100 from its 1961-1990 average [42, 43].
Fire risk
Increasingly warm, dry, and windy conditions may exacerbate existing wildfire risks [44]. Reduced snowpack and earlier snowmelt may also lengthen the wildfire season. The impact of these climate variables on fire risk may be further exacerbated by modern fire suppression practices [45]. Wildfire risks include damage to grid infrastructure, and the need to pre-emptively de-energize lines to prevent ignition [37, 46].
Sea level rise
Sea level rise impacts on infrastructure can include coastal flooding, coastal erosion, exacerbated land subsidence, saltwater intrusion, and pipeline corrosion [47]. In the context of electricity infrastructure, sea level rise will predominantly impact siting decisions and expected damages to coastal infrastructure and facilities, including generating plants and substations [37, 48]. Sea level rise impacts may also extend beyond coastal areas as rivers swell and low-lying areas resist drainage after high tides.
| CalAdapt Data Stream | Description | Planning Relevance |
|---|---|---|
| Raw LOCA Downscaled Climate Data | Daily projections of relative humidity, surface solar radiation, and wind speed available through the CalAdapt data server; data are more challenging to interface with than the data streams listed below | Solar capacity; Grid hardening; Planning for Extremes |
| Annual Averages11footnotemark: 1 | Annual minimum and maximum temperatures; Total annual precipitation | Peak capacity; Derating; Planning for extremes |
| Cooling and Heating Degree Days11footnotemark: 1 | Degree-day estimates derived from difference between daily minimum and maximum temperature and user-defined heating/cooling setpoint temperatures | Load forecasting; Capacity expansion |
| Extended Drought22footnotemark: 2 [35] | Weather/hydrologic projections for two extreme drought scenarios (early & late century) | Hydro capacity; Water availability for power plant cooling; Planning for extremes |
| Extreme Heat Days and Warm Nights11footnotemark: 1,33footnotemark: 3 | Frequency and intensity of hot days/nights for various “extreme” event thresholds | Peak capacity; Derating; Reliability; Planning for Exremes; Load forecasting; Siting |
| Extreme Precipitation11footnotemark: 1,33footnotemark: 3 | Frequency and intensity of precipitation events for various “extreme” event thresholds | Hydro capacity; Distribution reliability; Storm hardening |
| Hourly Projections of Sea Level22footnotemark: 2 [49, 50] | Projects sea levels associated with diurnal/seasonal tidal patterns and arctic ice melt | Siting |
| Sea Level Rise (CalFloD-3D)22footnotemark: 2 [51] | Projects sea level inundation during 100-year storm events at high spatial resolution for the Bay Area, San Joaquin River Delta, and California Coast | Grid hardening; Siting; Planning for extremes |
| Snowpack22footnotemark: 2 [52] | Monthly snow water equivalent | Hydro capacity |
| Streamflow22footnotemark: 2 [53] | Monthly and annual streamflow projections for 11 streamflow gauging stations throughout the state of California | Hydro; Siting |
| Variable Infiltration Capacity (VIC) Variables11footnotemark: 1 | Provides a wide range of hydrologic variables with daily resolution | Hydro capacity |
| Wildfire22footnotemark: 2,44footnotemark: 4 [54] | Provides 5- and 10-year averages of acres burned under different population growth scenarios | Siting; Grid hardening; Capacity expansion; Planning for Extremes |
| 11footnotemark: 1Data are derived directly from statistical processing of LOCA downscaled climate model outputs. | ||
| 22footnotemark: 2Data are generated from VIC variables and/or other data sources. Relevant documentation are cited where appropriate. | ||
| 33footnotemark: 3Though data are reported for each 6km grid cell, the statistical methods used to estimate extreme events are meant to broadly describe changes across the state. Additional analysis may be needed to provide actionable information to decision-makers on a local scale. | ||
| 44footnotemark: 4Data are available for the subset of 4 climate projections used in the Fourth Climate Change Assessment, not for all 10 climate models. | ||
4.3 Energy demand
Climate will impact energy consumption and the generation, distribution, and transmission resources needed to reliably serve these evolving demands.
More intensive load
Rising temperatures will increase the electricity drawn by existing uses. For example, electricity demand for cooling, refrigeration (particularly in warehouses), and other loads that maintain thermal comfort (e.g., ventilation and fans) will grow. Higher peak temperatures and more frequent extreme heat days will induce higher and more frequent peak load events [55]. These trends will increase overall energy consumption, thereby increasing base load requirements, and may affect seasonal load patterns. The specific regional impacts will depend on the characteristics of local building stock [56]. Extreme heat will also raise the stakes for power outages during peak load events, as space conditioning becomes a necessity for vulnerable populations [57].
More extensive load
Climate change will also increase electricity demand from new uses and in new locations. For example, warming will lead to more extensive cooling demand in historically moderate climate zones (e.g., San Francisco). More extensive space conditioning will increase system peaks and could stimulate more consistent demand for cooling throughout the year. This trend could impact decisions related to generator siting and capacity expansion in transmission and distribution networks. The IEPR forecast currently relies on appliance saturation data last collected in 2009 [58], and methodological revisions to the forecast may be warranted to ensure that changes in appliance saturation and trends in ownership are included.
Electrification of new end uses
Achieving California’s aggressive emissions targets will require electrifying end uses—such as manufacturing, heating, and transportation—that are currently served by fossil fuels. This will increase base load and alter diurnal and seasonal load shapes. For example, electrification of heating loads could prompt wintertime peak load events. Heightened reliance on electricity for heating and transportation could make the implications of wintertime power outages increasingly severe. Meanwhile, extreme weather events that threaten grid reliability may become more common.
Population displacement
The above trends in load are expected given current population trends, but climate change may induce additional shifts in population and therefore electricity demand. A recent report estimates that sea level rise alone will displace over 250 thousand people nationally and 30 thousand in California by 2100 [59]. Displacement due to drought, natural hazards, and conflict will add to these numbers, and could occur on much shorter timescales. Migration to urban areas could increase electricity demand in existing load pockets. Migration to less-populated regions may warrant expansion of transmission and distribution infrastructure, and may also increase the wildland-urban interface, thereby putting more people at risk of power shutoffs and further displacement due to wildfires [60]. Population growth due to economic factors unrelated to climate change may also exacerbate these trends.
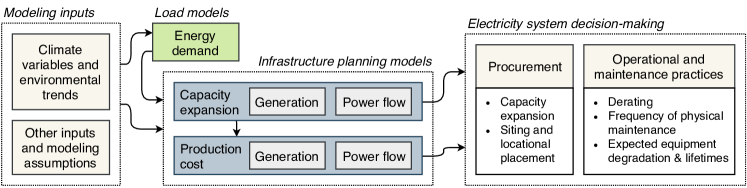
5 Electricity infrastructure planning models and impacts from a changing climate
Five primary types of models inform electricity system planning decisions. These include:
-
1.
Generation models simulate the physical operation of specific power generation technologies.
-
2.
Power flow models describe how electricity moves through wires between generators and consumers.
-
3.
Load models project how trends in population, energy use intensity, and other factors will impact the magnitude, shape, and geographic distribution of energy use.
-
4.
Capacity expansion models optimize generation and transmission procurement decisions based on load forecasts, capital costs, and operating assumptions.
-
5.
Production cost models simulate how grid assets can meet demand, reliability, and emissions requirements at least cost given operating constraints.
These models use different assumptions and inputs. Figure 2 outlines the flow of information between them.
Climate trends introduced in Section 4 will affect grid infrastructure performance. To anticipate climate vulnerabilities, infrastructure planning models will need to account for these trends.
Here, we synthesize what is known about how climate trends will alter grid infrastructure performance. We focus on component- and system-level impacts on operational power systems; for a discussion of resilience and recovery from outages, we refer readers to [61, 62]. Where possible, we reference previous work to provide a sense of the magnitudes of the impacts described. We focus on climate impacts most relevant to grid infrastructure in California, and refer readers to [5, 18] for a more comprehensive review. Table 2 summarizes key takeaways from our assessment of the potential impacts.
5.1 Electricity generation
These considerations apply to both centralized and distributed energy resources (DERs). While statewide resource planning currently focuses on transmission-level bulk generation, increasing DER deployment in California is prompting conversations about how smaller-scale resources could meet localized generation needs and relieve pressure on existing infrastructure [63, 64].
5.1.1 System-wide impacts
Climate trends will impact the design and operational performance of generation in regional power systems. We comment on changes in grid modeling capabilities needed to characterize these trends.
Capacity expansion
Decisions to add generation are informed by capacity expansion models that issue recommendations about the mix of generation resources appropriate to supply load. Climate impacts on load shapes (Section 4.3), and generator performance (Section 5.1.2) could alter planning recommendations.
Existing models for evaluating resource adequacy in local generation fleets rely on IEPR load forecasts modified to a wider range of weather scenarios [65] (A.1). Scenarios are currently based on historical weather data, though similar adjustments could informed by climate forecasts [66, 67]. Climate trends may lead us to revisit planning reserve margins. A recent study indicated that existing reserve margins may become inadequate by the end of the century due to temperature rise [15].
Siting
Sea level rise may require that we retrofit or relocate low-elevation facilities, and make it harder to build new generation in coastal areas. Water scarcity may also influence design decisions for water-cooled generation facilities.
Siting decisions may also improve resilience to contingencies caused by more frequent severe weather events (e.g., wildfires, storms, heat waves). For example, local generation resources may enable grid operators to de-energize power lines to mitigate fire risk without interrupting critical loads and services. Planning models traditionally have not examined interactions between ambient conditions and generator siting decisions.
Generator derating
Derating refers to the practice of operating equipment below its maximum rated capability to avoid internal damage to equipment or external damage to the environment. Derating may be necessary to prevent material degradation of power generators (and grid components) as ambient temperatures become more extreme. These changes may warrant new operating and maintenance practices, additional generation capacity, or energy efficiency and load management programs.
Compounding impacts
Changes in equipment performance warrant new grid modeling capabilities to capture system impacts that may be greater than indicated by component-level analyses. For example, derating—which impacts generation, distribution (Section 5.2.1), and transmission (Section 5.3) equipment—is necessary during extreme heat waves, when the system is also more likely to be under operational stress (due to peak load events). Under the same conditions, power outages pose a public health risk (due to extreme outdoor air temperatures), and the generation capacity of solar and thermal generators decreases (Section 5.1.2). Current planning models do not fully consider the temperature-dependence of operating constraints. This assumption should be revisited to ensure that operating limits are not inadvertently exceeded to reduce the risk of correlated failures during extreme heat events.
5.1.2 Implications for generation technologies
Specific technologies will bear climate impacts due to their physical characteristics.
Solar photovoltaics
Solar generation improves with increasing irradiance but declines with temperature (see B.1) [68]. To evaluate generation capacity in a warming climate, system models will need to account for PV derating. A recent study estimated that PV capacity in the Western U.S. could decrease by approximately 0.7-1.7 percent by mid-century due to higher temperatures [38].
Less precipitation may also compel more frequent manual cleaning of PV panels to preserve operational efficiency.
Wind
Wind speed patterns influence decisions related to siting, design, and operations of wind farms. Changes in average and extreme wind speeds will alter the performance of existing wind farms (see B.2), and may alter optimal siting for new installations [5]. Researchers have identified a need to improve wind speed projections [5]. Studies to date suggest that wind generation potential in California could decrease [69].
Thermal power generation
Power production from thermal generators relies on a temperature differential between high-pressure steam (heated by combustion) and ambient water (or air) (B.3) [70]. These generators—which include natural gas, concentrating solar, and some biomass plants—are more efficient when this temperature differential is high. Rising ambient temperatures will reduce plant efficiency and generating capacity [38, 71, 72]. Plants at risk of violating thermal discharge limits may need to be curtailed [73, 74]. Heat waves will exacerbate these issues at times when generation resources are needed to meet increased cooling demand [75].
Other factors may also impact performance. Drought will limit water availability, potentially causing water-cooled plants to become inoperable for part (or all) of the year [73]. Changes in load may increase peak load relative to total demand, reducing the capacity factor of thermal generators (which typically serve peak load). Operating at less than full capacity will reduce the efficiency of thermal plants [5].
The capacity of thermoelectric plants in the Western Interconnection is estimated to decrease 1.6-3.0 percent on average by mid-century, not including losses attributable to drought [38].
Hydropower
Changes in snowpack, as well as the seasonality and amount of precipitation will impact reservoir levels and water availability [55] (Section 4.2). Drought will reduce hydropower generation [71]. Intense precipitation may lead reservoir operators to prioritize flood control, making hydro resources less readily available to support grid needs [37, 76, 77]. Thus although its fast-ramping capabilities make hydro well-suited to provide frequency response, other generation technologies (e.g., DERs, thermal generators) may need to provide these services in the future. Less snow and earlier melting times may reduce annual hydropower generation in California up to approximately 3 percent [76].
Energy storage
Energy storage—including electrochemical storage, pumped hydropower, and other emerging technologies—can balance intermittencies in renewables generation. Local storage resources may also provide islanding capabilities should transmission or distribution equipment become inoperable, for example due to physical damage or high wildfire risk. Ambient temperature may alter battery degradation and performance; grid impacts, however, have not yet been studied.
5.2 Distribution infrastructure
The distribution system carries electric power from substations to end-use customers through a diverse array of equipment and lines. Transformers convert electricity from high- to low-voltage, and feed it to customers through overhead lines (often held up by wooden poles) or underground cables. Along the way, voltage regulators, capacitor banks, circuit breakers, and other equipment enhance power quality, resilience and safety. Here, we discuss climate impacts on distribution systems planning and operations.
5.2.1 Derating of distribution grid components
Distribution grid components are designed to operate under a specific range of loading conditions, determined by properties of the constituent materials. These limits involve heat dissipation, and relate to internal cooling mechanisms and ambient temperatures. Different ratings may apply at different operational timescales (e.g., continuous operation versus temporary load spikes or instability).
Components are sized to meet peak loading conditions (with some safety margin). Optimal design may involve operating components at or near their rated limits during peak load, as excessive safety margins may lead to undue costs [78]. Historic data and load forecasts inform design decisions. Warming trends will increase peak loads and decrease heat dissipation—thus restricting safe loading limits, particularly for transformers and overhead lines [36, 79, 80]. Failure to derate components (and operate the system in adherence with those ratings) as ambient temperatures increase could lead to more rapid degradation, increasing failure rates, and general reductions in equipment lifetimes [55]. A recent study estimated that distribution components in Los Angeles could experience a 2-20% loss of rated capacity by 2060 due to heat waves, increasing the risk of overloading components in congested areas [80].
Climate variables besides temperature can also impact power ratings. For example, long periods of dry weather can reduce the thermal conductivity of the ground, requiring further derating of underground cables [36]. Changes in moisture may also reduce the efficiency of earthing at substations, requiring additional safety precautions [79].
5.2.2 Siting
Derating needs will depend on localized temperature conditions. Population growth in hot areas of the state means that derating could become a concern for a larger share of grid components.
Distribution equipment may also be impacted by flooding and sea level rise. Flooding during extreme precipitation events, for example, will impact equipment in low-lying areas—in particular, switchgear, control cubicles, and transformers at ground level in substations [36, 79]. Similarly, sea level rise will impact coastal substations and other equipment. A recent study found potential impacts to four substations in San Diego Gas & Electric’s service territory, as well as “thousands of electric substations, transformers, power lines, and other equipment [that] are potentially exposed to damage under scenarios of sea level rise” [48].
5.2.3 System design and connectivity
System upgrades expanding the capacity of distribution systems may be warranted to accommodate new load and compensate for equipment derating. Changes in the connectivity of distribution systems (e.g., islanding, load shedding, and enhanced sectionalization) may also support grid operations during capacity shortfalls or when wildfire risk is high [81]. Islanding capabilities and local generation resources can ensure that critical loads maintain service continuity during outages [63]. In regions of the state where climate risks make it cost-prohibitive to build safe, robust and reliable grid infrastructure, the obligation to serve may be better met by permanently islanded microgrids [82, 83].
5.2.4 Operations & maintenance
Climate variables and trends pose various challenges for distribution system maintenance practices and reliability. Specific examples highlight the need for more frequent inspections and careful maintenance to support system performance:
-
1.
Rising temperatures directly contribute to equipment aging. For example, faster chemical degradation of insulating materials directly increases the failure rates of conductors and transformers [84].
- 2.
-
3.
Heavy rain can damage overhead lines, and soak equipment such as insulators and switchgear increasing the risk of short-circuit and arcing faults. These issues can be mitigated by newer equipment designs and careful maintenance [36].
-
4.
Precipitation poses longer-term risks to distribution systems. For example, moisture leads to internal decay of wood poles, reducing structural integrity [85]. This in turn puts conductors at greater risk.
-
5.
Changing wind patterns and extreme wind gusts could threaten overhead lines, network towers, and other overhead structures. High winds impose shear force on poles and towers, and increase the likelihood that vegetation or other debris will cause damage [36], or lead to faults [55, 79]. Frequent inspections and hardening tower and pole designs to withstand stronger winds could mitigate these impacts [36].
-
6.
Wildfires (as well as the intense winds that often accompany them) can cause physical damage to distribution infrastructure and increase maintenance needs [46]. Smoke is also a concern, as a high concentration of ions makes smoke more conductive than air, increasing the risk of arcing on overhead lines [36].
5.2.5 Vegetation management
A safe distance must be maintained between grid infrastructure and vegetation. Contact is a common cause of power outages and can also cause infrastructure damage, arcing, or tree ignition that—when ambient conditions are appropriate—can spark wildfires [86]. High temperatures coupled with heavy loading during heat waves can cause overhead lines to sag. Clearance can be maintained by modifying vegetation management practices, or in some cases by derating lines. Extreme wind speed events increase the risk of contact from falling and swaying tree limbs.
Climate-aware vegetation management policies will need to consider temperature, wind speed, seasonal patterns that influence tree growth (e.g., length of growing season and ecosystem health), and eventually also changes in tree and shrub species that surround grid infrastructure. Longer growing seasons may warrant more frequent tree trimming [36], while ecosystem damage due to aridification or invasive species (such as bark beetles) may warrant the removal of trees that are in poor health [86, 44].
| Climate Impacts | Generation | Distribution | Transmission |
|---|---|---|---|
| Temperature | Solar and natural gas: rising temperatures reduce efficiency of power production | Derating and increased line losses, more rapid equipment aging | Derating and increased losses, increased congestion |
| Precipitation | Hydro: reduced energy generation capacity, less flexible dispatch | Water inundation risks for equipment, faster aging for wooden poles, changes to vegetation management | Changes to vegetation management |
| Wind patterns | Wind: reduced power production from existing farms, possible creation of new sites | Equipment damage, changes to vegetation management, fire ignition and spread | Equipment damage, changes to vegetation management |
| Drought | Natural gas: less water for cooling; Hydro: less water for power production | Reduced soil thermal conductivity requiring derating of underground cables | |
| Solar irradiance | Solar: stronger irradiance increases power production | ||
| Snowpack | Hydro: reduced energy generation capacity, less flexible dispatch | ||
| Fire risks | Energy storage: supports “non-wires alternatives” for mitigating fire risk | Equipment damage and increased risk for arcing faults, changes to vegetation management | Equipment damage and resiliency impacts due to line outages |
| Sea level rise | Siting: relocation of existing assets, design challenges for new generation, corrosion | Water inundation and corrosion risks for equipment | Water inundation and corrosion risks for equipment |
| Load | Possible need for capacity expansion to serve additional peak and base load | System stress and increased maintenance requirements; Possible need for capacity expansion | Possible increased congestion |
5.3 Transmission infrastructure
The transmission system carries power from large generators over long distances to regional load centers. In California, CAISO conducts an annual planning process to address evolving system needs (A.3). Many of the inputs rely on historical weather data. While California’s transmission system is operated by CAISO, it is regulated by the Federal Energy Regulatory Commission (FERC). Though federal regulation is beyond the scope of this paper, we briefly comment on climate interactions with the transmission system.
Similar to the distribution system, transmission lines are assigned a power rating for maximum electricity transfer. Transmission lines that approach this maximum power rating are said to be ‘congested’ and act as bottlenecks in moving electric power from one area to another. Higher ambient temperatures reduce heat dissipation from transmission lines, thus increasing energy losses and reducing line transfer limits [6, 79]. Heat-related capacity reductions will likely coincide with peak loading, further stressing the system and prompting concerns about supply adequacy [6]. As in distribution systems, failure to account for temperature-dependence of operating constraints could lead to correlated component failures. In transmission systems, such correlated failures may have cascading effects that result in widespread blackouts [87].
A recent study estimated that projected temperature increases during the month of August could reduce transmission line transfer limits in California by 7-8 percent by 2100 [88]. Technological solutions exist: for example, heat-resistant cables provide new options for preserving and improving line capacity, but it remains to be seen whether re-conductoring lines is best solution [6]. Challenges associated with transmission system expansion may eventually lead to greater reliance on local generation.
Increasing fire risk in California also threatens transmission facilities [79]. A recent study found that distribution infrastructure incurred more damage than transmission infrastructure from 2000-2016 wildfires in California [46]. However, damage to transmission facilities and/or preventative de-energization due to nearby wildfires or risky fire-prone weather [46] may impact a large number of customers. Moreover, changing climate conditions may make transmission (and distribution) equipment more likely to trigger fires. One option for mitigating risk is to invest in infrastructure upgrades that reduce the probability of component failures. Another alternative is to modify the topology of the network to remove transmission lines from regions of the state where wildfire risk is excessively high.
6 Recommendations
Effective climate adaptation measures will require decisions that are informed by known interactions between climate science and power systems. Both are highly technical areas, and many of the interactions between them are not yet well-understood. Moreover, climate risks are not necessarily represented in historic data. Projections of variables characterizing these risks are uncertain at best, and, for certain variables, do not yet exist in a form that decision-makers can readily use. Here, we describe opportunities for progress, in light of these existing challenges.
We share nine recommendations for applying best-practices in climate adaptation to grid infrastructure planning processes in California. By following these recommendations, decision-makers may begin to account for grid-climate interactions in a comprehensive manner. By comprehensive, we mean that planning decisions consider grid-climate interactions, compounding effects, and associated impacts on diverse stakeholder groups–including utilities, ratepayers, and disaster relief agencies. We build on best-practices in adaptive planning, including: defining well-documented risk tolerances [20], accommodating advancements in climate science [24], and revisiting adaptation strategies as new information comes to light [89].
Together, our recommendations provide a roadmap for decision-makers to better understand and act upon climate risks, as illustrated in Figure 3. Each recommendation offers near-term actions that can be pursued in parallel today. First, we describe the information needed to support climate-aware decision-making (Recommendations 1, 2, 3, and 4). Then, we describe how these can inform infrastructure planning models and decisions (Recommendations 5, 6, and 7). Finally, we discuss the need for decision-makers to internalize uncertainties inherent to planning for climate change and its consequences (Recommendations 8 and 9).
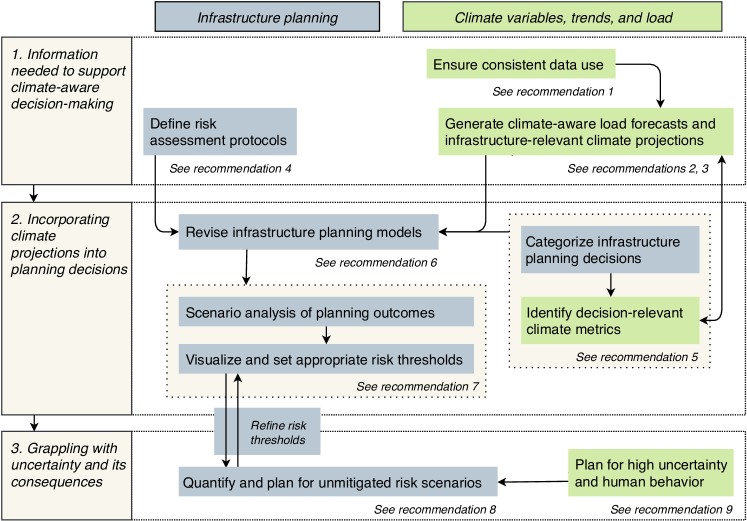
6.1 Information needed to support climate-aware decision-making
To begin, adaptation efforts must be informed by data reflecting the current state of climate science. Where relevant, climate data may need to be tailored to the specific case of grid infrastructure planning.
Recommendation 1: Regulators should specify which climate data stakeholders are to use to inform specific planning decisions.
Barrier
Stakeholders that use and disseminate climate data must grapple with challenges such as:
-
1.
Climate science is evolving, and user-facing data must be kept up to date.
-
2.
Climate model assumptions may make certain data ill-suited for certain applications; data limitations are far from intuitive and require detailed understanding of both the climate models and the application of interest.
-
3.
Substituting historic data with climate projections as inputs to existing planning models may not be appropriate, and may not account for all of the interactions that are present.
In California, CalAdapt currently provides data that can readily support climate-aware planning (Table 1). However, additional work remains to be done to evaluate whether these data: (1) remain consistent with state-of-the-art climate science, and (2) provide requisite information to inform grid infrastructure planning decisions (data requirements are also discussed in Recommendations 2-4). Moreover, stakeholders will require clear direction on how to apply this data to inform their decisions (discussed in Recommendations 5-7).
Solution
In California, CPUC should specify which climate data will inform planning decisions to ensure that different stakeholders use consistent information, and that these information remain up-to-date. CPUC should form a technical advisory group to determine how relevant data will inform specific decisions. In the near-term, the CPUC should instruct stakeholders to start with data that currently exists via CalAdapt. Ultimately, CEC should work with stakeholders to assess whether CalAdapt should offer additional data streams to support grid planning needs. For example, filters for selecting relevant GCMs (discussed in [28]) and downscaling methods (discussed in [2]) may need revisiting to provide requisite information for grid planning applications. CEC should ensure that the data to support these applications is readily available (see Recommendations 2 and 3), and release updates as new data become available due to advancements in climate science.
Recommendation 2: Model climate impacts on load, and generate a library of load forecasts that span all relevant climate scenarios.
Barrier
Solution
Since electricity infrastructure planning relies heavily on IEPR forecasts, revisiting these forecasts will have impacts that propagate through the planning process. In the near term, CEC can support other grid planning entities by providing load forecasts for all climate projections available in CalAdapt. Methods and assumptions for generating end-use forecasts should be clearly documented to ensure that merits and limitations of the forecasts are transparent, and to help downstream analysts determine if or where post-processing is warranted. Ultimately, the CEC will need to revise load forecasting methods and assumptions to more thoroughly account for nuanced interactions between energy use and weather (beyond temperature), and to account for mitigation and adaptation measures taken by both policy-makers and end-users (e.g., electrification of new end uses and higher saturation of air conditioners). Engaging with stakeholders who rely on IEPR forecasts to inform their work may reduce the need for ad-hoc post-processing by grid planning entities.
Recommendation 3: Identify climate data relevant to grid infrastructure planning, and conduct research necessary to generate data that do not already exist.
Barrier
Though data exist to support certain types of planning decisions (e.g., water resource use [28] and natural gas pipeline siting [51]), additional data may be needed to support new applications like grid infrastructure planning. Data reporting temperature, precipitation, sea level rise are relevant to multiple applications, but other vital datasets are lacking. For example, information about the frequency, severity, and seasonality of high-wind speed events are critical to understanding wind power production and to informing grid hardening measures.
Solution
Imperfect information need not be a barrier to making climate-aware decisions; planning efforts can begin to move forward with the data currently offered in CalAdapt. In the near term: Where possible, infrastructure planners should use climate projections. CEC should engage with stakeholders to understand the limitations of existing data, and to identify additional data requirements (see Recommendation 5). Ultimately: Research is needed to generate a comprehensive library of data streams for grid infrastructure planning. Research needs include determining whether statistical or numerical downscaling methods are more appropriate, and to project regional changes in frequency and severity of high-wind speed events. CEC should support these efforts, while working with CPUC and other stakeholders familiar with data requirements unique to supporting grid planning applications.
Recommendation 4: Develop quantitative methods to project risk exposure of infrastructure assets and assess mitigation options.
Barrier
Robust risk assessment protocols must evaluate the probability and implications of scenarios that may never have occurred previously. Risk reduction measures must balance diverse trade-offs—such as service reliability, equity, and loss of life. Further study is required to assess the societal implications of different adaptation strategies. In California, utilities already use probabilistic methods to assess risks and inform upgrade decisions [90, 91]. However, incorporating climate projections to forecast climate-related risks to grid assets has not yet been discussed [90].
Solution
CPUC must ensure that utilities use models that can examine evolving risks due to climate change. Methods for evaluating these risks must be transparent and subject to public scrutiny. Existing regulatory proceedings in California (including S-MAP and RAMP, see A.4) provide an avenue for assessing risks, but currently consider only certain types of risks. In the near term, CPUC should engage with stakeholders to identify metrics appropriate for characterizing climate risks. Safety-focused risks covered in existing regulatory proceedings (e.g., wires down, fire ignitions), should be considered alongside broader risks (e.g., reliability and equity). New metrics for characterizing climate risks should also be included (e.g., inundation of grid assets due to sea level rise). CPUC should oversee the process of developing quantitative methods for anticipating new and evolving risks, for example by mining historic data to quantify climate-sensitivities of risk metrics. Ultimately, risk assessment models should quantify how proposed investments will impact risk and performance over the lifetime of new and existing assets. These models should be used to optimize candidate investments, and identify strategies that minimize overall risk exposure (where possible) or meet specified risk thresholds (see Recommendation 7). The magnitude and severity of damages due to possible risk scenarios (e.g., wildfires) should also be explicitly reported. Transparent reporting will allow utilities, regulators, and communities to weigh the implications of mitigating certain risks and not others, and can ensure that stakeholders understand and agree to shoulder the implications of unmitigated risks (see Recommendation 8).
6.2 Incorporating climate projections into planning decisions
With a quantitative basis for examining climate trends and evolving risks, we can begin to develop infrastructure planning processes that internalize complex interactions between climate and infrastructure to inform planning decisions. Here, we propose a potential approach. Recommendations 5 and 6 focus on scoping and implementation, respectively, while Recommendation 7 synthesizes results into action.
Recommendation 5: Perform a comprehensive assessment of potential grid-climate interactions.
Barrier
Electricity infrastructure planning decisions are informed by many different physical, operational, and societal considerations. The decisions are complex, and no individual stakeholder group will be familiar with all possible implications of different adaptation strategies.
Solution
A comprehensive mapping of how climate variables, trends, and load may affect specific infrastructure decisions is a necessary prerequisite to incorporating these factors into infrastructure planning models. CPUC should engage a wide variety of subject-matter experts in this effort—for example in climate science, hydrology, power generation and distribution equipment, grid design, operations and repairs, energy use consumption, and power systems modeling—through a technical advisory or working group. Here, we propose an approach for mapping out these interactions:
-
1.
List specific infrastructure planning decisions that must be made.
-
2.
List climate impacts that could influence each decision. Table 2 provides a starting point based on the interactions discussed in this paper; engaging with a broader audience of stakeholders and experts could shed light on additional interactions.
-
3.
Define how the magnitude of each climate-grid interaction will be quantified (e.g., instantaneous impacts, cumulative exposure, etc.).
-
4.
Define metrics for decision-making specifying: (1) relevant climate variable(s), (2) appropriate statistics (e.g., low, extreme, average, etc.) and duration, (3) geography, and (4) decision timescale [92]. Examples could include water inundation (to inform decisions to relocate certain assets) or extreme wind speed projections (to inform pole reinforcement).
In the near term, the CPUC should form a technical advisory group to enumerate climate impacts on planning decisions (as detailed above). Results should be circulated for public comment, and revised as appropriate. Ultimately, this document should be refined to comprehensively map out climate impacts on specific planning decisions. Mitigation options should be weighed based on input from stakeholders ranging from ratepayers to repair personnel.
Recommendation 6: Refine infrastructure planning models to incorporate climate impacts.
Barrier
The models we currently use to inform infrastructure planning decisions do not comprehensively account for grid-climate interactions. Existing models contain baked-in assumptions about operations, maintenance, and performance that may not hold as climate and loading conditions change. Planning models must be revised to account for new climate realities.
Solution
Well-informed and climate-aware recommendations will require infrastructure planning models to thoroughly incorporate sensitivities between infrastructure performance and climate trends, such as those listed in Table 2. In the near term, CPUC should lead efforts to ensure that planning models can run multiple climate scenarios to examine how different futures could influence today’s planning decisions. Modeling infrastructure may need to be adapted to ingest new input data as CMIP releases updated climate projections to reflect scientific advances. Ultimately, planning models should be revised such that embedded assumptions are dynamic and account for changes in performance due to emerging climate trends. New models that account for compounding interactions may need to be developed. Risk calculations (see Recommendation 4) should be embedded in infrastructure planning models to ensure that decisions focus not only on maintaining grid operations, but also on mitigating risks.
Recommendation 7: Determine the range of planning outcomes across different climate projections. Set appropriate risk thresholds.
Barrier
Infrastructure planning models must be adapted to examine numerous climate scenarios, climate impacts of varying magnitudes, and uncertainty inherent in making decisions informed by climate projections. Furthermore, climate impacts may compound; for example, capacity expansion models must examine temperature-sensitivities of both load growth and equipment ratings.
Solution
Decision-makers must consider the range of planning options given different climate outcomes. Examining the differences (or lack thereof) will provide insight into the implications of planning to different risk thresholds. Based on the results, CPUC should engage with stakeholders to define appropriate risk tolerances for specific planning decisions. Explicitly setting a risk tolerance will ensure that planning decisions are robust to uncertainty in climate projections, and can provide transparency needed to balance reduced costs against the possibility of incurring additional risks (see Recommendation 8). One way to approach this challenge is as follows:
-
1.
Run infrastructure planning models for each climate scenario specified in Recommendation 1; identify recommended investments for each scenario. (A sensitivity analysis is advisable, as sensitivities to individual climate variables may vary.)
-
2.
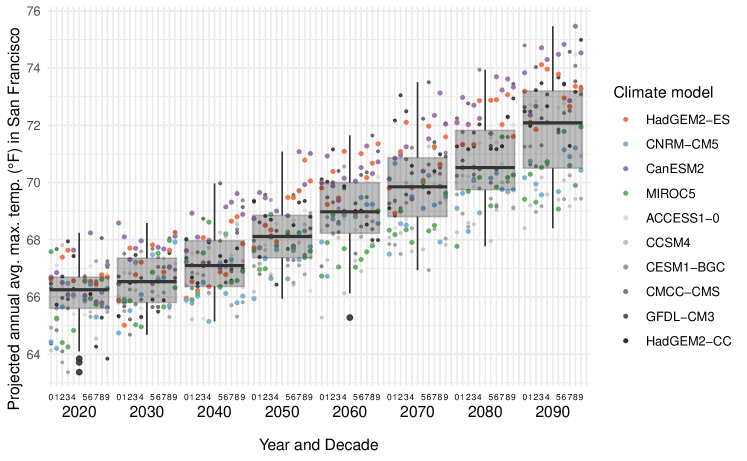
Visualize the range of possible planning outcomes via a box-and-whisker plot333A box-and-whisker plot is a statistical representation commonly used to depict the range of observations present in a data set. The line inside the box indicates the median of the data, while the ends of the box indicate the upper (75%) and lower (25%) quartiles. The whiskers may extend to the highest and lowest observations, though statistical outliers are often depicted as individual points beyond the whiskers. Notably, a box-and-whisker plot visually shows the full range of observations without averaging and without presuming that observations follow any kind of parametric distribution.. An example is shown in Figure 4 for projected temperatures by decade in San Francisco (we note that this example is a climate variable, not a planning outcome). The strength of this visual depiction lies in its intuitive representation of the range and distribution of projected outcomes. Once this range is presented, recommendations from different planning models can be synthesized to make decisions based on the severity of outcomes that could occur if planning decisions are made in accord with a climate projection that proves to be wrong.
-
3.
Review every category of planning decisions and determine the appropriate risk threshold. For example, planning to the median may be appropriate in cases where the risks are not severe (e.g., projected PV panel output). In other cases, planning to extremes will be more appropriate (e.g., water availability for cooling power plants). Decision-makers may opt to set different thresholds (e.g., 50th, 75th, or 95th percentile) for different types of planning decisions, depending on risk tolerance.
-
4.
In cases where the implications of unmitigated risks are extreme, more thorough analysis will be necessary to ensure that investments are commensurate with the magnitude of the risks, and that society is prepared to shoulder the implications of whatever trade-offs are ultimately made (see Recommendation 8).
This exercise will produce planning recommendations for each climate scenario, while assessing the potential risks (see Recommendation 4) associated with planning to one risk threshold versus another.
In the near term, infrastructure planning models should be run with the full range of climate projections specified in Recommendation 1. Box-and-whisker plots of planning outcomes should be generated and a sensitivity analysis of different climate impacts on infrastructure planning model assumptions should be performed. Ultimately, the range of planning outcomes should be obtained via updated infrastructure planning models (see Recommendation 6). The risk analysis and appropriate risk tolerances should be revisited and applied to future decisions.
6.3 Grappling with uncertainty and its consequences
The complex interactions between climate and electricity infrastructure leave room for significant uncertainty. Modelers will likely make mistakes and overlook some climate interactions. Should this be the case, processes must be in place that facilitate iteration and allow us to refine grid planning models as new information comes to light.
Recommendation 8: Assess the magnitude and severity of evolving risk scenarios; re-evaluate risk tolerances in light of evolving risks and/or allocate resources to respond effectively.
Barrier
Infrastructure planning decisions have always balanced investments in performance against the probability and implications of failure. Today, these decisions are made primarily based on quantitative risk metrics informed by historic data and/or expert judgment [95]. As climate trends change the nature and severity of viable risk scenarios, the current approach makes us vulnerable to systematic errors in our understanding of current and future threats. These errors prevent us from taking effective and targeted actions to mitigate evolving risks; we are shouldering the consequences without fully understanding what they are.
Solution
Recommendation 4 cites the need for climate-aware risk evaluation protocols, while Recommendation 7 proposes that risk tolerances be set. Here, we recommend detailed analysis of unmitigated risk scenarios to ensure that diverse stakeholder groups are prepared for the consequences. It may be necessary to re-evaluate risk thresholds should it be determined that potential consequences are too high. In the near term, risk assessment efforts should focus on ensuring that the likelihood and ramifications of unmitigated risk scenarios are fully understood. CPUC and other decision-makers should engage with local communities, emergency response agencies, and disaster relief funds (among others) to ensure that the diverse groups who will shoulder the burden of real-time response are adequately prepared to do so. Ultimately, efforts to identify and quantify climate-related risks, and decisions about how to allocate limited resources must be coordinated across stakeholder groups who are positioned to mitigate risks, and those who will need to respond. These efforts can aid more efficient and effective responses to risk scenarios that are realized, and provide a basis for reaching consensus about the magnitude of investment appropriate for mitigating risk scenarios that carry societal consequences more severe than those experienced to date.
Recommendation 9: Planning agencies need to think critically about how infrastructure needs could change due to climate impacts on population and behavior.
Barrier
There remains a great deal of uncertainty around how people will respond to climate change. We may anticipate some trends, but high uncertainty around how or if to respond may mean it is too soon for preemptive action. Several examples have emerged. Expansion of the wildland-urban interface has created new load centers and increased the implications of wildfire ignition events [60]. Public safety power shutoffs have been used to mitigate severe wildfire risks, but outages pose safety risks to vulnerable populations during extreme heat waves. Service interruptions during wildfire events may impact the ability of electric vehicle owners to evacuate affected areas.
There are other examples we may anticipate but have not yet confronted. For example, researchers are studying potential population displacement due to climate change [59]. However, little discussion has focused on infrastructure needs to support displaced communities [96]. Without proper planning, temporary or permanent displacement of populations—within, to, and from California—could lead to considerable strain on infrastructure systems.
Solution
The high degree of uncertainty may make it untenable to prioritize these risks over more immediate needs, but we should still prepare to take action. Stakeholder engagement efforts should focus on enumerating the wide range of risk scenarios that could unfold as people respond and adapt to climate change, and evaluate the implications on grid infrastructure and operations. To the extent possible, we should anticipate and plan for these types of risk scenarios and timely, coordinated, and effective responses.
7 Conclusions and Policy Implications
Climate change will fundamentally alter the operating conditions and risk exposure of electric grid infrastructure. An advanced body of research has developed climate data to anticipate these risks and inform long-term planning decisions. Additional research may be needed to characterize certain climate-grid interactions. Where data do exist, substantial research has been done to examine how climate trends will impact grid assets, for example due to warming and sea level rise.
The current work examines the technical details of climate-grid interactions, opportunities and barriers to use climate information to inform long-term investments in grid infrastructure. We detail nine recommendations that provide guidance to coordinating entities (for example regulators or policymakers) positioned to enable and advance climate awareness in grid planning processes in California. These recommendations are grounded in existing grid infrastructure planning processes, and are informed by best-practices established in other sectors.
We find that much of the data necessary to support climate-aware decision-making are readily available, including projections of temperature, precipitation, snowpack, and wildfire risk. However, climate projections characterizing changes in the severity of high wind-speed events—which can both physically damage grid infrastructure and exacerbate wildfire risks—are needed. Grid planning agencies rely heavily on load forecasts which need to be revised to reflect how climate trends and mitigation efforts will alter load.
Regulators and policymakers will play a critical role in disseminating climate data, and in advancing infrastructure planning models to incorporate these data. An important first step is to ensure that decision-makers throughout the state have access to and use climate and load projections as inputs to grid infrastructure planning models. Clear guidance should be issued regarding which data are appropriate to use for different planning decisions. Research funding is needed to generate datasets that are lacking, and to study grid-climate interactions that are not well understood.
Though there is a great deal of uncertainty associated with making long-term decisions in the face of climate change, that need not prevent decision-makers from mitigating recognized risks. Existing regulatory processes are well-suited for regulators to detail prescriptive guidance about how to make infrastructure investment decisions in light of existing uncertainties. Transparent risk thresholds informed by current knowledge will ensure that planning decisions align with evolving societal needs and priorities, and allow greater insight into unmitigated risks. Planning thresholds will need to be revisited as our understanding of evolving risks advances. Developing a more detailed understanding of the risks that climate-grid interactions could pose can support regulatory agencies in determining how resources are allocated, and whether rate increases will be necessary to cover the costs of mitigating untenable risks.
Acknowledgements
Many individuals provided helpful guidance and discussions. From the California Public Utilities Commission, we are grateful to Rachel Peterson, Suzanne Casazza, Reese Rogers, Patrick Young, and Sonya Ziaja for their expert insights and thoughtful input. We also benefited from the wisdom of Guido Franco from the California Energy Commission, Mohit Chhabra from the Natural Resources Defense Council, John Holmes and Ben Wender from the National Academy of Sciences, Evan Mills from Lawrence Berkeley National Laboratory, Jessie Knapstein from Pacific Gas & Electric, Peter Alstone from Humboldt State University, and Kripa Jagannathan, Julia Szinai, Ian Bolliger, and Adam Orford from UC Berkeley. Also at UC Berkeley, our research advisers, Duncan Callaway and Scott Moura, and Steven Weissman from the Goldman School of Public Policy (who provided the impetus for this project) contributed invaluable feedback and insights throughout. Any remaining errors and/or oversights are solely our own.
A.B. was supported by the National Science Foundation Graduate Research Fellowship under Grant No. DGE 1752814. L.D. was supported by a 2019 Seed Fund Award from CITRIS and the Banatao Institute at the University of California.
Acronyms
| AC | Air Conditioning |
|---|---|
| CAISO | California Independent Systems Operator |
| CEC | California Energy Commission |
| CMIP | Coupled Model Intercomparison Project |
| CPUC | California Public Utilities Commission |
| DER | Distributed Energy Resource |
| EV | Electric Vehicle |
| FERC | Federal Energy Regulatory Commission |
| GCM | Global Circulation Model |
| GRC | General Rate Case |
| IEPR | Integrated Energy Policy Report |
| IPCC | Intergovernmental Panel on Climate Change |
| IPR | Integrated Resource Plan[ning] |
| LOCA | Localized Constructed Analogs |
|---|---|
| LSE | Load-Serving Entity |
| O&M | Operations and Maintenance |
| OIR | Order Instituting Rulemaking |
| PV | Photovoltaic |
| RAMP | Risk Assessment Mitigation Phase [proceeding] |
| RCP | Representative Concentration Pathway |
| RESOLVE | Renewable Energy Solutions Model |
| RPS | Renewable Portfolio Standard |
| RSP | Reference System Plan |
| SERVM | Strategic Energy & Risk Valuation Model |
| S-MAP | Safety Model Assessment Proceeding |
| TPP | Transmission Planning Process |
Appendix A Electricity infrastructure planning in California
Building on Section 2, we return here to a more detailed discussion of electricity system planning in California. We focus on selected infrastructure planning activities and current approaches to modeling and data streams at the three state entities that share responsibility for energy- and electricity-related planning and oversight [97].
The California Energy Commission (CEC) conducts a broad suite of activities related to energy policy and planning. CEC’s responsibilities include developing integrated policy strategies for the state, funding research and demonstration projects, approving sites for large thermal power plants, setting efficiency standards for buildings and appliances, and certifying renewable energy resources for compliance with the state’s Renewable Portfolio Standard. The California Public Utilities Commission (CPUC) regulates essential infrastructure and utility services. CPUC has jurisdictional oversight over investor-owned public utilities that provide electricity and natural gas service, and over private telecommunications, water, and transportation companies. Within the electric utility sector, CPUC is responsible for authorizing procurement that is in the public interest, regulating rates, and ensuring safety.444Notably, other entities such as Community Choice Aggregation (CCA) programs and Electric Service Providers (ESPs) also serve customer loads in California but CPUC jurisdiction over them is limited. We exclude them from further consideration here. The California Independent Systems Operator (CAISO) operates electric transmission infrastructure and oversees wholesale electric power markets within its planning region, which covers most of the state of California.
A.1 Load forecasting
The CEC issues official load forecasts in conjunction with its Integrated Energy Policy Report (IEPR), which is released every two years with updates in the intervening years [14, 98]. Forecasts are generated for high, mid, and low energy demand cases which are designed with varying assumptions about economic growth, electricity and gas prices, energy efficiency, PV generation and EV adoption, weather conditions, and climate change impacts.
To date, the underlying weather inputs into CEC’s demand forecasts have been based on a sampling of historical weather data. Hourly temperature data collected over fifteen years from 2000 to 2015 was used to inform the demand forecasts published with the 2017 IEPR. This historical data was subjected to a random sampling process to identify representative distributions of hourly temperatures. These distributions enabled an estimation of hourly peak demand as well as the ratio of demand in other hours to the peak demand hour [99, p.14-28]. Multiple ‘weather years’—full years of hourly temperature data that follow distributions representative of the historical record—were generated for each energy demand case by repeating this process (Figure 5). From these multiple weather years, CEC issued load forecasts for 1-in-2, 1-in-5, and 1-in-10 weather years intended to represent, for example, a high-demand (hot) year encountered on average once every 10 years [100, 65]. These scenarios are meant to account for uncertainty and contingencies related to extreme weather. However, each forecast is still based on the historical record, which limits its applicability for planning to future incidences of extreme values.
Climate change adjustments to historical weather trends are based on temperature scenarios developed by the Scripps Institution of Oceanography [14, p.176]. The low demand case incorporates no additional impacts from climate change, while the mid and high demand cases use adjustments based on ‘low’ and ‘high’ scenarios of temperature increases [14] (Figure 5). Documentation does not specify which specific Scripps temperature scenarios were chosen or which assumptions are contained therein (see [16] for a more thorough discussion). These temperature adjustments are used to estimate the additional energy consumption and peak impacts for residential and commercial customers within specified planning zones. However, the methods currently used to account for climate impacts on projected demand are not comprehensive: only temperature (specifically, cooling and heating degree days and annual maximum) is considered in the climate change adjustments to historical data used in the 2017 IEPR. Further research is needed to comprehensively account for these impacts.
In addition to the forecast scenarios discussed above—the low, mid, and high energy demand cases, each with their own 1-in-2, 1-in-5, and 1-in-10 weather years—the CEC publishes a single forecast set intended for use in statewide planning processes at the CPUC and CAISO. This common forecast uses the mid energy demand case discussed above, with its weather years assigned to specific planning purposes (Figure 5) [14, 98].555The single forecast set also incorporates scenarios for additional energy efficiency savings and PV adoption. We omit further discussion of these here due to our primary focus on weather and climate data used in the demand forecasts.
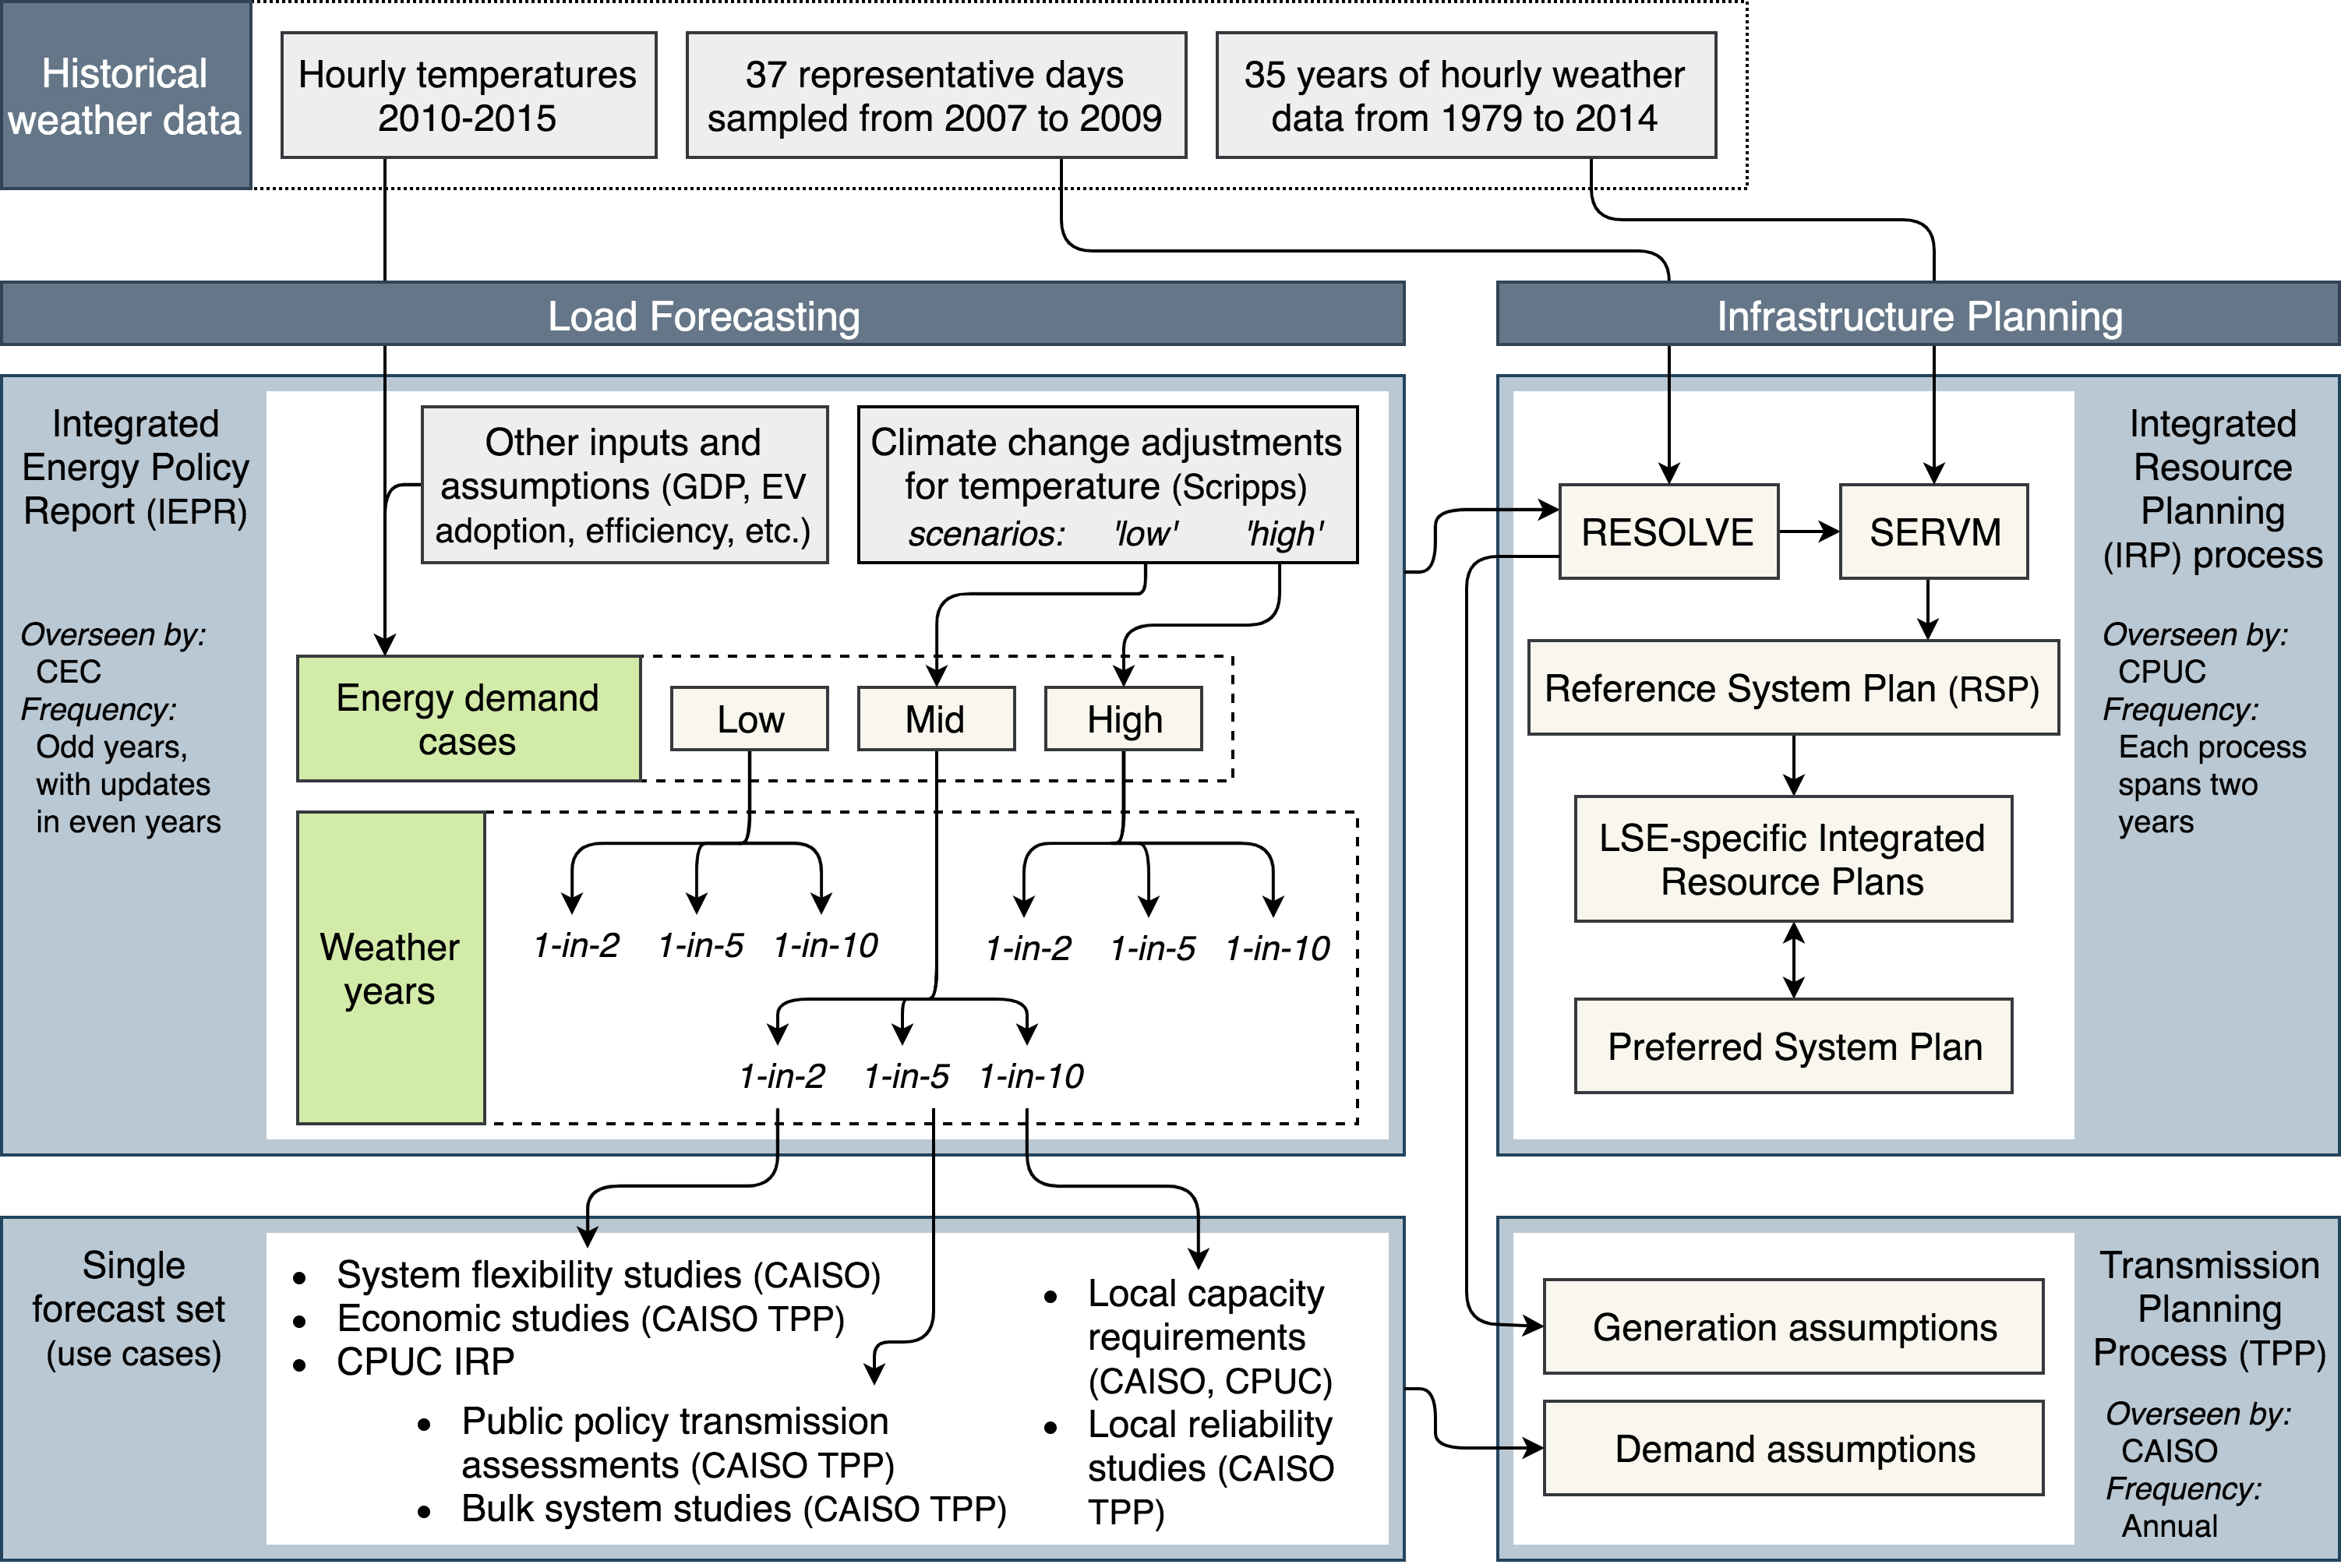
A.2 Integrated Resource Planning (IRP)
The CPUC’s IRP process is the state’s primary venue for long-term planning and procurement decision-making related to electricity infrastructure [101]. The biennial process begins with two phases of system-wide modeling activities that aim to identify a portfolio of resources that meet policy goals [102]. First, the RESOLVE capacity expansion model (see Section 5 for an overview of infrastructure planning model types) from Energy + Environmental Economics (E3) [103] is used to develop large-scale planning and procurement scenarios that guide investment decisions. RESOLVE uses the official demand forecasts from CEC’s IEPR process as inputs. The model aims to identify the optimal transmission and distribution investments that meet demand while satisfying reliability and policy constraints within a particular geographic area. RESOLVE also relies on historical weather data: the model simulates system operations for 37 days “sampled from the historical meteorological record of the period 2007-2009” that are weighted to “produce a reasonable representation of complete distributions of potential conditions” [104, pp.49-50].
Since RESOLVE models the state’s CAISO planning area as a single node [104],666RESOLVE models electricity transmission in the western U.S. with six nodes. Four correspond to California balancing authorities, with CAISO modeled as a single node. The other three CA zones correspond to the Los Angeles Department of Water and Power (LADWP), the Imperial Irrigation District (IID), and, together, the Balancing Authority of Northern California (BANC) and Turlock Irrigation District (TID). The other two nodes “represent regional aggregations of out-of-state balancing authorities” in the northwest and southwest [104, p.48]. its results require post-processing to provide insight about more granular spatial considerations, such as the best way to meet demand in particular load pockets. A second model, the Strategic Energy & Risk Valuation Model (SERVM) from Astrapé Consulting [105], is used by the CPUC to determine whether a full year of hourly demand can be met into the future without adverse reliability impacts with the planning scenario proposed by RESOLVE. SERVM tests RESOLVE outputs with a probabilistic distribution of weather years. Within SERVM, the original (unaveraged) historic weather values are preserved and scaled up to annual and peak values projected in future load forecasts [65]. Historical weather data is used to account for a variety of weather conditions that are crucial inputs to predicting future electricity generation from solar and wind resources (e.g., cloud cover and temperature in addition to wind speed and solar irradiance) and capture resource variability [65]. SERVM achieves greater spatial granularity within the CAISO region by dividing California into eight modeling areas, but it is still a simplification of a full network model [65].777SERVM divides California into eight modeling regions. The four non-CAISO areas are IID, LADWP, BANC, and TID. The CAISO region is divided into four areas corresponding to the utility territories of San Diego Gas & Electric, Pacific Gas & Electric (divided in two), and, together, Southern California Edison and Valley Electric Association [65, p.16].
The results of this system-wide modeling process are adopted as the Reference System Plan (RSP) [102]. Load serving entities (LSEs), which include regulated utilities, maintain control of specific decisions related to infrastructure planning within their systems. LSEs use the RSP as a guide to develop their preferred approaches to meet planning requirements within their own Integrated Resource Plans. LSE-specific IRPs are submitted to the CPUC, which compiles them into a new system-wide portfolio, evaluates them for compliance, and authorizes procurement based on the amount of capacity deemed necessary for reliability. as part of the General Rate Case (GRC), which occurs every three years [101, 102]. (Additional iterative steps may occur between individual LSE plans and the statewide portfolio prior to approval.) In developing their procurement plans, some LSEs currently use a 1-in-10 historical weather year to prepare for climate-related risks [66, 106].
A.3 Transmission Planning Process (TPP)
Each year, CAISO conducts the state’s transmission planning process to determine system needs. The process aims to “identify potential system limitations as well as opportunities for system reinforcements that improve reliability and efficiency” [107]. Finalized in March 2018, the data inputs for the 2019 TPP cycle are designed to be consistent with the CPUC’s IRP [108]. Specifically, the assumptions pertaining to energy generation in the state come from the CPUC’s RESOLVE model, while the demand forecasts come from the CEC’s IEPR (Figure 5).
A.4 Risk assessment
In 2013, the CPUC issued the so-called “Risk OIR” to initiate a new paradigm for increasing transparency into how risks are evaluated and prioritized [109]. These analyses inform investment plans that are documented in GRC filings and subsequently acted upon. The Risk OIR gave rise to two new proceedings: the Safety Model Assessment Proceeding (S-MAP) and the Risk Assessment Mitigation Phase (RAMP) proceeding.
S-MAP is intended to provide documentation requisite for both experts and non-experts to understand the logical processes, input variables, and quantitative methods utilities use to examine risk exposure [110]. In the context of these proceedings, the concept of “risk” encompasses anything that poses a safety threat (e.g., wildfire, employee safety, public safety). Risk metrics include both reported safety incidents (e.g., “overhead wires down”, “fire ignitions”, “employee serious injuries or fatalities”) and preventative actions that were taken (e.g., employee training, tree trimming, and equipment inspection) [111].
Initial guidelines for RAMP were to enumerate “the top ten asset-related risks for which the utility expects to seek recovery in the GRC” focusing on “asset conditions and mitigating risks to those assets” [112]. These guidelines, however, are intended merely as a starting point; there is a stated expectation that the contents of RAMP filings will evolve as risk assessment protocols become more mature. The S-MAP and RAMP proceedings are designed to facilitate this process by providing transparency into existing risk evaluate practices, and by subjecting them to scrutiny (for example, see [95, 90]). Though risk assessment methods are still evolving, the criticism (and praise) regarding these two proceedings shows that demonstrable progress has already been made. Ultimately, the intention is for the S-MAP and RAMP proceedings to tend towards a risk evaluation paradigm that is consistent across all utilities regulated by the CPUC.
A.5 Additional activities
While S-MAP and RAMP are designed to address general risk assessment protocols, a number of other proceedings address additional risk assessment needs on a more targeted ad-hoc basis. Examples include submission of utility wildfire mitigation plans [113], efforts to map wildfire threat [114], and to assess physical threats of grid infrastructure [115]. Other proceedings (e.g., Distribution Resources Planning [116]) may also impact electricity infrastructure planning more broadly by prompting regulated utilities and other stakeholders to consider additional priorities such as distributed renewables integration, public health and safety, and overall system performance.
Notably, recent events related to the increasing frequency and magnitude of wildfires in California have prompted increasing discussion about de-energizing electricity lines and other infrastructure to reduce risk in high-fire conditions. A move towards more frequent de-energization as an operating principle may, in turn, prompt additional focus on distributed operation and planning in contrast to the centralized system planning approach we describe above. This could ultimately lead to a qualitatively different planning framework that more effectively accounts for trade-offs and co-benefits between decisions made in alignment with diverse planning objectives that are currently represented in different proceedings.
Appendix B Mechanisms for power production
Here, we provide additional detail on technology-specific first principles for electricity generators.
B.1 Solar photovoltaics
Power generation from PV cells depends on the available solar irradiance and surrounding temperature, both of which vary with site location [68]. The sun’s rays provide photons that act as a current source and trigger the flow of electrons within the PV cell. Solar irradiance is therefore directly proportional to the current within the cell, and a PV cell operating in half-sun will produce roughly half the power of a cell in full sun [117, Ch.5.4]. On the other hand, higher temperatures affect the voltage within the PV cell by speeding up electron-hole recombination before electrons can generate electricity that leaves the cell. PV cell efficiency is typically reported under standard test conditions, which are defined as solar irradiance of 1 (1 sun), cell temperature of 25°C, and air mass ratio of 1.5 (AM1.5)888The air mass ratio is less critical to the current discussion and is included here primarily for completeness. It describes the amount of air (i.e., atmosphere) that sunlight must travel through to reach the earth. AM1.5 is the standard value used for mid-latitudes, including the contiguous U.S. [117, Ch.5.6]. The decrease in maximum power generation with temperature varies by PV technology and manufacturer, but can be around 0.24-0.45% per degree Celsius [117, Ch.5.7]. Notably, the operating temperature of a PV cell is also affected by the solar irradiance incident on the cell. The following equation is used to estimate this impact:
| (1) |
where (°C) is the operating cell temperature, (°C) is the actual ambient air temperature, is actual solar insolation , and is a standard cell-specific parameter provided by the manufacturer that corresponds to the expected cell temperature under 20°C ambient temperature, 0.8 solar irradiation, and 1 m/s wind speed. A PV panel with NOCT 46 operating at 30°C (86°F) and 1-sun irradiance will therefore have an internal cell temperature of 62.5°C (145°F) and deliver 17% less electricity than is indicated by its rated maximum power capacity [117, Ch.5.7]. Changes from today’s performance due to climate change impacts on temperature and solar irradiance can be estimated in a similar manner.
B.2 Wind
Regional wind speed patterns play a critical role in decisions related to siting, design, and operations of wind farms. The relationship is best explained by examining the equation relating wind power production to wind speed [118]:
| (2) |
where is power produced, is the current wind speed, is the rated wind speed of the turbine, and is a lumped parameter describing mechanical and aerodynamic properties of a particular wind turbine design. Equation 2 holds up to some cut-out wind speed (often 25 mph) which is always greater than . Turbines are turned off when conditions exceed the cut-off wind speed to prevent damage.
Because scales in proportion to wind speed cubed, wind power production is sensitive to wind speed conditions at a specific site. Because changes for different turbine designs, design decisions are made based on the statistical properties of the wind field at a particular site. Therefore, changes in wind field characteristics could reduce power production from existing wind farms.
B.3 Natural gas and other thermal power generation
A typical thermoelectric power plant burns fuel to create high-pressure steam. The steam turns turbine blades, thereby powering an electric generator and converting heat to electricity. The waste heat is released to a low-temperature sink. The thermal efficiency of this cycle can be described as:
| (3) |
where corresponds to the thermal efficiency of the plant, is the high temperature achieved by burning fuel, is the temperature of the low-temperature sink, and is the work done by the temperature differential.
A thermal plant’s electricity production potential thus depends on the temperature differential between the hot steam from the combustion process and the low-temperature sink of waste heat. This low-temperature sink, typically a nearby body of water or the surrounding air, is crucial to cooling the plant, and its ambient temperature directly affects plant operation and efficiency. Thermal plants throughout the U.S. rely on once-through or recirculating water cooling or dry cooling [70, 72, 119]. Water-cooled systems are also subject to thermal discharge limits [74].
Natural gas plants are the most common types of thermal power plants in California and are frequently used to compensate for variability in solar and wind generation. However, similar considerations apply to other types of thermal power generation, including concentrating solar power plants and some biomass plants.
References
- Zamuda [2016] C. Zamuda, Climate Change and the Electricity Sector: Guide for Climate Change Resilience Planning, Technical Report, U.S. Department of Energy, 2016.
- Barsugli et al. [2013] J. J. Barsugli, G. Guentchev, R. M. Horton, A. Wood, L. O. Mearns, X. Liang, J. A. Winkler, K. Dixon, K. Hayhoe, R. B. Rood, L. Goddard, A. Ray, L. Buja, C. Ammann, The practitioner’s dilemma: How to assess the credibility of downscaled climate projections, Eos, Transactions American Geophysical Union 94 (2013) 424–425.
- Kunkel et al. [2013] K. E. Kunkel, T. R. Karl, H. Brooks, J. Kossin, J. H. Lawrimore, D. Arndt, L. Bosart, D. Changnon, S. L. Cutter, N. Doesken, K. Emanuel, P. Y. Groisman, R. W. Katz, T. Knutson, J. O’Brien, C. J. Paciorek, T. C. Peterson, K. Redmond, D. Robinson, J. Trapp, R. Vose, S. Weaver, M. Wehner, K. Wolter, D. Wuebbles, Monitoring and understanding trends in extreme storms: State of knowledge, Bulletin of the American Meteorological Society 94 (2013) 499–514.
- Hallegatte [2009] S. Hallegatte, Strategies to adapt to an uncertain climate change, Global Environmental Change 19 (2009) 240 – 247. Traditional Peoples and Climate Change.
- Craig et al. [2018] M. T. Craig, S. Cohen, J. Macknick, C. Draxl, O. J. Guerra, M. Sengupta, S. E. Haupt, B.-M. Hodge, C. Brancucci, A review of the potential impacts of climate change on bulk power system planning and operations in the United States, Renewable and Sustainable Energy Reviews 98 (2018) 255–267.
- Bartos et al. [2016] M. Bartos, M. Chester, N. Johnson, B. Gorman, D. Eisenberg, I. Linkov, M. Bates, Impacts of rising air temperatures on electric transmission ampacity and peak electricity load in the United States, Environmental Research Letters 11 (2016) 114008.
- Biesbroek et al. [2013] G. R. Biesbroek, J. E. M. Klostermann, C. J. A. M. Termeer, P. Kabat, On the nature of barriers to climate change adaptation, Regional Environmental Change 13 (2013) 1119–1129.
- Mimura et al. [2014] N. Mimura, R. Pulwarty, D. Duc, I. Elshinnawy, M. Redsteer, H. Huang, J. Nkem, R. S. Rodriguez, Adaptation planning and implementation, in: Climate Change 2014: Impacts, Adaptation, and Vulnerability. Part A: Global and Sectoral Aspects. Contribution of Working Group II to the Fifth Assessment Report of the Intergovernmental Panel on Climate Change, Cambridge University Press, Cambridge, United Kingdom and New York, NY, USA, 2014, pp. 869–898.
- Little Hoover Commission [2014] Little Hoover Commission, Governing California Through Climate Change, Technical Report, Milton Marks “Little Hoover” Commission on California State Government Organization and Economy, 2014.
- opr [2018] Planning and Investing for a Resilient California: A guidebook for state agencies, Technical Report, California Governor’s Office of Planning and Research, 2018.
- Shi et al. [2019] R. Shi, B. F. Hobbs, H. Jiang, When can decision analysis improve climate adaptation planning? Two procedures to match analysis approaches with adaptation problems, Climatic Change (2019).
- Briley et al. [2015] L. Briley, D. Brown, S. E. Kalafatis, Overcoming barriers during the co-production of climate information for decision-making, Climate Risk Management 9 (2015) 41 – 49. Boundary Organizations.
- Gerlak et al. [2018] A. K. Gerlak, J. Weston, B. McMahan, R. L. Murray, M. Mills-Novoa, Climate risk management and the electricity sector, Climate Risk Management 19 (2018) 12–22.
- iep [2018] 2017 Integrated Energy Policy Report, Technical Report CEC-100-2017-001-CMF, California Energy Commission, 2018.
- Burillo et al. [2017] D. Burillo, M. Chester, B. Ruddell, N. Johnson, Electricity demand planning forecasts should consider climate non-stationarity to maintain reserves during heat waves, Applied Energy 206 (2017) 267–277.
- Orford [2019] A. D. Orford, Regulation in a Changing Climate: A Search for Standards and an Assessment of the California Climate Adaptation Experience, Georgetown Law Review Accepted (2019) 1–73.
- Knapstein [2019] J. Knapstein, Interview: Pacific Gas & Electric, Energy Portfolio Procurement & Policy, Climate Policy Analyst, 2019.
- Governor’s Office of Planning and Research et al. [2019] Governor’s Office of Planning and Research, California Natural Resources Agency, California Energy Commission, California’s Fourth Climate Change Assessment: About the Assessment, 2019.
- Schwarzenegger [2008] A. Schwarzenegger, Executive Order S-13-08, 2008.
- California Ocean Protection Council and California Natural Resources Agency [2018] California Ocean Protection Council, California Natural Resources Agency, State of California Sea-Level Rise Guidance, Technical Report, California Ocean Protection Council, 2018.
- cnr [2009] 2009 California Climate Adaptation Strategy, Technical Report, California Natural Resources Agency, 2009.
- Governor’s Office of Planning and Research [2019] C. Governor’s Office of Planning, Research, Adaptation clearinghouse, https://resilientca.org/, 2019. Accessed: 2019-07-16.
- California Energy Commission [2017] California Energy Commission, 2016 Integrated Energy Policy Report Update, Technical Report, California Energy Commission, 2017.
- Climate-Safe Infrastructure Working Group [2018] Climate-Safe Infrastructure Working Group, Paying it forward: The Path Toward Climate-Safe Infrastructure in California. Executive Summary of a Report of the Climate-Safe Infrastructure Working Group to the California State Legislature and the Strategic Growth Council, Technical Report, California Natural Resources Agency, Sacramento, CA, 2018.
- Deane and Climate-Safe Infrastructure Working Group [2018] J. R. Deane, Climate-Safe Infrastructure Working Group, Paying it forward: The Path Toward Climate-Safe Infrastructure in California. Appendix 7: Probabilistic risk assessment for climate-safe infrastructure., Technical Report, California Natural Resources Agency, Sacramento, CA, 2018.
- California Public Utilities Commission [2018] California Public Utilities Commission, Order Instituting Rulemaking to Consider Strategies and Guidance for Climate Change Adaptation, 2018.
- Randolph and California Public Utilities Commission [2018] L. M. Randolph, California Public Utilities Commission, CPUC Considers Climate Change Adaptation Strategies, Working for California, A Monthly Newsletter from the CPUC (2018).
- cct [2015] Perspectives and Guidance for Climate Change Analysis, Technical Report CEC-100-2017-001-CMF, California Department of Water Resources, 2015.
- Flato et al. [2013] G. Flato, J. Marotzke, B. Abiodun, P. Braconnot, S. Chou, W. Collins, P. Cox, F. Driouech, S. Emori, V. Eyring, C. Forest, P. Gleckler, E. Guilyardi, C. Jakob, V. Kattsov, C. Reason, M. Rummukainen, Evaluation of climate models, in: T. Stocker, D. Qin, G.-K. Plattner, M. Tignor, S. Allen, J. Boschung, A. Nauels, Y. Xia, V. Bex, P. Midgley (Eds.), Climate Change 2013: The Physical Science Basis. Contribution of Working Group I to the Fifth Assess-ment Report of the Intergovernmental Panel on Climate Change, Cambridge University Press, Cambridge, United Kingdom and New York, NY, USA, 2013.
- Taylor et al. [2012] K. E. Taylor, R. J. Stouffer, G. A. Meehl, An overview of cmip5 and the experiment design, Bulletin of the American Meteorological Society 93 (2012) 485–498.
- California Energy Commission [2019] California Energy Commission, CalAdapt website, https://cal-adapt.org/, 2019. Accessed: 2019-05-15.
- Pierce et al. [2018] D. W. Pierce, J. F. Kalansky, D. R. Cayan, Climate, drought, and sea level rise scenarios for California’s fourth climate change assessment, Technical Report CCCA4-CEC-2018-006, California Energy Commission, 2018.
- Randolph [2019] L. M. Randolph, Order Instituting Rulemaking to Consider Strategies and Guidance for Climate Change Adaptation: Decision on Phase 1 topics 1 and 2, 2019.
- Pierce et al. [2014] D. W. Pierce, D. R. Cayan, B. L. Thrasher, Statistical downscaling using localized constructed analogs (loca), Journal of Hydrometeorology 15 (2014) 2558–2585.
- Pierce et al. [2018] D. W. Pierce, J. F. Kalansky, D. R. Cayan, Climate, Drought, and Sea Level Rise Scenarios for the Fourth California Climate Assessment, Technical Report CNRA-CEC-2018-006., California Energy Commission, 2018.
- Ward [2013] D. M. Ward, The effect of weather on grid systems and the reliability of electricity supply, Climatic Change 121 (2013) 103–113.
- Electric Power Research Institute [2009] Electric Power Research Institute, Key Climate Variables Relevant to the Energy Sector and Electric Utilities, Technical Report January, Electric Power Research Institute, 2009.
- Bartos and Chester [2015] M. D. Bartos, M. V. Chester, Impacts of climate change on electric power supply in the Western United States, Nature Climate Change 5 (2015) 748–752.
- Clark et al. [2019] S. S. Clark, M. V. Chester, T. P. Seager, D. A. Eisenberg, The vulnerability of interdependent urban infrastructure systems to climate change: could Phoenix experience a Katrina of extreme heat?, Sustainable and Resilient Infrastructure 4 (2019) 21–35.
- Voisin et al. [2016] N. Voisin, M. Kintner-Meyer, R. Skaggs, T. Nguyen, D. Wu, J. Dirks, Y. Xie, M. Hejazi, Vulnerability of the US western electric grid to hydro-climatological conditions: How bad can it get?, Energy 115 (2016) 1–12.
- Zohrabian and Sanders [2018] A. Zohrabian, K. T. Sanders, Assessing the impact of drought on the emissions- and water-intensity of California’s transitioning power sector, Energy Policy 123 (2018) 461–470.
- Lynn and California Department of Water Resources [2015] E. Lynn, California Department of Water Resources, California Climate Science and Data for Water Resources Management, Technical Report, California Department of Water Resources, 2015.
- Rhoades et al. [2018] A. M. Rhoades, P. A. Ullrich, C. M. Zarzycki, Projecting 21st century snowpack trends in western USA mountains using variable-resolution CESM, Climate Dynamics 50 (2018) 261–288.
- PG&E [2018] PG&E, Pacific Gas and Electric Company’s Wildfire Mitigation Plan, Prepared for the California Public Utilities Commission (2018).
- Wahl et al. [2019] E. R. Wahl, E. Zorita, V. Trouet, A. H. Taylor, Jet stream dynamics, hydroclimate, and fire in California from 1600 CE to present, Proceedings of the National Academy of Sciences 116 (2019) 5393–5398.
- Dale et al. [2018] L. Dale, M. Carnall, M. Wei, G. Fitts, S. Lewis McDonald, Assessing the Impact of Wildfires on the California Electricity Grid, Technical Report, California Energy Commission, 2018.
- de Almeida and Mostafavi [2016] B. A. de Almeida, A. Mostafavi, Resilience of infrastructure systems to sea-level rise in coastal areas: Impacts, adaptation measures, and implementation challenges, Sustainability 8 (2016).
- Bruzgul et al. [2018] J. Bruzgul, R. Kay, B. Rodehorst, A. Petrow, T. Hendrickson, M. Bruguera, K. Collison, D. Moreno, D. Revell, Rising Seas and Electricity Infrastructure: Potential Impacts and Adaptation Options for San Diego Gas and Electric, Technical Report August 2018, California Energy Commission, 2018.
- Kopp et al. [2014] R. E. Kopp, R. M. Horton, C. M. Little, J. X. Mitrovica, M. Oppenheimer, D. J. Rasmussen, B. H. Strauss, C. Tebaldi, Probabilistic 21st and 22nd century sea-level projections at a global network of tide-gauge sites, Earth’s Future 2 (2014) 383–406.
- DeConto and Pollard [2016] R. M. DeConto, D. Pollard, Contribution of Antarctica to past and future sea-level rise, Nature 531 (2016) 591.
- Radke et al. [2017] J. D. Radke, G. S. Biging, M. Schmidt-Poolman, H. Foster, E. Roe, Y. Ju, O. Hoes, T. Beach, A. Alruheil, L. Meier, W.-C. Hsu, R. Neuhausler, W. Fourt, W. Lang, U. Garcia, I. Reeves, Assessment of California’s Natural Gas Pipeline Vulnerability to Climate Change, Technical Report CEC-500-2017-008, California Energy Commission, 2017.
- Livneh et al. [2015] B. Livneh, T. J. Bohn, D. W. Pierce, F. Munoz-Arriola, B. Nijssen, R. Vose, D. R. Cayan, L. Brekke, A spatially comprehensive, hydrometeorological data set for Mexico, the U.S., and Southern Canada 1950–2013, Scientific Data 2 (2015) 150042.
- cal [2016] Estimates of Natural and Unimpaired Flows for the Central Valley of California: Water Years 1922-2014, Technical Report, Department of Water Resources, Bay-Delta Office, 2016.
- Westerling [2018] A. L. Westerling, Wildfire Simulations for California’s Fourth Climate Change Assessment: Projecting Changes in Extreme Wildfire Events with a Warming Climate, Technical Report CCCA4-CEC-2018- 014, California Energy Commission, 2018.
- Beard et al. [2010] L. M. Beard, J. B. Cardell, I. Dobson, F. Galvan, D. Hawkins, W. Jewell, M. Kezunovic, T. J. Overbye, P. K. Sen, D. J. Tylavsky, Key technical challenges for the electric power industry and climate change, IEEE Transactions on Energy Conversion 25 (2010) 465–473.
- Dirks et al. [2015] J. A. Dirks, W. J. Gorrissen, J. H. Hathaway, D. C. Skorski, M. J. Scott, T. C. Pulsipher, M. Huang, Y. Liu, J. S. Rice, Impacts of climate change on energy consumption and peak demand in buildings: A detailed regional approach, Energy 79 (2015) 20–32.
- Pincetl et al. [2016] S. Pincetl, M. Chester, D. Eisenman, Urban heat stress vulnerability in the U.S. Southwest: The role of sociotechnical systems, Sustainability 8 (2016) 1–13.
- ras [2019] 2009 California Residential Appliance Saturation Survey, Technical Report CEC‐ 200‐ 2010‐004, California Energy Commission, 2019.
- Scientists [2018] U. o. C. Scientists, Underwater: Rising Seas, Chronic Floods, and the Implications for US Coastal Real Estate (2018) 1–28.
- str [2019] Wildfires and Climate Change: California’s Energy Future, Technical Report, Governor Newsom’s Strike Force, 2019.
- Arghandeh et al. [2016] R. Arghandeh, A. von Meier, L. Mehrmanesh, L. Mili, On the definition of cyber-physical resilience in power systems, Renewable and Sustainable Energy Reviews 58 (2016) 1060–1069.
- Wang et al. [2016] Y. Wang, C. Chen, J. Wang, R. Baldick, Research on Resilience of Power Systems Under Natural Disasters—A Review, IEEE Transactions on Power Systems 31 (2016) 1604–1613.
- Arghandeh et al. [2014] R. Arghandeh, M. Brown, A. Del Rosso, G. Ghatikar, E. Stewart, A. Vojdani, A. von Meier, The Local Team: Leveraging Distributed Resources to Improve Resilience, IEEE Power & Energy Magazine (2014).
- California Public Utilities Commission [2017] California Public Utilities Commission, California’s Distributed Energy Resources Action Plan: Aligning Vision and Action, 2017.
- California Public Utilities Commission [2019] California Public Utilities Commission, Unified Resource Adequacy and Integrated Resource Plan Inputs and Assumptions – Guidance for Production Cost Modeling and Network Reliability Studies, California Public Utilities Commission (2019) 1–81.
- Rogers [2019] R. Rogers, Interview: California Public Utilities Commission, Grid Planning & Reliability, Senior Regulatory Analyst, 2019.
- Young [2019] P. Young, Interview: California Public Utilities Commission, Energy Resource Modeling Team, Regulatory Analyst, 2019.
- Dubey et al. [2013] S. Dubey, J. N. Sarvaiya, B. Seshadri, Temperature dependent photovoltaic (PV) efficiency and its effect on PV production in the world - A review, Energy Procedia 33 (2013) 311–321.
- Pryor et al. [2012] S. C. Pryor, R. J. Barthelmie, J. T. Schoof, Past and future wind climates over the contiguous USA based on the North American Regional Climate Change Assessment Program model suite, Journal of Geophysical Research Atmospheres 117 (2012) 1–17.
- Peer and Sanders [2016] R. A. Peer, K. T. Sanders, Characterizing cooling water source and usage patterns across US thermoelectric power plants: A comprehensive assessment of self-reported cooling water data, Environmental Research Letters 11 (2016) 124030.
- Voisin et al. [2018] N. Voisin, M. Kintner-Meyer, D. Wu, R. Skaggs, T. Fu, T. Zhou, T. Nguyen, I. Kraucunas, Opportunities for Joint Water–Energy Management: Sensitivity of the 2010 Western U.S. Electricity Grid Operations to Climate Oscillations, Bulletin of the American Meteorological Society 99 (2018) 299–312.
- Miara et al. [2017] A. Miara, J. E. Macknick, C. J. Vörösmarty, V. C. Tidwell, R. Newmark, B. Fekete, Climate and water resource change impacts and adaptation potential for US power supply, Nature Climate Change 7 (2017) 793–798.
- Cook et al. [2015] M. A. Cook, C. W. King, F. T. Davidson, M. E. Webber, Assessing the impacts of droughts and heat waves at thermoelectric power plants in the United States using integrated regression, thermodynamic, and climate models, Energy Reports 1 (2015) 193–203.
- McCall et al. [2016] J. McCall, J. Macknick, H. Daniel, Water-Related Power Plant Curtailments: An Overview of Incidents and Contributing Factors, Technical Report, National Renewable Energy Laboratory, 2016.
- Ke et al. [2016] X. Ke, D. Wu, J. Rice, M. Kintner-Meyer, N. Lu, Quantifying impacts of heat waves on power grid operation, Applied Energy 183 (2016) 504–512.
- Tarroja et al. [2016] B. Tarroja, A. AghaKouchak, S. Samuelsen, Quantifying climate change impacts on hydropower generation and implications on electric grid greenhouse gas emissions and operation, Energy 111 (2016) 295–305.
- Zhou et al. [2018] T. Zhou, N. Voisin, T. Fu, Non-stationary hydropower generation projections constrained by environmental and electricity grid operations over the western United States, Environmental Research Letters 13 (2018) 074035.
- Ren et al. [2008] H. Ren, I. Dobson, B. A. Carreras, Long-term effect of the n-1 criterion on cascading line outages in an evolving power transmission grid, IEEE Transactions on Power Systems 23 (2008) 1217–1225.
- Panteli and Mancarella [2015] M. Panteli, P. Mancarella, Influence of extreme weather and climate change on the resilience of power systems: Impacts and possible mitigation strategies, Electric Power Systems Research 127 (2015) 259–270.
- Burillo et al. [2018] D. Burillo, M. Chester, S. Pincetl, E. Fournier, D. Walton, F. Sun, M. Schwartz, K. Reich, A. Hall, Climate Change in Los Angeles County: Grid Vulnerability to Extreme Heat, Technical Report August 2018, California Energy Commission, 2018.
- Xu et al. [2015] Y. Xu, C.-C. Liu, K. P. Schneider, D. T. Ton, Toward a Resilient Distribution System, in: 2015 IEEE Power & Energy Society General Meeting, IEEE, 2015, pp. 1–5.
- Li et al. [2017] Z. Li, M. Shahidehpour, F. Aminifar, A. Alabdulwahab, Y. Al-Turki, Networked Microgrids for Enhancing the Power System Resilience, Proceedings of the IEEE 105 (2017) 1289–1310.
- Bajwa et al. [2019] A. A. Bajwa, H. Mokhlis, S. Mekhilef, M. Mubin, Enhancing power system resilience leveraging microgrids: A review, Journal of Renewable and Sustainable Energy 11 (2019).
- Zhang et al. [2007] X. Zhang, E. Gockenbach, V. Wasserberg, H. Borsi, Estimation of the lifetime of the electrical components in distribution networks, IEEE Transactions on Power Delivery 22 (2007) 515–522.
- Shafieezadeh et al. [2014] A. Shafieezadeh, U. P. Onyewuchi, M. M. Begovic, R. DesRoches, Fragility Assessment of Wood Poles in Power Distribution Networks against Extreme Wind Hazards, IEEE Transactions on Power Delivery 29 (2014) 131–139.
- SDG&E [2018] SDG&E, San Diego Gas and Electric Company’s Wildfire Mitigation Plan, Prepared for the California Public Utilities Commission (2018).
- Clarfeld et al. [2019] L. A. Clarfeld, P. D. H. Hines, E. M. Hernandez, M. J. Eppstein, Risk of cascading blackouts given correlated component outages, CoRR abs/1901.03304 (2019).
- Sathaye et al. [2013] J. A. Sathaye, L. L. Dale, P. H. Larsen, G. A. Fitts, K. Koy, S. M. Lewis, A. F. P. de Lucena, Estimating impacts of warming temperatures on California’s electricity system, Global Environmental Change 23 (2013) 499–511.
- Haasnoot et al. [2013] M. Haasnoot, J. H. Kwakkel, W. E. Walker, J. ter Maat, Dynamic adaptive policy pathways: A method for crafting robust decisions for a deeply uncertain world, Global Environmental Change 23 (2013) 485–498.
- O’Donnell et al. [2018] A. O’Donnell, E. A. Charkowicz, J. Battis, A. Chamarty, S. Haine, F. Hanes, M. Kurtovich, Risk and Safety Aspects of Risk Assessment and Mitigation Phase Report of Pacific Gas & Electric Company Investigation 17-11-003, Technical Report, California Public Utilities Commission, 2018.
- Haine [2015] S. Haine, Safety and Enforcement Division Staff White Paper on As Low As Reasonably Practicable (ALARP) Risk-informed Decision Framework Applied to Public Utility Safety, Technical Report, California Public Utilities Commission, 2015.
- Jagannathan et al. [????] K. Jagannathan, A. Jones, A. Kerr, Implications of Climate Model Selection for Projections of Decision-relevant Metrics: A Case Study of Chill Hours in California, Climate Services (????) Under Review.
- Geospatial Innovation Facility at UC Berkeley [2019] Geospatial Innovation Facility at UC Berkeley, Annual Average Maximum Temperature, 2019.
- Wickham et al. [2019] H. Wickham, W. Chang, L. Henry, T. L. Pedersen, K. Takahashi, C. Wilke, K. Woo, A box and whiskers plot, 2019.
- Haine et al. [2016] S. Haine, H. Kane, A. O’Donnell, Safety and Enforcement Division Evaluation Report on Risk Evaluation Models and Risk-based Decision Frameworks in A.15-05-002, et al., Technical Report, California Public Utilities Commission, 2016.
- de Sherbinin et al. [2011] A. de Sherbinin, M. Castro, F. Gemenne, M. M. Cernea, S. Adamo, P. M. Fearnside, G. Krieger, S. Lahmani, A. Oliver-Smith, A. Pankhurst, T. Scudder, B. Singer, Y. Tan, G. Wannier, P. Boncour, C. Ehrhart, G. Hugo, B. Pandey, G. Shi, Preparing for resettlement associated with climate change, Science 334 (2011) 456–457.
- California Energy Commission [2015] California Energy Commission, California’s Energy Governing Institutions, 2015.
- California Energy Commission [2018] California Energy Commission, 2018 Integrated Energy Policy Report Update, Volume II, Technical Report, California Energy Commission, 2018.
- California Energy Commission [2017] California Energy Commission, Transcript of 02/22/2017 IEPR Commissioner Workshop on Data Inputs and Assumptions for IEPR Modeling and Forecasting Activities, Technical Report, California Energy Commission, 2017.
- Picker and California Public Utilities Commission [2016] M. Picker, California Public Utilities Commission, Assigned Commissioner’s Ruling Adopting Assumptions and Scenarios for use in the California Independent System Operator’s 2016-17 Transmission Planning Process and Future Commission Proceedings, 2016.
- California Public Utilities Commission [2019] California Public Utilities Commission, Integrated Resource Plan and Long Term Procurement Plan (IRP-LTPP), 2019.
- California Public Utilities Commission [2018] California Public Utilities Commission, Decision Setting Requirements for Load Serving Entities Filing Integrated Resource Plans, Technical Report, California Public Utilities Commission, 2018.
- Energy and Environmental Economics [2019] Energy and Environmental Economics, RESOLVE: Renewable Energy Solutions Model, 2019.
- Energy and Environmental Economics [2017] Energy and Environmental Economics, RESOLVE Documentation: CPUC 2017 IRP, Technical Report September, Energy and Environmental Economics, 2017.
- Astrape Consulting [2019] Astrape Consulting, SERVM Software: Strategic Energy & Risk Valuation Model, 2019.
- Billinton et al. [2015] J. Billinton, T. Russell, Pacific Gas & Electric, Southern California Edison, San Diego Gas & Electric, Transmission and Distribution Planning 101, Technical Report, 2015.
- California Independent Systems Operator [2019] California Independent Systems Operator, 2018-2019 transmission planning process, 2019.
- California Independent Systems Operator [2018] California Independent Systems Operator, 2018-2019 Transmission Planning Process Unified Planning Assumptions and Study Plan, Technical Report, California Independent Systems Operator, 2018.
- ris [2013a] Order Institute Rulemaking to Develop a Risk-Based Decision-Making Framework to Evaluate Safety and Reliability Improvements and Revise the General Rate Case Plan for Energy Utilities, Technical Report R.13-11-006, 2013a.
- ris [2013b] Decision Incorporating a Risk-Based Decision-Making Framework into the Rate Case Plan and Modifying Appendix A of Decision 07-07-004, Technical Report R.13-11-006, California Public Utilities Commission, 2013b.
- ris [2019] Phase Two Decision Adopting Risk Spending Accountability Report Requirements and Safety Performance Metrics for Investor-Owned Utilities and Adopting a Safety Model Approach for Small and Multi-Jurisdictional Utilities, Technical Report D.19-04-020, California Public Utilities Commission, 2019.
- sma [2016] Interim Decision Adopting the Multi-Attribute Approach (or Utility Equivalent Features) and Directing Utilities to Take Steps Towards a More Uniform Risk Management Framework, Technical Report D.16-08-018, California Public Utilities Commission, 2016.
- wil [2019] Guidance Decision on 2019 Wildfire Mitigation Plans Submitted Pursuant to Senate Bill 901, Technical Report R.18-10-007, California Public Utilities Commission, 2019.
- fir [2015] Order Instituting Rulemaking to Develop and Adopt Fire-Threat Maps and Fire-Safety Regulations, Technical Report R.15-05-006, California Public Utilities Commission, 2015.
- sec [2015] Order Instituting Rulemaking to Fulfill the Requirements of Public Utilities Code Sections 364 and 768.6, Technical Report R.15-06-009, California Public Utilities Commission, 2015.
- California Public Utilities Commission [2019] California Public Utilities Commission, Distribution Resources Plan (R.14-08-013), 2019.
- Masters [2013] G. M. Masters, Renewable and Efficient Electric Power Systems, IEEE Press, John Wiley & Sons, Hoboken, NJ, second edition, 2013.
- dun [2019] On wind speed sensor configurations and altitude control in airborne wind energy systems, American Controls Conference (2019).
- Lee et al. [2018] U. Lee, J. Han, A. Elgowainy, M. Wang, Regional water consumption for hydro and thermal electricity generation in the United States, Applied Energy 210 (2018) 661–672.