Cloud Atlas: Weak color modulations due to rotation in the planetary-mass companion GU Psc b and 11 other brown dwarfs
Abstract
Among the greatest challenges in understanding ultra-cool brown dwarf and exoplanet atmospheres is the evolution of cloud structure as a function of temperature and gravity. In this study, we present the rotational modulations of GU Psc b – a rare mid-T spectral type planetary-mass companion at the end of the L/T spectral type transition. Based on the HST/WFC3 1.1-1.67 time-series spectra, we observe a quasi-sinusoidal light curve with a peak-to-trough flux variation of 2.7% and a minimum period of eight hours. The rotation-modulated spectral variations are weakly wavelength-dependent, or largely gray between 1.1-1.67m. The gray modulations indicate that heterogeneous clouds are present in the photosphere of this low-gravity mid-T dwarf. We place the color and brightness variations of GU Psc b in the context of rotational modulations reported for mid-L to late-T dwarfs. Based on these observations, we report a tentative trend: mid-to-late T dwarfs become slightly redder in color with increasing -band brightness, while L dwarfs become slightly bluer with increasing brightness. If this trend is verified with more T-dwarf samples, it suggests that in addition to the mostly gray modulations, there is a second-order spectral-type dependence on the nature of rotational modulations.
1 Introduction
One of the most perplexing observations of the ultracool atmospheres of brown dwarfs and directly-imaged exoplanets is the prominent color evolution across the L/T spectral type transition. Over a narrow temperature range (100 K) the atmospheres transition from red (in the near-infrared, ) to blue () colors. It has been proposed that this color evolution could be caused by cloud thinning (Ackerman & Marley, 2001; Saumon & Marley, 2008), cloud patchiness (Burgasser et al., 2002; Marley et al., 2010), cloud structure evolution (Tsuji & Nakajima, 2003; Burrows et al., 2006; Charnay et al., 2018), and possibly even compositional-gradient driven instability (Tremblin et al., 2016, 2019). Brown dwarfs with mid-T spectral types also tend to be about 0.5 magnitudes brighter in the J-band than earlier and later spectral type counterparts – also known as the J-band brightening, possibly as a result of cloud disruption (Burgasser et al., 2002, 2006b; Dupuy & Liu, 2012). While models of ultracool atmospheres had considerable success in fitting the L spectral type sequence (with thick silicate condensate clouds) and the late-T spectral type brown dwarfs (with mostly cloud-free atmospheres), the rapid color evolution and brightening across the L/T transition point to the existence of processes not well understood.
Therefore, understanding atmospheric and cloud evolution from late-L spectral types though the L/T transition to late-T dwarfs remains an important challenge. It is clear that the color changes carry important information about the nature of the processes that occur in these cooling atmospheres.
Surface gravity may be part of the puzzle, too. Small samples of L/T transition brown dwarfs suggest that the L/T transition occurs at lower effective temperatures for low-gravity objects (Metchev & Hillenbrand, 2006; Dupuy et al., 2009; Marley et al., 2012; Bowler et al., 2013; Liu et al., 2016; Miles-Páez et al., 2017). The magnitude of -band brightening could also be larger for low-gravity objects if we include directly imaged planets (see Fig. 16 in Dupuy & Liu, 2012). Alas, as cooling objects cross swiftly the L/T transition, very few brown dwarfs are known with low masses at the L/T transition, making it difficult to test model predictions about the interplay of surface gravity and cloud evolution.
A particularly important probe of atmospheric properties is time-resolved high-precision (sub-percent level) spectrophotometry, that can – through the rotation of the target – explore non-uniform brightness distribution in an atmosphere with fixed gravity and interior temperature. Such rotational mapping studies have been used successfully to constrain cloud properties in ultracool atmospheres, including those with planetary masses (e.g., Apai et al., 2013; Buenzli et al., 2014; Metchev et al., 2015; Zhou et al., 2016; Biller, 2017; Apai et al., 2017; Manjavacas et al., 2019; Miles-Páez et al., 2019; Zhou et al., 2019). The wavelength dependence of rotation modulations sheds light on the variations of cloud particle sizes, molecular abundances, and photospheric temperatures. In a rotating atmosphere, the temporal modulations at a given wavelength probe the atmosphere’s spatial structure in a pressure range. Consequently, comparisons of the modulations observed at different wavelengths probe pressure-dependent properties in the atmosphere.
Multiple studies have used time-resolved ground-based photometry (e.g., Artigau et al., 2009; Radigan et al., 2012; Biller et al., 2013; Radigan, 2014), spectroscopy (e.g., Schlawin et al., 2017), or space-based spectrophotometry (e.g., Buenzli et al., 2012, 2015; Yang et al., 2015; Karalidi et al., 2016; Lew et al., 2016; Yang et al., 2016) to explore the variations of the near-infrared colors of rotating brown dwarfs (from mid-L to T8 spectral types). All of these studies found gray, i.e., only weakly wavelength-dependent modulations in the near-infrared, even for objects with large-amplitude (10%) modulations. Radiative-transfer-based models presented in Apai et al. (2013) explain the gray modulations with a correlated change in effective temperature and cloud thickness; this study and that of Radigan et al. (2012) show that changes in a single model parameter (temperature or cloud thickness) cannot explain the observed modulations. Similar conclusions have been drawn by Biller et al. (2018), who observed the planetary-mass late-L dwarf PSO J318.5338-22.8603. They suggest that the heterogeneous high-altitude clouds or extended silicate clouds could explain the weak wavelength-dependence of near-IR and mid-IR modulation amplitudes, as well as the phase offset between the near-IR and mid-IR light curves.
These examples demonstrate the power of time-resolved high-precision spectrophotometry in constraining the heterogeneous cloud properties of individual atmospheres and – through comparisons of objects spanning the L–L/T–T sequence – the potential for deciphering cloud evolution in cooling atmospheres. For a more complete discussion of results from time-resolved studies we refer to recent reviews (Biller, 2017; Artigau, 2018).
In this paper we present a new, space-based and high-precision time-resolved spectrophotometric study of GU Psc b (catalog ), one of the rare planetary-mass brown dwarfs at the end of the L/T sequence. In Section 2 and 3 we described the target, the observations and data reduction process. We present the spectra and light curves in Section 4. . We discuss the implications of our results to the color change in the L/T transition in Section 6 and summarize our conclusions in Section 7.
2 GU Psc and GU Psc b
GU Psc (or 2MASS J01123504+1703557 (catalog )) is an M3.5 dwarf at based on the Gaia parallax of (Gaia Collaboration et al., 2016, 2018; Luri et al., 2018). Based on its kinematic and photometric properties, Malo et al. (2013) categorized the GU Psc system as a highly probable (96.9%) member of AB Doradus moving group (ABDMG), which is around Myr old (Zuckerman et al., 2004). The detection and measured width of emission of GU Psc by Riaz et al. (2006) indicates that the age of the system is in between – respectively (Barrado y Navascués & Martín, 2003; White & Basri, 2003; West et al., 2008). Naud et al. (2014), hereafter N14, find that the calculated X-ray luminosity ( at ) of GU Psc based on the ROSAT observation is similar to that of other single M dwarfs in ABDMG and is higher than that of field stars. The kinematic properties, emission, and X-ray luminosity measurements together suggest that GU Psc is a relatively young system compared to field dwarfs.
N14 provides an estimate of the GU Psc’s metallicity ([Fe/H]) that ranges from to with various methods (Mann et al., 2013; Newton et al., 2014). The measured periodic variability of days (Norton et al., 2007) and (, N14) of GU Psc suggests that it is a rapid rotator. More detailed characterization of GU Psc system can be found in N14.
GU Psc b (catalog GU Psc b), discovered by N14, is at a projected distance of au from GU Psc. Based on the near-infrared spectral index and the comparison with standard T dwarfs, N14 classifies GU Psc b as a T3.5 dwarf. N14 finds the best-fit effective temperature ranges from 1,000 to 1,100 K by comparing the GU Psc b’s near-infrared spectrum with atmospheric models (Baraffe et al., 2003; Saumon & Marley, 2008). Based on the ABDMG’s age of Myr and the fitted effective temperature range, N14 estimates the mass of GU Psc b to be around 9-13 , which is close to the deuterium-burning mass limit of 12-13 (Saumon & Marley, 2008) – commonly adopted as the borderline between brown dwarfs and giant planets with solar metallicity. Naud et al. (2017) report a tentative J-band photometric variability of GU Psc b with a peak-to-trough flux variation of at a period of 5.9 hours based on one out of three nights of 5-6 hour observation with WIRCam Imager at 3.6m Canada-France-Hawaii Telescope.
3 Observation and Data Reduction
We utilized six consecutive Hubble Space Telescope (HST) orbits to observe the rotational modulation of GU Psc b in Wide Field Camera 3 (WFC3)’s G141 grism mode (, spectral resolving power or dispersion of 4.7 nm/pixel with a plate scale of 0.13”/pixel) on Jan 08 2018. These observations are part of the HST Large Treasury Program Cloud Atlas (P.I: Apai, ID: GO-14241). There are eleven 201 s-long integration spectroscopic frames in each 96-minute long HST orbit. We restricted HST’s orientation angle to minimize possible spectral contamination from galaxies and bright stars within small angular separations from GU Psc b.
The data reduction pipeline is similar to that in Lew et al. (2016). In brief, our data reduction process started from flt.fits files, which are produced by the calwf3 pipeline for zero-read and bias calibration, dark image subtraction, flat-fielding, detector nonlinearity correction, and cosmic rays flagging. Our well-vetted pipeline (e.g., Buenzli et al., 2012; Apai et al., 2013; Yang et al., 2015; Zhou et al., 2018) then interpolated around the cosmic-rays affected and other bad pixels before subtracting the sky background. We followed the method in Kümmel et al. (2011) for background reduction that scales the master sky image from Kümmel et al. (2011) for background reduction. We used Source Extractor (Bertin & Arnouts, 1996) to extract source location from the stacked direct images that are observed with F132N filter at the beginning of each orbit for wavelength calibration. We used aXe (Kümmel et al., 2009) with a six-pixel wide cross-dispersion aperture for spectral extraction. We performed an absolute flux correction for finite aperture photometry by interpolating the table of encircled energy as a function wavelength and diameter of Table 6b in Kuntschner et al. (2011).
We did not find a significant ramp effect (Smith et al., 2008; Long et al., 2014) in the six-orbit-long observation, therefore no ramp correction (e.g., Zhou et al., 2017) was performed. The less pronounced ramp effect in our data is likely because of the low count rate (peak count rate with an averaged count rate 111The averaged count rate was calculated over a box that is six-pixel wide in cross-dispersion direction and 130-pixel long in the spectral dispersion direction of GU Psc b. of ) compared to that of the case studies in Zhou et al. (2017). Given a lower count rate, the ramp profile becomes more linear and is less significant compared to the photon noise. Any uncorrected ramp effect, which mostly increases the flux in the first orbit, will only increase the brightness variations reported in this study.
3.1 Contamination assessment
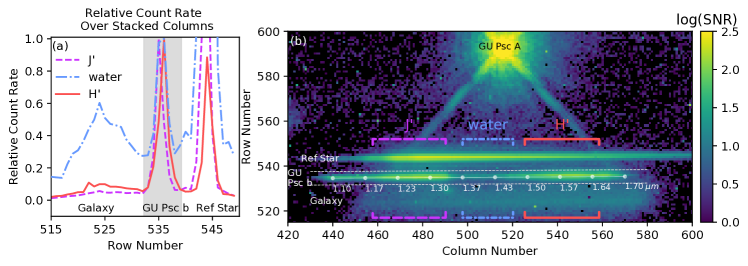
As Figure 1 shows, there are two sources in close angular proximity of GU Psc b, leading to a second-order spectrum of a reference star and to a first-order spectrum of a galaxy (see also Figure 1 in N14). Also, there is a faint diffraction spike from the GU Psc’s 0th-order (undispersed) grism image superimposes upon part of GU Psc b’s spectrum. To mitigate this, we interpolate the flux density in the 1.17-1.19 region of the GU Psc b spectra (see Figure 2) to avoid possible contamination from GU Psc’s 0th-order diffraction spike.
To assess possible contamination from the two nearby sources, we sum the measured count rates in the same row (x-axis) over three ranges of columns (i.e., the bracketed regions colored in magenta, blue, and red in Figure 1b), approximating the measured count rate in the (1.18-1.33, water (1.37-1.47, and bands (1.50-1.65. The summed count rates is then plotted as a function of row number in Figure 1a. In Figure 1a, the GU Psc b’s summed count rate spans roughly across rows 532538 and is highlighted by the gray band. The gray region is similar to the aperture used for spectral extraction222The direction of spectral trace and the corresponding aperture for spectral extraction are not perfectly aligned with the x-axis of the image grid but a field-dependent multi-order polynomial of x and y axes (Kuntschner et al., 2009). Therefore, the row number at where the GU Psc b’s count rate reaches the maximum in the J’ and H’ bands are slightly different.. We normalize the summed count rate of the three ranges of column so that the GU Psc’s peak count rate equals one.
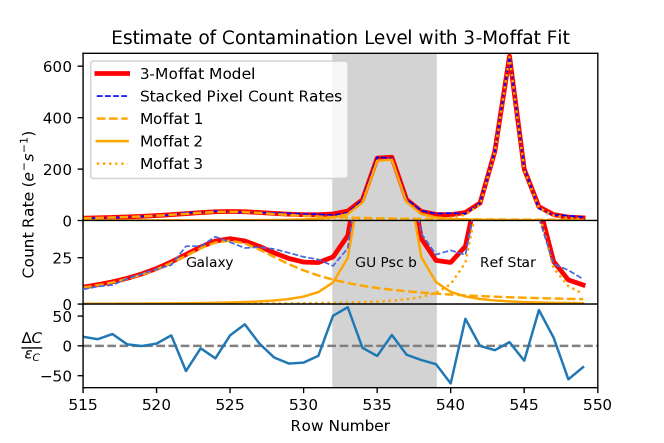
Figure 1a provides an order-of-magnitude estimation of the contamination level – within the spectral aperture for GU Psc b, the contamination level is less than 10% of the GU Psc b’s peak count rate in the and bands, but much higher () in the water band. A more sophisticated analysis that fits 1D 3-Moffat profiles to the summed count rate from 1.1-1.7 (column number 440-570) gives a similar estimate of contamination level (13%, see also Figure 5). Because of the low signal-to-noise ratio and the moderate level of contamination in the water band, in this study we choose to focus on the -band, -band, and the integrated white () light curve.
In Figure 3, the reference star’s light curve shows a slight brightening trend at a sub-percent level. A simple straight-line fit to the reference star’s light curve gives a slope of /hour, or 0.7% for an eight-hour baseline. This linear-brightening trend is possibly an HST systematics that leads to visit-long slopes (e.g., Berta et al., 2012; Wakeford et al., 2016). In the field of view no other source’s light curve has similar signal-to-noise ratios to verify the presence of this possible sub-percent-level systematics. The low signal-to-noise ratio light curve of the nearby background galaxy fluctuates at about four-percent from the brightest to the dimmest state. The maximum contamination level of flux variation from the nearby sources is roughly equal to the product of flux contamination fraction and the flux variation of nearby sources, which is about level. The estimate of 0.52%, which is a generous upper limit considering the different light curve profiles of between GU Psc b and other sources, is much lower than the observed peak-to-trough flux variation of 2.7% (see Section 4.2) in the integrated white light curve of GU Psc b.
We also check the distribution of flux density deviations from the median spectrum. We find only two data points with 3.2- deviation from the median spectral flux densities among 124 spectral bins in 66 exposures. Therefore, no statistically significant deviation from the median spectrum is found assuming spectral points are independent of each other. Therefore, our careful inspection of spectral variations and reduced images confirms that the observed rotational modulation is intrinsic to GU Psc b.
4 Spectra and Rotational Modulations
4.1 Spectrum and spectral variations
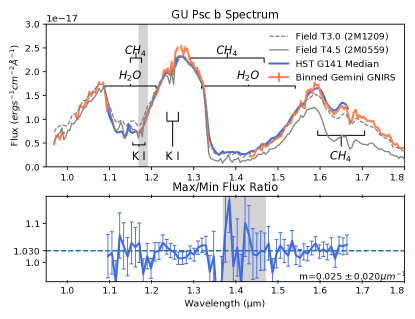
We plot the HST median spectra together with the Gemini Near-InfraRed Spectrograph (GNIRS) spectrum (R800) from N14 in the top panel of Figure 2. We also overplot the spectra of two field T dwarfs, T4.5 2MASS J055919141404488 (catalog ) (Burgasser et al., 2006a) and T3 2MASS J120956131004008 (catalog ) (Burgasser et al., 2004) that are normalized to the same J-band peak flux density as that of GU Psc b. Our HST/G141 observations provide the first flux density measurements of GU Psc b in the water-band absorption region of 1.1-1.2. After the J-band flux normalization of the two field T dwarfs’ spectra, GU Psc b’s spectrum matches better the T4.5 spectrum at wavelengths but matches better the T3 spectrum at longer wavelengths ().
In the bottom panel of Figure 2, we plot the binned ratio of the median spectra of the sixth and the third orbit, which are the orbits at which the broadband-integrated flux density reaches its maximum and minimum. The max/min flux ratio shows no strong wavelength-dependence for the rotational modulations, similar to that of T0 dwarf SIMP 0136 (Apai et al., 2013). After excluding the low-signal-to-noise-ratio water band (1.37-1.47), the mean max/min flux ratio is about 3.0%. The fitted slope (m =) for the max/min flux ratio suggests that there is no significant wavelength-dependence.
4.2 Light curves of rotational modulation
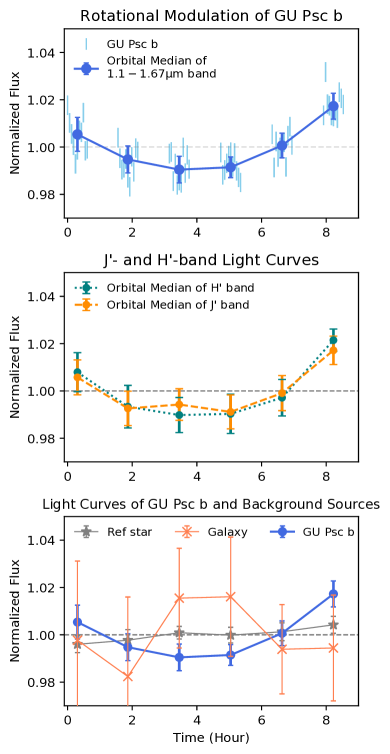
We plot the integrated white (1.1-1.67) light curves of GU Psc b and those of the other two nearby sources in Figure 3. The GU Psc b’s light curve manifests a sinusoidal profile with a period longer than the observation baseline. The sinusoidal pattern of GU Psc b’s light curve is distinct from the almost flat light curve of the reference star and the choppy light curve of the nearby galaxy. The -band () and -band () light curves also show a similar profile as that of the integrated white light curve. Based on the integrated white light curve, the rotational modulation amplitude is at least 1.35%, or for peak-to-trough flux variation . This variability level is consistent with the previously reported marginal detection of peak-to-trough variability of at a timescale of hour by Naud et al. (2017).
5 Rotational Modulations on the Color-Magnitude Diagram
Color-magnitude diagram (CMD) is a useful tool for studying the brown dwarf atmosphere evolution with thousands of brown dwarfs photometric and parallax observations (e.g., Dupuy & Liu, 2012; Best et al., 2015). Meanwhile, an increasing number of brown dwarfs with detected rotational modulations through HST/G141 time-series spectral observations have been reported.
5.1 Binning HST time-series spectra to broadband photometries
The HST/G141 grism’s wavelength coverage does not fully overlap with that of the 2MASS band. By weighting the HST/G141 spectral variations in the HST (1.18-1.33) and (1.50-1.65) bands with the 2MASS -band and H-band spectral response curves (Wright et al., 2010), we implicitly assume that modulation amplitudes and .
To plot the HST/G141 spectral variations on a 2MASS CMD, we also adopt the 2MASS - and -band magnitudes (Cutri et al., 2003) as the mean magnitudes of the HST - and -band modulations, except for the most variable object 2M2139333Even with the assumption of , the mean of HST does not necessarily equal to 2MASS , especially for object with large modulation amplitude.. We first scale the -band peak of the 0.6-2.65 2M2139 spectrum from the SpeX library (Burgasser, 2014) to be the same as that of the averaged HST spectra. Then we use the scaled SpeX spectrum to calculate the mean magnitude in the 2MASS and bands during the HST observation of 2M2139.
5.2 Empirical models for color-magnitude variations
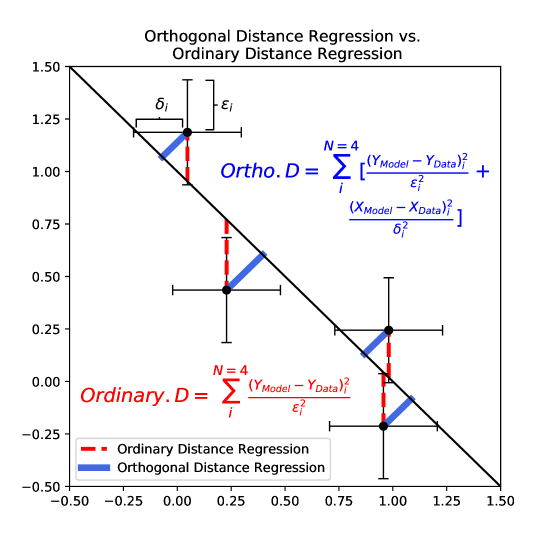
The color change due to rotational modulations in any individual object is much smaller compared to the color evolution across the L/T transition. To visualize the small scale of color change and the large scale of color evolution in CMD, we fit a straight line to the magnitude-color variation (i.e. vs. ) for each object’s rotational modulations. We then plot the fitted straight line of magnitude-color variation on CMD. We obtain the best-fit slope and y-intercept using an orthogonal distance regression algorithm with scipy.odr (see also Figure 6), which minimizes the orthogonal distance, weighted by both x- and y-axis uncertainties, between photometric points and the straight-line model.
We remind that this linear fit is only for illustrating the primary direction of color changes with respect to the brightness variations. The color-magnitude variations could be non-linear, too.
For reference, we also plot the color-magnitude variations of a blackbody with varying temperatures, either by hotter or cooler from the effective temperature for each object as a dashed gray line in the subpanels of Figure 4. In the near-infrared and bands, a sum of blackbodies with different temperatures is still similar to a Planck function (Schwartz & Cowan, 2015). Therefore, this model acts as a toy model of a heterogeneous photosphere with a mixture of blackbodies at different temperatures.
5.3 Result of fitting magnitude-color variations
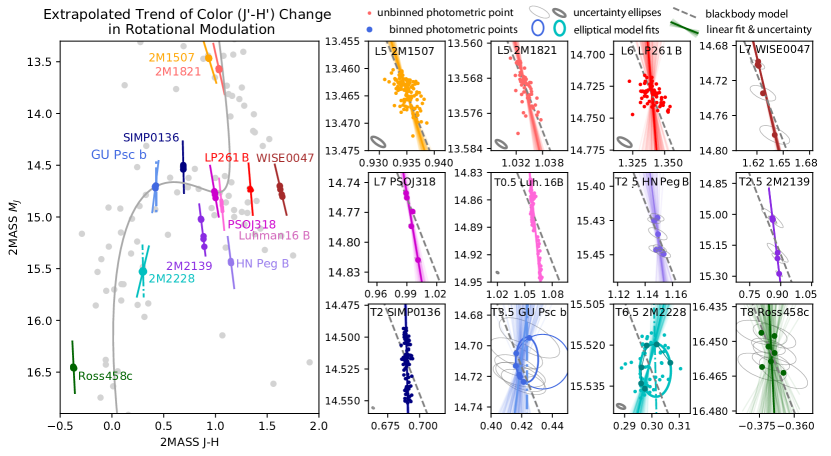
In the left panel of Figure 4, we present the trajectories of the rotational modulations of twelve ultracool atmospheres spanning a broad spectral type range. We plot the colors and magnitudes of field brown dwarfs whose with SNR10 for and band photometry from the updated catalog of Dupuy & Liu (2012). The solid gray line is the empirically-derived polynomial function of magnitude vs. spectral type from Dupuy & Liu (2012).
The slope of the fitted lines qualitatively shows how much the colors change with respect to the -band flux variations. Among the plotted objects, 2M2139 demonstrates the largest color change (), but it is still much smaller than its -band magnitude variations (). All of the plotted objects show less change in their colors compared to their modulation amplitudes. In other words, all objects show only weak color changes in their rotational modulations.
In the CMD, a positive slope suggests that the object becomes brighter and redder, and a negative slope suggests that the object becomes brighter and bluer. Most of the objects show negative slopes, especially among L dwarfs. Among the plotted objects, only GU Psc b and 2M2228 show positive slopes. Our fitted slope uncertainty distribution suggests that there is about 20% probability for GU Psc b to have a negative slope as seen in other L dwarfs. Therefore, the fitted slope of GU Psc b’s color-magnitude variations is not significantly different from that of the other L/T transition objects. There are two possible interpretations for the possible positive slope – either there is a phase shift between - and -band light curves of GU Psc b, as in the case of 2M2228 (phase shift of , Buenzli et al. 2012), or the -band modulation amplitude is indeed higher than that of -band. A longer baseline observation is needed to understand and verify if the color change of GU Psc b is indeed distinct from that of other L dwarfs.
6 Discussions
6.1 The first planetary-mass object with confirmed modulations at the end of the L/T transition
The modulations of GU Psc b described here are the first in a planetary-mass object at the end of the L/T transition (T3-T5), confirming the previous -band marginal detection by Naud et al. (2017). Based on the observed rotational modulations, we also argue that low-gravity mid-T dwarf’s photosphere is not cloud-free as – with the spectral evolution from L to T type – the silicate cloud base presumably sank to deeper pressures (see the condensation curves in Robinson & Marley 2014; Helling & Casewell 2014).
In addition to the modulations observed in GU Psc b, we have gathered a unique data set of rotational modulations found in planetary-mass objects across different effective temperatures, including the L7 spectral type PSOJ318 Biller et al. (2015, 2018), T2 type SIMP0136 (Apai et al., 2013), and the T8 type Ross 458c (Manjavacas et al., 2019). Our dataset provides a useful reference point for future studies of cloud evolution across the L/T transition. Furthermore, the wavelength-dependence in rotational modulations of GU Psc b will be useful in testing predictions of different cloud models on the role of gravity in shaping cloud structure, as well as on testing the hypothesis that the L/T transition, and perhaps the -band brightening too, depend on surface gravity.
6.2 The modulation amplitude and rotational period
In any rotating atmosphere, an asymmetric brightness distribution leads to rotational modulations. The modulation amplitudes cannot be directly translated to brightness maps, as the hemisphere-integrated measurements necessarily result in information loss (although some inferences can be drawn, see Cowan & Agol 2008; Apai et al. 2013; Cowan et al. 2013; Karalidi et al. 2016). The high modulation amplitude observed in GU Psc b suggests that there are prominent rotationally asymmetric features (dark or bright) that significantly () impact even the hemisphere-integrated brightness of the photosphere. The features may be large and/or high contrast; if there are many features, these must be distributed asymmetrically. From infrared rotational modulation surveys that include both high- and low-gravity brown dwarfs, we already know that brown dwarf atmospheres are ubiquitously heterogeneous (e.g., Buenzli et al., 2014; Metchev et al., 2015). Typical field brown dwarfs outside the L/T spectral type transition have peak-to-trough flux variations of less than 2% level in the band (Buenzli et al., 2014; Radigan et al., 2014). The observed peak-to-trough flux variations of 2.7% of GU Psc b is consistent with Radigan et al. (2014)’s conclusion that L/T transition objects are likely to have the largest modulation amplitudes. The high modulation amplitude of this low-gravity object provides another data point to test whether high modulation amplitude is correlated with low gravity, as claimed by Vos et al. (2017) based on a compilation of published variability amplitudes of brown dwarfs.
The minimum period of eight hours is in line with the measured timescale of periodic modulations of other brown dwarfs, ranging from as short as 1.4 hours (Buenzli et al. 2012) to 18 hours or longer (e.g. 2M2148 Metchev et al. 2015). The actual rotational modulation profile may evolve with time, as seen in long-baseline observations of multiple L/T transition brown dwarfs (e.g., Apai et al., 2017), most prominently detected in all three brown dwarfs (2M2139, 2M1324, and SIMP0136) monitored by the Spitzer Space Telescope in the Extrasolar Storms program (Yang et al., 2016; Apai et al., 2017). That study shows that the light curve evolution is the likely result of planetary-scale waves that modulated surface brightness (Apai et al., 2017), possibly through the interplay of atmospheric circulations, condensations, and cloud formation/dispersal (Tan & Showman, 2017, 2018; Showman et al., 2018). These mechanisms may also be present in GU Psc b and their presence could be revealed by continuous observations over 3-4 rotational periods.
The lower limit of the rotational period of GU Psc b also provides another data point for studying the evolution of spin as a function of mass and age. Assuming that the radius of GU Psc b is roughly 1.3-1.4 Jupiter radius, as expected for a 100 Myr old and object (Chabrier et al., 2000), with a minimum rotational period of 8 hours, the spin velocity is about . A longer period (P hours) will result in a slower spin. At the age of ABDMG, which is Myrs, our upper limit of spin rate of GU Psc b is similar with that of other planetary-mass companions at different ages (3-300 Myrs old) (e.g., Snellen et al., 2014; Zhou et al., 2016; Biller et al., 2018; Bryan et al., 2018). Because the radii contract along with the loss of interior entropy for young objects, the spin velocities increase as the objects cool with age under the conservation of angular momentum. Therefore, the spin rates of GU Psc b could reach as high as after radius contracting to one Jupiter radius. A better period constraint is required to test if the spin rate is consistent with the suggested universal spin-mass relation of Scholz et al. (2018)(see also Zhou et al. 2019).
6.3 Gray modulations and atmospheric heterogeneity
Both the color-magnitude variations shown in Figure 4 and the ratio of the brightest–to–dimmest spectra shown in Figure 2 demonstrate that the modulation amplitudes of GU Psc b are similar in and band (peak-to-trough variation of and , respectively), and hence mostly gray. Previous observations find similar modulation amplitudes in and bands for L/T transition objects (e.g., Artigau et al., 2009; Radigan et al., 2012; Apai et al., 2013), although the modulation amplitudes can be different in molecular bands (e.g., water) or at longer wavelengths (e.g., band) (e.g., Apai et al., 2013; Biller et al., 2013). The modeling of these data suggest that spatial variations of cloud properties are responsible for the modulations (e.g., Apai et al., 2013). Detailed atmospheric modeling of space-based, high-precision time-domain data argues for simultaneous changes in cloud thickness and temperature as the cause for spatially varying cloud brightness (thin warm and thick cold clouds, Apai et al. 2013; Buenzli et al. 2015). GU Psc b also shows similarly gray rotational modulations. Therefore, we argue that correlated variations of cloud opacity and temperature are the most likely cause for the observed gray modulations in GU Psc b.
The observed weak (non-zero) wavelength dependence may also carry information about spatial variation in particle size distribution. A weak and positive wavelength dependence in rotational modulations could be explained by the varying presence of particles with sizes larger than one micron (e.g. see Figure 5 Hiranaka et al., 2016). If this is true, then GU Psc b’s atmosphere is in contrast to L dwarf atmospheres, which are often found to be reddened or extinguished by sub-micron grains (Hiranaka et al., 2016; Marocco et al., 2014, see also retrieval analysis from Burningham et al. 2017). This would be consistent with the cloud thinning scenario that predicts larger mean particle sizes (or larger ) for mid-T and smaller mean particle sizes (or smaller ) for L dwarfs (Saumon & Marley, 2008).
6.4 No strong color change in rotational modulations across the L/T Transition
In the color-magnitude plot shown in Figure 4 even the most highly variable object (2M2139) shows only less than 20% relative difference between its -band and the -band modulation amplitudes ( vs. ). All other objects show similarly gray color change in modulations (): no known source is varying its color at a level comparable to the brightness modulations. In other words, the observed modulations in all sources are close to gray, albeit with some variety. The lack of strong color in rotational modulations in brown dwarfs with spectral types ranging from mid-L to late-T is consistent with the paradigm in which spatially heterogeneous clouds modulate the hemisphere-integrated brightness.
Given that the color changes due to atmospheric heterogeneity are different from the overall blue–to–red color evolution found across the L/T transition (a large color evolution with only a small change in absolute -band magnitude from L8-to-T5 spectral type), we conclude that atmospheric heterogeneity alone does not directly cause the drastic color evolution across the L/T transition, at least for low-gravity atmospheres (i.e., GU Psc b, SIMP0136, PSOJ318). However, as previously suggested by Radigan et al. (2012), atmospheric heterogeneity could still affect the evolution of atmospheres over evolutionary timescales — an atmosphere with thinner clouds or more patchy cloud distribution cools more efficiently because more flux can be radiated from below the cloud base. More efficient cooling leads to a larger loss of entropy over evolutionary timescales. As a result, the loss of interior entropy is coupled with varying degrees of atmospheric heterogeneity and could still lead to the observed drastic color evolution in L/T transition. Our observations only probe the impact of atmospheric heterogeneity with fixed interior entropy in rotational timescales. Change of cloud structure will affect the relative abundance of objects with different spectral sub-types across the L/T transition, as predicted by Saumon & Marley (2008). Observational-bias corrected samples of brown dwarfs will be powerful to test the coupled evolution of cloud structure and interior entropy over evolutionary timescales.
It is tempting to perceive a possible trend in Figure 4 in the slope of the magnitude-color variations from L to T dwarfs: L dwarfs become brighter and bluer, early T dwarfs become brighter with almost no color change, and the two out of three mid-to-late T dwarfs become brighter and redder. However, we are limited by the small sample size of T dwarfs with time-resolved spectrophotometry, and the uncertain slope of GU Psc b due to incomplete phase coverage. Therefore, we remain cautious about the significance of this tentative trend. More long-term time-resolved spectroscopy of T dwarfs is needed to verify this tentative trend and to test if there is a statistically significant difference between L and T dwarfs in the nature of their wavelength-dependent rotational modulations.
7 Conclusions
In this study we present the HST time-resolved near-infrared spectral variations of the planetary-mass, T3.5 spectral type object GU Psc b. The key conclusions of our study are as follows:
-
1.
We confirm the previously reported (Naud et al., 2017) tentative rotational modulations in the planetary-mass companion GU Psc b. This is the first planetary-mass object in the T3–T5 spectral range with confirmed rotational modulations.
-
2.
Based on our HST WFC3/G141 observations we place a lower limit of peak-to-trough flux variation of GU Psc b and a period of eight hours or longer. As our phase coverage is incomplete, it is likely that the actual flux variations are somewhat higher.
-
3.
We find mostly gray (wavelength-dependent slope of m = , c.f. Figure 2) rotational modulations for wavelengths from to excluding the water-band. Based on the gray modulations, we argue that cloud opacity likely dominates the rotational modulations in the photosphere of low-gravity mid-T dwarf GU Psc b.
-
4.
From our compilation of mid-L to late-T dwarfs, we find their rotational modulations to be mostly gray, including objects across the L/T transition. We argue that atmospheric heterogeneity cannot explain the drastic color evolution across the L/T transition over rotational timescales. Cloud heterogeneity could still play an important role in atmospheric evolution in the L/T transition over evolutionary timescales.
-
5.
From L to T dwarfs we find an interesting but tentative trend in the slope of the magnitude-color variations. If confirmed, this trend would indicate that the nature of the rotational modulation is spectral type-dependent. However, more samples of T dwarf’s rotational modulations with complete phase coverage are needed to test the significance of the trend.
Together with 2M1207b (catalog ), 2MASS J13243553+6358281 (catalog ), PSOJ318, Ross 458c, and SIMP0136, GU Psc b is another rare planetary-mass objects with large infrared modulation amplitude. This object is a yet unique example of T3-T5 spectral type, low-gravity object with detected rotational modulations. As such it provides an important reference to study cloud-structure evolution as functions of effective temperature and gravity. Soon the higher sensitivity and wider wavelength coverage of next-generation telescopes such as the James Webb Space Telescope (JWST) and Extremely Large Telescopes (Giant Magellan Telescope, Thirty Meter Telescope, and the European ELT) will transform time-resolved spectroscopy into an even more powerful method for constraining the cloud structure and particle-size distribution.
8 Acknowledgement
We would like to thank the anonymous referee for constructive comments and suggestions that significantly improve this paper. We would like to thank Esther Buenzli for providing the time-resolved spectra of 2M2228. Support for Program number HST-GO-14241.001A was provided by NASA through a grant from the Space Telescope Science Institute, which is operated by the Association of Universities for Research in Astronomy, Incorporated, under NASA contract NAS5-26555. This research has benefited from the Montreal Brown Dwarf and Exoplanet Spectral Library, maintained by Jonathan Gagné, and the SpeX Prism Spectral Libraries, maintained by Adam Burgasser at http://pono.ucsd.edu/~adam/browndwarfs/spexprism. This publication makes use of data products from the Two Micron All Sky Survey, which is a joint project of the University of Massachusetts and the Infrared Processing and Analysis Center/California Institute of Technology, funded by the National Aeronautics and Space Administration and the National Science Foundation. This work has made use of data from the European Space Agency (ESA) mission Gaia (https://www.cosmos.esa.int/gaia), processed by the Gaia Data Processing and Analysis Consortium (DPAC, https://www.cosmos.esa.int/web/gaia/dpac/consortium). Funding for the DPAC has been provided by national institutions, in particular the institutions participating in the Gaia Multilateral Agreement.
References
- Ackerman & Marley (2001) Ackerman, A. S., & Marley, M. S. 2001, ApJ, 556, 872
- Apai et al. (2013) Apai, D., Radigan, J., Buenzli, E., et al. 2013, ApJ, 768, 121
- Apai et al. (2017) Apai, D., Karalidi, T., Marley, M. S., et al. 2017, Science, 357, 683
- Artigau (2018) Artigau, É. 2018, ArXiv e-prints, arXiv:1803.07672
- Artigau et al. (2009) Artigau, É., Bouchard, S., Doyon, R., & Lafrenière, D. 2009, ApJ, 701, 1534
- Baraffe et al. (2003) Baraffe, I., Chabrier, G., Barman, T. S., Allard, F., & Hauschildt, P. H. 2003, A&A, 402, 701
- Barrado y Navascués & Martín (2003) Barrado y Navascués, D., & Martín, E. L. 2003, AJ, 126, 2997
- Berta et al. (2012) Berta, Z. K., Charbonneau, D., Désert, J.-M., et al. 2012, ApJ, 747, 35
- Bertin & Arnouts (1996) Bertin, E., & Arnouts, S. 1996, A&AS, 117, 393
- Best et al. (2015) Best, W. M. J., Liu, M. C., Magnier, E. A., et al. 2015, ApJ, 814, 118
- Biller (2017) Biller, B. 2017, The Astronomical Review, 13, 1
- Biller et al. (2013) Biller, B. A., Crossfield, I. J. M., Mancini, L., et al. 2013, ApJ, 778, L10
- Biller et al. (2015) Biller, B. A., Vos, J., Bonavita, M., et al. 2015, ApJ, 813, L23
- Biller et al. (2018) Biller, B. A., Vos, J., Buenzli, E., et al. 2018, AJ, 155, 95
- Bowler et al. (2013) Bowler, B. P., Liu, M. C., Shkolnik, E. L., & Dupuy, T. J. 2013, ApJ, 774, 55
- Bryan et al. (2018) Bryan, M. L., Benneke, B., Knutson, H. A., Batygin, K., & Bowler, B. P. 2018, Nature Astronomy, 2, 138
- Buenzli et al. (2014) Buenzli, E., Apai, D., Radigan, J., Reid, I. N., & Flateau, D. 2014, ApJ, 782, 77
- Buenzli et al. (2015) Buenzli, E., Saumon, D., Marley, M. S., et al. 2015, ApJ, 798, 127
- Buenzli et al. (2012) Buenzli, E., Apai, D., Morley, C. V., et al. 2012, ApJ, 760, L31
- Burgasser (2014) Burgasser, A. J. 2014, in Astronomical Society of India Conference Series, Vol. 11, Astronomical Society of India Conference Series, 7–16
- Burgasser et al. (2006a) Burgasser, A. J., Geballe, T. R., Leggett, S. K., Kirkpatrick, J. D., & Golimowski, D. A. 2006a, ApJ, 637, 1067
- Burgasser et al. (2006b) Burgasser, A. J., Kirkpatrick, J. D., Cruz, K. L., et al. 2006b, ApJS, 166, 585
- Burgasser et al. (2002) Burgasser, A. J., Marley, M. S., Ackerman, A. S., et al. 2002, ApJ, 571, L151
- Burgasser et al. (2004) Burgasser, A. J., McElwain, M. W., Kirkpatrick, J. D., et al. 2004, AJ, 127, 2856
- Burningham et al. (2017) Burningham, B., Marley, M. S., Line, M. R., et al. 2017, MNRAS, 470, 1177
- Burrows et al. (2006) Burrows, A., Sudarsky, D., & Hubeny, I. 2006, ApJ, 640, 1063
- Chabrier et al. (2000) Chabrier, G., Baraffe, I., Allard, F., & Hauschildt, P. 2000, ApJ, 542, 464
- Charnay et al. (2018) Charnay, B., Bézard, B., Baudino, J.-L., et al. 2018, ApJ, 854, 172
- Cowan & Agol (2008) Cowan, N. B., & Agol, E. 2008, ApJ, 678, L129
- Cowan et al. (2013) Cowan, N. B., Fuentes, P. A., & Haggard, H. M. 2013, MNRAS, 434, 2465
- Cutri et al. (2003) Cutri, R. M., Skrutskie, M. F., van Dyk, S., et al. 2003, VizieR Online Data Catalog, II/246
- Dupuy & Liu (2012) Dupuy, T. J., & Liu, M. C. 2012, ApJS, 201, 19
- Dupuy et al. (2009) Dupuy, T. J., Liu, M. C., & Ireland, M. J. 2009, ApJ, 699, 168
- Gaia Collaboration et al. (2016) Gaia Collaboration, Prusti, T., de Bruijne, J. H. J., et al. 2016, A&A, 595, A1
- Gaia Collaboration et al. (2018) Gaia Collaboration, Brown, A. G. A., Vallenari, A., et al. 2018, A&A, 616, A1
- Helling & Casewell (2014) Helling, C., & Casewell, S. 2014, A&A Rev., 22, 80
- Hiranaka et al. (2016) Hiranaka, K., Cruz, K. L., Douglas, S. T., Marley, M. S., & Baldassare, V. F. 2016, ArXiv e-prints, arXiv:1606.09485
- Karalidi et al. (2016) Karalidi, T., Apai, D., Marley, M. S., & Buenzli, E. 2016, ApJ, 825, 90
- Kümmel et al. (2011) Kümmel, M., Kuntschner, H., Walsh, J. R., & Bushouse, H. 2011, ST-ECF Instrument Science Report WFC3-2011-05 (STScI)
- Kümmel et al. (2009) Kümmel, M., Walsh, J. R., Pirzkal, N., Kuntschner, H., & Pasquali, A. 2009, PASP, 121, 59
- Kuntschner et al. (2009) Kuntschner, H., Bushouse, H., Kümmel, M., & Walsh, J. R. 2009, ST-ECF Instrument Science Report WFC3-2009-17, 17
- Kuntschner et al. (2011) Kuntschner, H., Kümmel, M., Walsh, J. R., & Bushouse, H. 2011, ST-ECF Instrument Science Report WFC3-2011-05, 5
- Lew et al. (2016) Lew, B. W. P., Apai, D., Zhou, Y., et al. 2016, ApJ, 829, L32
- Liu et al. (2016) Liu, M. C., Dupuy, T. J., & Allers, K. N. 2016, ApJ, 833, 96
- Long et al. (2014) Long, K. S., Baggett, S. M., MacKenty, J. W., & McCullough, P. M. 2014, Attempts to Mitigate Trapping Effects in Scanned Grism Observations of Exoplanet Transits with WFC3/IR, Tech. rep.
- Luri et al. (2018) Luri, X., Brown, A. G. A., Sarro, L. M., et al. 2018, A&A, 616, A9
- Malo et al. (2013) Malo, L., Doyon, R., Lafrenière, D., et al. 2013, ApJ, 762, 88
- Manjavacas et al. (2018) Manjavacas, E., Apai, D., Zhou, Y., et al. 2018, AJ, 155, 11
- Manjavacas et al. (2019) Manjavacas, E., Apai, D., Lew, B. W. P., et al. 2019, ApJ, 875, L15
- Mann et al. (2013) Mann, A. W., Brewer, J. M., Gaidos, E., Lépine, S., & Hilton, E. J. 2013, AJ, 145, 52
- Marley et al. (2012) Marley, M. S., Saumon, D., Cushing, M., et al. 2012, ApJ, 754, 135
- Marley et al. (2010) Marley, M. S., Saumon, D., & Goldblatt, C. 2010, ApJ, 723, L117
- Marocco et al. (2014) Marocco, F., Day-Jones, A. C., Lucas, P. W., et al. 2014, MNRAS, 439, 372
- Metchev & Hillenbrand (2006) Metchev, S. A., & Hillenbrand, L. A. 2006, ApJ, 651, 1166
- Metchev et al. (2015) Metchev, S. A., Heinze, A., Apai, D., et al. 2015, ApJ, 799, 154
- Miles-Páez et al. (2017) Miles-Páez, P. A., Metchev, S., Luhman, K. L., Marengo, M., & Hulsebus, A. 2017, AJ, 154, 262. https://doi.org/10.3847%2F1538-3881%2Faa9711
- Miles-Páez et al. (2019) Miles-Páez, P. A., Metchev, S., Apai, D., et al. 2019, ApJ, 883, 181. https://doi.org/10.3847%2F1538-4357%2Fab3d25
- Naud et al. (2017) Naud, M.-E., Artigau, É., Rowe, J. F., et al. 2017, AJ, 154, 138
- Naud et al. (2014) Naud, M.-E., Artigau, É., Malo, L., et al. 2014, ApJ, 787, 5
- Newton et al. (2014) Newton, E. R., Charbonneau, D., Irwin, J., et al. 2014, AJ, 147, 20
- Norton et al. (2007) Norton, A. J., Wheatley, P. J., West, R. G., et al. 2007, A&A, 467, 785
- Radigan (2014) Radigan, J. 2014, ApJ, 797, 120
- Radigan et al. (2012) Radigan, J., Jayawardhana, R., Lafrenière, D., et al. 2012, ApJ, 750, 105
- Radigan et al. (2014) Radigan, J., Lafrenière, D., Jayawardhana, R., & Artigau, E. 2014, ApJ, 793, 75
- Riaz et al. (2006) Riaz, B., Gizis, J. E., & Harvin, J. 2006, AJ, 132, 866
- Robinson & Marley (2014) Robinson, T. D., & Marley, M. S. 2014, ApJ, 785, 158
- Saumon & Marley (2008) Saumon, D., & Marley, M. S. 2008, ApJ, 689, 1327
- Schlawin et al. (2017) Schlawin, E., Burgasser, A. J., Karalidi, T., Gizis, J. E., & Teske, J. 2017, ApJ, 849, 163
- Scholz et al. (2018) Scholz, A., Moore, K., Jayawardhana, R., et al. 2018, ApJ, 859, 153
- Schwartz & Cowan (2015) Schwartz, J. C., & Cowan, N. B. 2015, MNRAS, 449, 4192
- Showman et al. (2018) Showman, A. P., Tan, X., & Zhang, X. 2018, ArXiv e-prints, arXiv:1807.08433
- Smith et al. (2008) Smith, R. M., Zavodny, M., Rahmer, G., & Bonati, M. 2008, in Society of Photo-Optical Instrumentation Engineers (SPIE) Conference Series, Vol. 7021, Proc. SPIE, 70210K
- Snellen et al. (2014) Snellen, I. A. G., Brandl, B. R., de Kok, R. J., et al. 2014, Nature, 509, 63
- Tan & Showman (2017) Tan, X., & Showman, A. P. 2017, ApJ, 835, 186
- Tan & Showman (2018) —. 2018, ArXiv e-prints, arXiv:1809.06467
- Tremblin et al. (2016) Tremblin, P., Amundsen, D. S., Chabrier, G., et al. 2016, ApJ, 817, L19
- Tremblin et al. (2019) Tremblin, P., Padioleau, T., Phillips, M. W., et al. 2019, ApJ, 876, 144
- Tsuji & Nakajima (2003) Tsuji, T., & Nakajima, T. 2003, ApJ, 585, L151
- Vos et al. (2017) Vos, J. M., Allers, K. N., & Biller, B. A. 2017, ApJ, 842, 78
- Wakeford et al. (2016) Wakeford, H. R., Sing, D. K., Evans, T., Deming, D., & Mandell, A. 2016, ApJ, 819, 10
- West et al. (2008) West, A. A., Hawley, S. L., Bochanski, J. J., et al. 2008, AJ, 135, 785
- White & Basri (2003) White, R. J., & Basri, G. 2003, ApJ, 582, 1109
- Wright et al. (2010) Wright, E. L., Eisenhardt, P. R. M., Mainzer, A. K., et al. 2010, AJ, 140, 1868
- Yang et al. (2015) Yang, H., Apai, D., Marley, M. S., et al. 2015, ApJ, 798, L13
- Yang et al. (2016) —. 2016, ApJ, 826, 8
- Zhou et al. (2017) Zhou, Y., Apai, D., Lew, B. W. P., & Schneider, G. 2017, ArXiv e-prints, arXiv:1703.01301
- Zhou et al. (2016) Zhou, Y., Apai, D., Schneider, G. H., Marley, M. S., & Showman, A. P. 2016, ApJ, 818, 176
- Zhou et al. (2018) Zhou, Y., Apai, D., Metchev, S., et al. 2018, AJ, 155, 132
- Zhou et al. (2019) Zhou, Y., Apai, D., Lew, B. W. P., et al. 2019, AJ, 157, 128
- Zuckerman et al. (2004) Zuckerman, B., Song, I., & Bessell, M. S. 2004, ApJ, 613, L65
Appendix A Contamination Model
To provide a quantitative estimate of the contamination, we use a model with three 1-D Moffat profile to fit the horizontally summed (sum of pixels of column 440-570 in Figure 1b, corresponding to the region of GU Psc b’s spectrum) pixel count rates of the GU Psc b, the nearby galaxy, and the reference star. The reduced chi-square from the model fitting is large ( 700) because of the significant deviation at the wing. Based on the best-fit Moffat profiles, the galaxy’s and the reference star’s flux in the eight-pixel wide shaded region is about 10% and 3% of the GU Psc b’s flux respectively. Contamination levels in the - and -bands are thus lower than 13% because GU Psc b’s spectral intensities are higher in these bands than the averaged intensity over 1.1-1.7. As mentioned in Section 3.1, the low contamination level () and the measured variability of the galaxy and reference star together suggests that the detected flux variation of GU Psc b is intrinsic.