Temperature-dependent fluorescence emission spectra of acrylic (PMMA) and tetraphenyl butadiene (TPB) excited with UV light
Abstract
Acrylic (poly(methyl methacrylate) or PMMA) is commonly used as a vessel to hold scintillating liquids in rare-event searches. Certain types of PMMA can fluoresce with a low efficiency at room temperature. We have investigated the fluorescence spectra under ultraviolet (UV) excitation of the PMMA used in the DEAP dark matter search at various low temperatures. Fluorescence of this PMMA is observed, with an increasing intensity as the sample is cooled from a temperature of 300 K down to 4 K. The common wavelength-shifter tetraphenyl butadiene (TPB) is also measured for use as a reference.
1 Introduction
Several rare-event search experiments use a scintillating target contained in support structures made from plastics. The DEAP-3600 experiment, for instance, uses an acrylic vessel to contain the liquid argon (LAr) target [1]. Acrylic, or poly(methyl methacrylate) (PMMA), has been reported to fluoresce at a low intensity when excited by ultraviolet (UV) light ([2] and references therein). The unexpected fluorescence of construction and support materials, even at a very low efficiency, could be a concern for those experiments that look for rare events at low energies. For this reason, we have previously investigated the fluorescence response of acrylic and polytetrafluoroethylene (PTFE) to vacuum UV photons from at room temperature [2]. These wavelengths span the range of LAr and LXe scintillation light, as well as the far UV and part of the mid-UV spectral range of Cherenkov light created within the acrylic. However, the samples were not measured at the corresponding cryogenic temperatures of (LAr) or (LXe), even though the luminescence of a material can depend on its temperature [3]. No fluorescence was observed, so [2] gives limits on the level of fluorescence of the measured samples at room temperature.
In view of a future comparison of the fluorescence of PMMA to a well-known reference, we have also measured the low-temperature spectra of the wavelength shifter 1,1,4,4-tetraphenyl-1,3-butadiene (TPB). TPB is commonly used to shift liquid noble gas scintillation light to the blue spectral range, so that it is easier to detect. In multiple experiments, such as DEAP-3600, is it used in combination with acrylic [1]. Therefore, it is a good reference for wavelength shifting efficiencies. In a first step toward characterizing the potential fluorescence of acrylic and PTFE at cryogenic temperatures, we have measured the response of acrylic to excitation photons at temperatures from down to .
2 Samples, Procedures and Set-up
The principle of these measurements was to excite the samples with continuous light and measure their fluorescence emission spectra at temperatures from . Since the UV photons do not penetrate far into the material, the treatment of the surface can have a large effect on the fluorescence response. Furthermore, the response can be modified by impurities, additives, and by the conditions under which the material was machined or otherwise treated. Therefore, we use a sample of acrylic from the same batch the DEAP-3600 acrylic vessel was made from. The sample is the same as that described in [2] as ‘RPT acrylic,’ supplied to the DEAP-3600 Collaboration by Reynold’s Polymer Technology. The TPB sample was vacuum evaporated onto a piece of generic acrylic of the same size as the RPT acrylic sample. The thickness of the deposited TPB layer was measured to be .
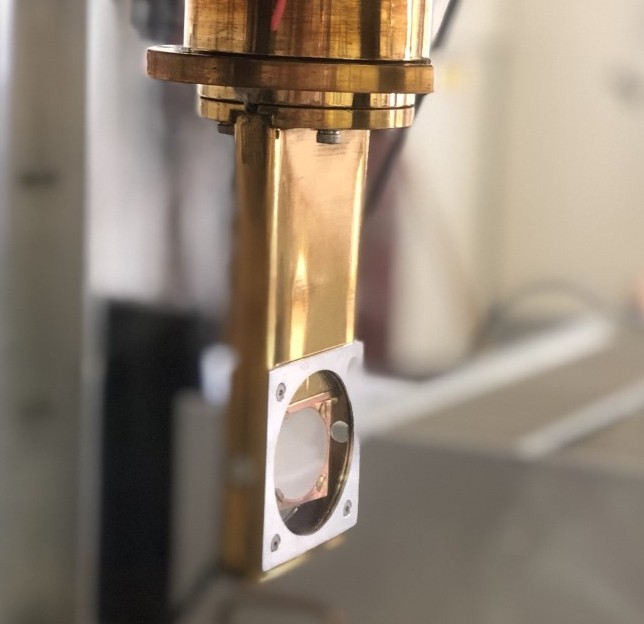
The samples were installed into a custom copper sample holder which rotated the sample approximately , relative to the incoming light beam, around the vertical axis. The holder was then attached onto the cold finger of the cryostat, as shown in Figure 1.


The cryostat is closed-cycle, with a compact optical geometry to optimize light-collection efficiency [4]. The cold finger is enclosed within a vacuum shroud and two radiation shields. The sample can be viewed from the outermost shroud through a corresponding series of Spectrosil 2000 fused silica windows, which have more than 90% transmission at the wavelengths of interest [4].
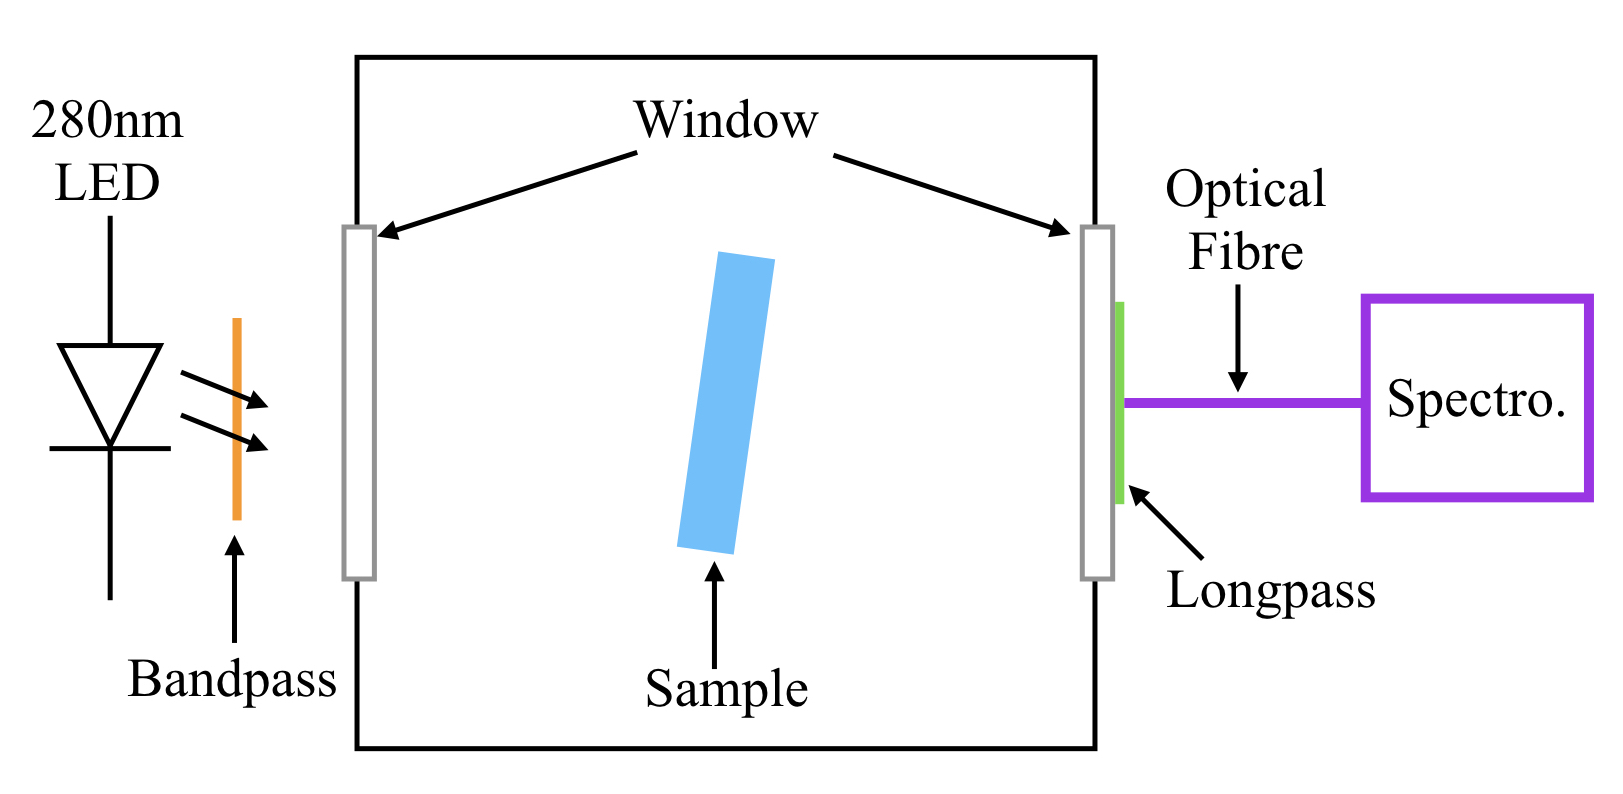
A schematic of the experiment is shown in Figure 1. A commercial LED was attached to the side of the outer cryostat chamber. When the TPB-coated sample was installed, the LED was shining onto the coated surface; when the RPT acrylic sample was installed, the LED was shining onto the smoother finished surface. The LED was powered in direct-current (DC) mode, and used with an Edmund Optics Hard Coated bandpass filter to ensure that only monochromatic light reached the samples. We used the Horiba Scientific Symphony II CCD Detector and MicroHR Automated Imaging Spectrometer for spectral imaging. The optical fibre of the spectrometer was attached to the opposite window of the outer chamber, facing the opposite surface than the LED was shining onto. A longpass filter made of transparent, UV-absorbing (UVA) acrylic was installed in front of the optical fibre, to eliminate any UV light that may have reached the fibre’s position through or around the sample.
The optical cryostat was put under vacuum for all measurements. An external CryoCon 24 temperature controller system was used to set and monitor the cold finger’s temperature. All external components were at room temperature. Spectra were taken in descending order through temperatures , (LXe), (LAr), and .
3 Analysis and results
Spectra from the sample were corrected for the spectrum from a dark exposure of equal exposure time. The scanning range of one window of the spectrometer is approximately , so multiple windows were recorded at each temperature to scan from the approximately to the near infrared.
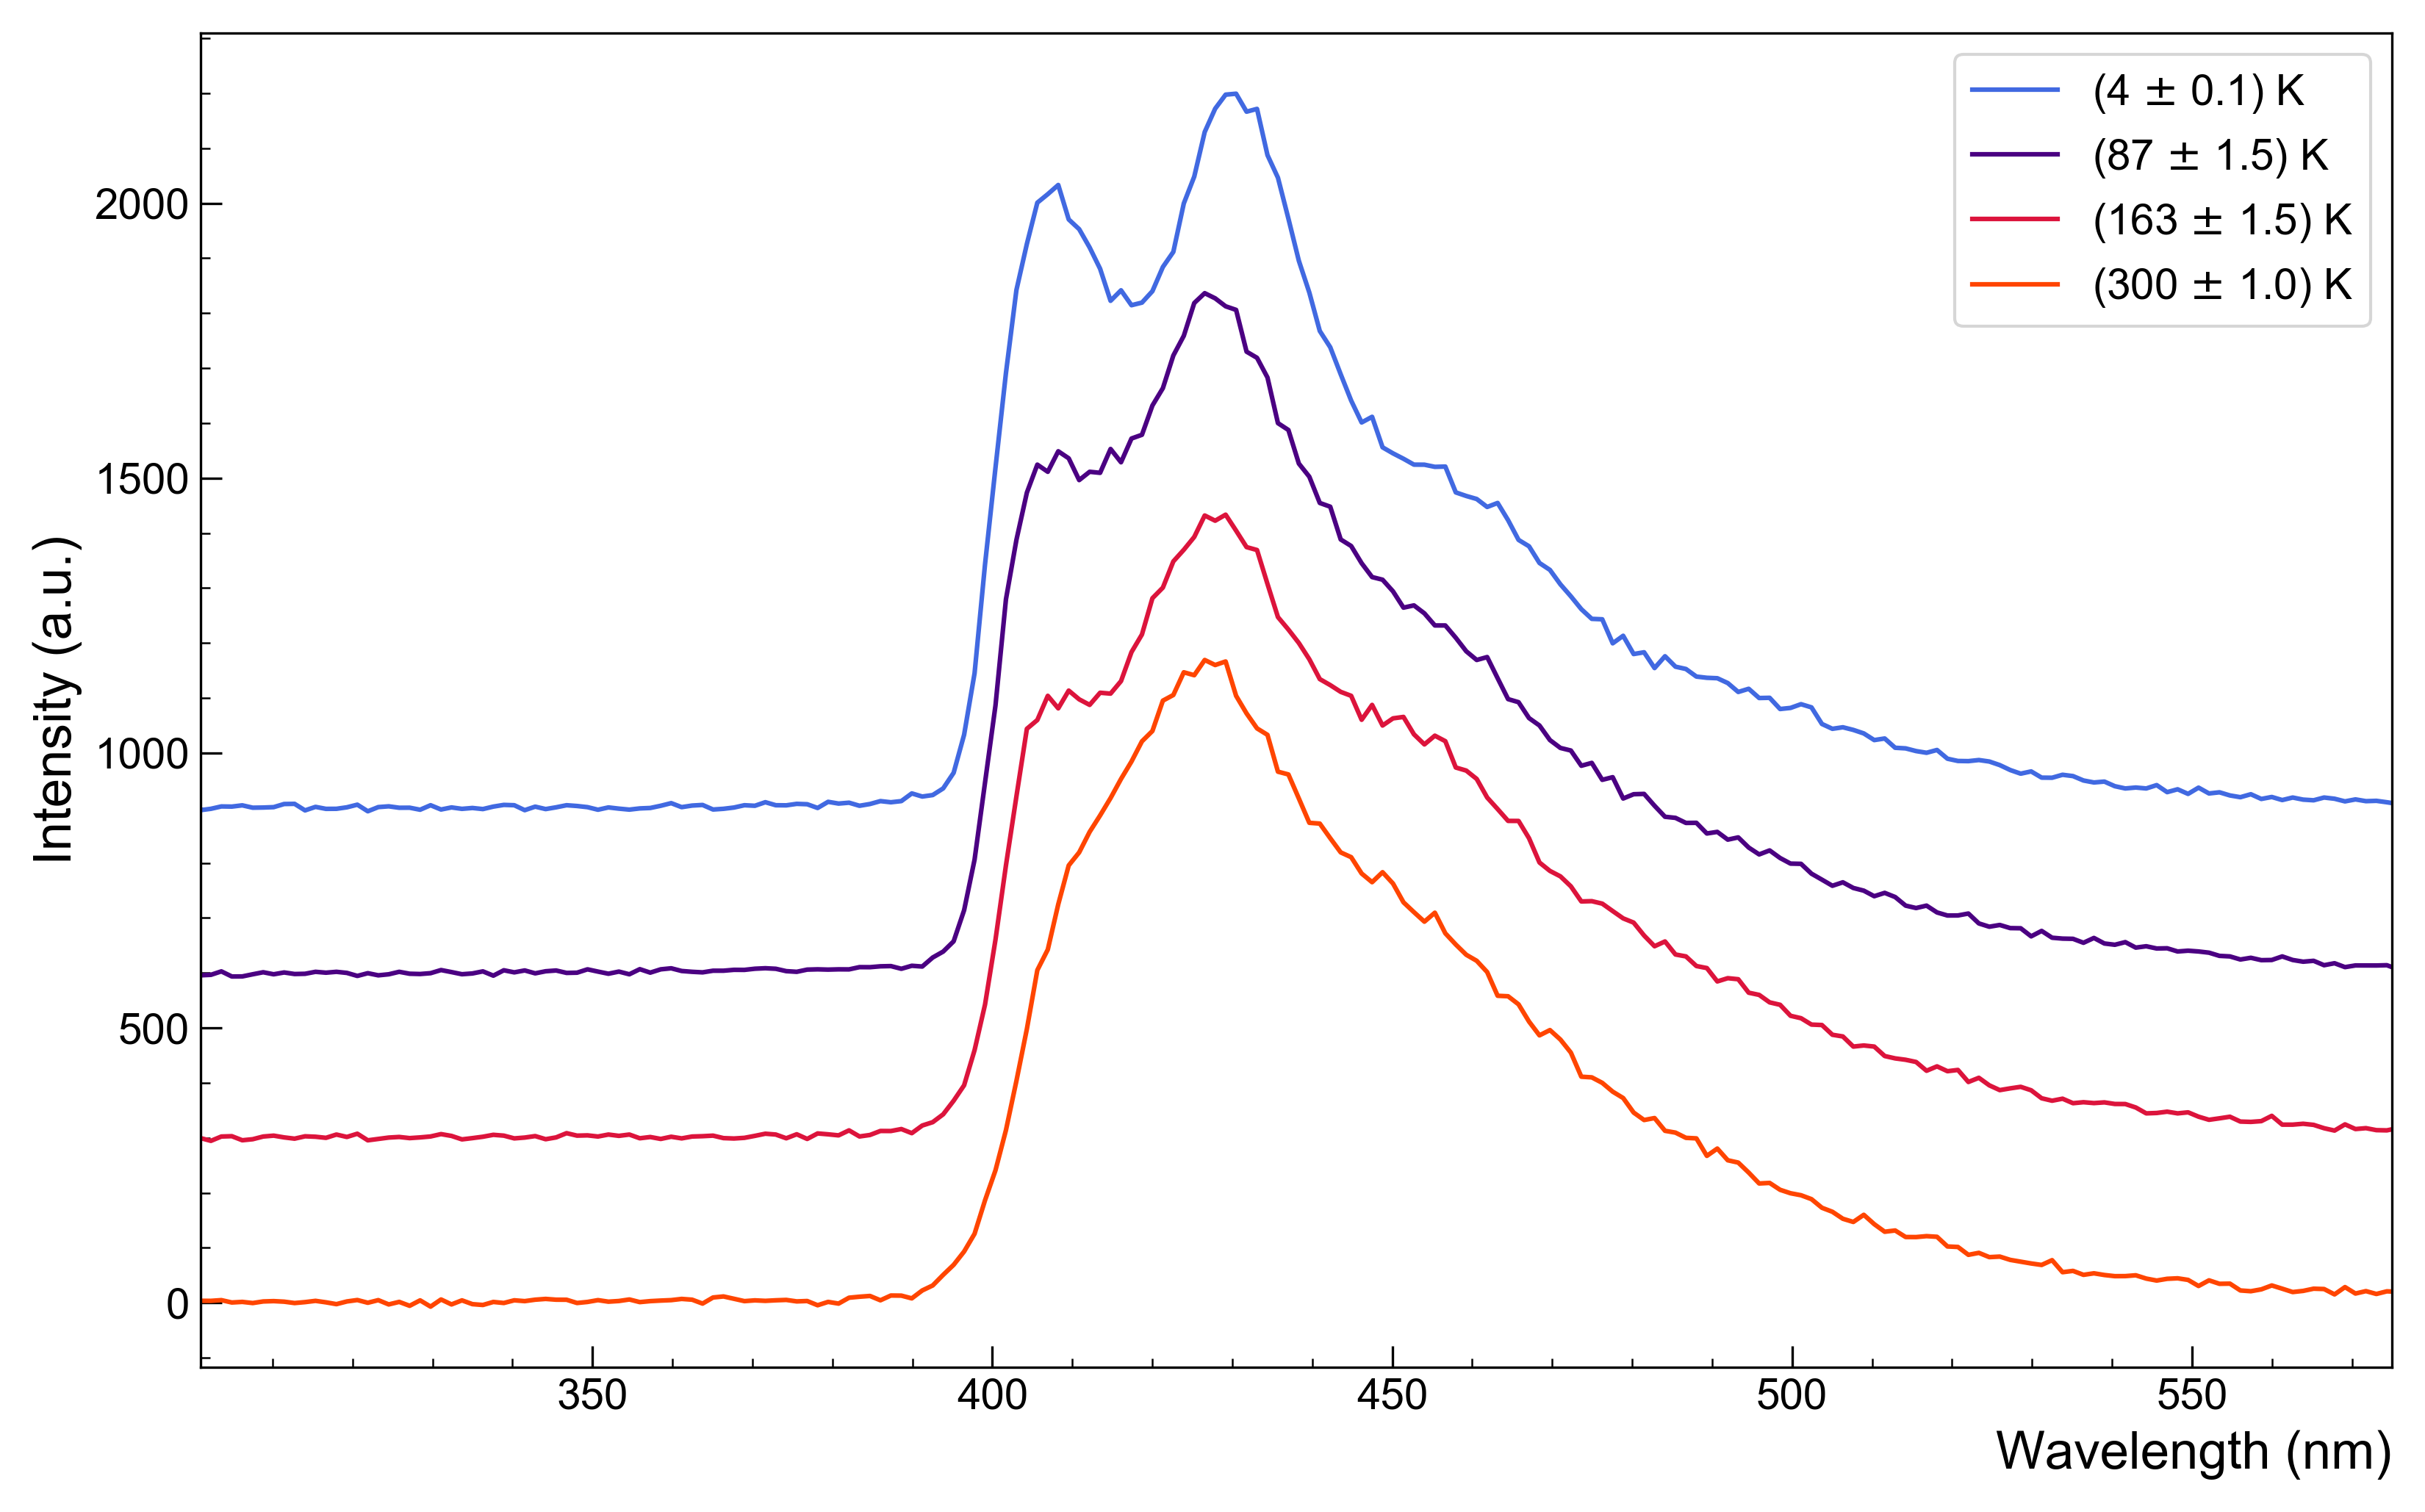
Figure 2 shows the spectra of TPB over all measured temperatures. The intensity shows an mildly increasing trend from over the main emission peak from . An additional peak not seen at room temperature, at approximately , also increases as temperature decreases. This feature has been seen in previous measurements of TPB films down to LAr temperature, and has been attributed to vibrational structures in the molecules [5].

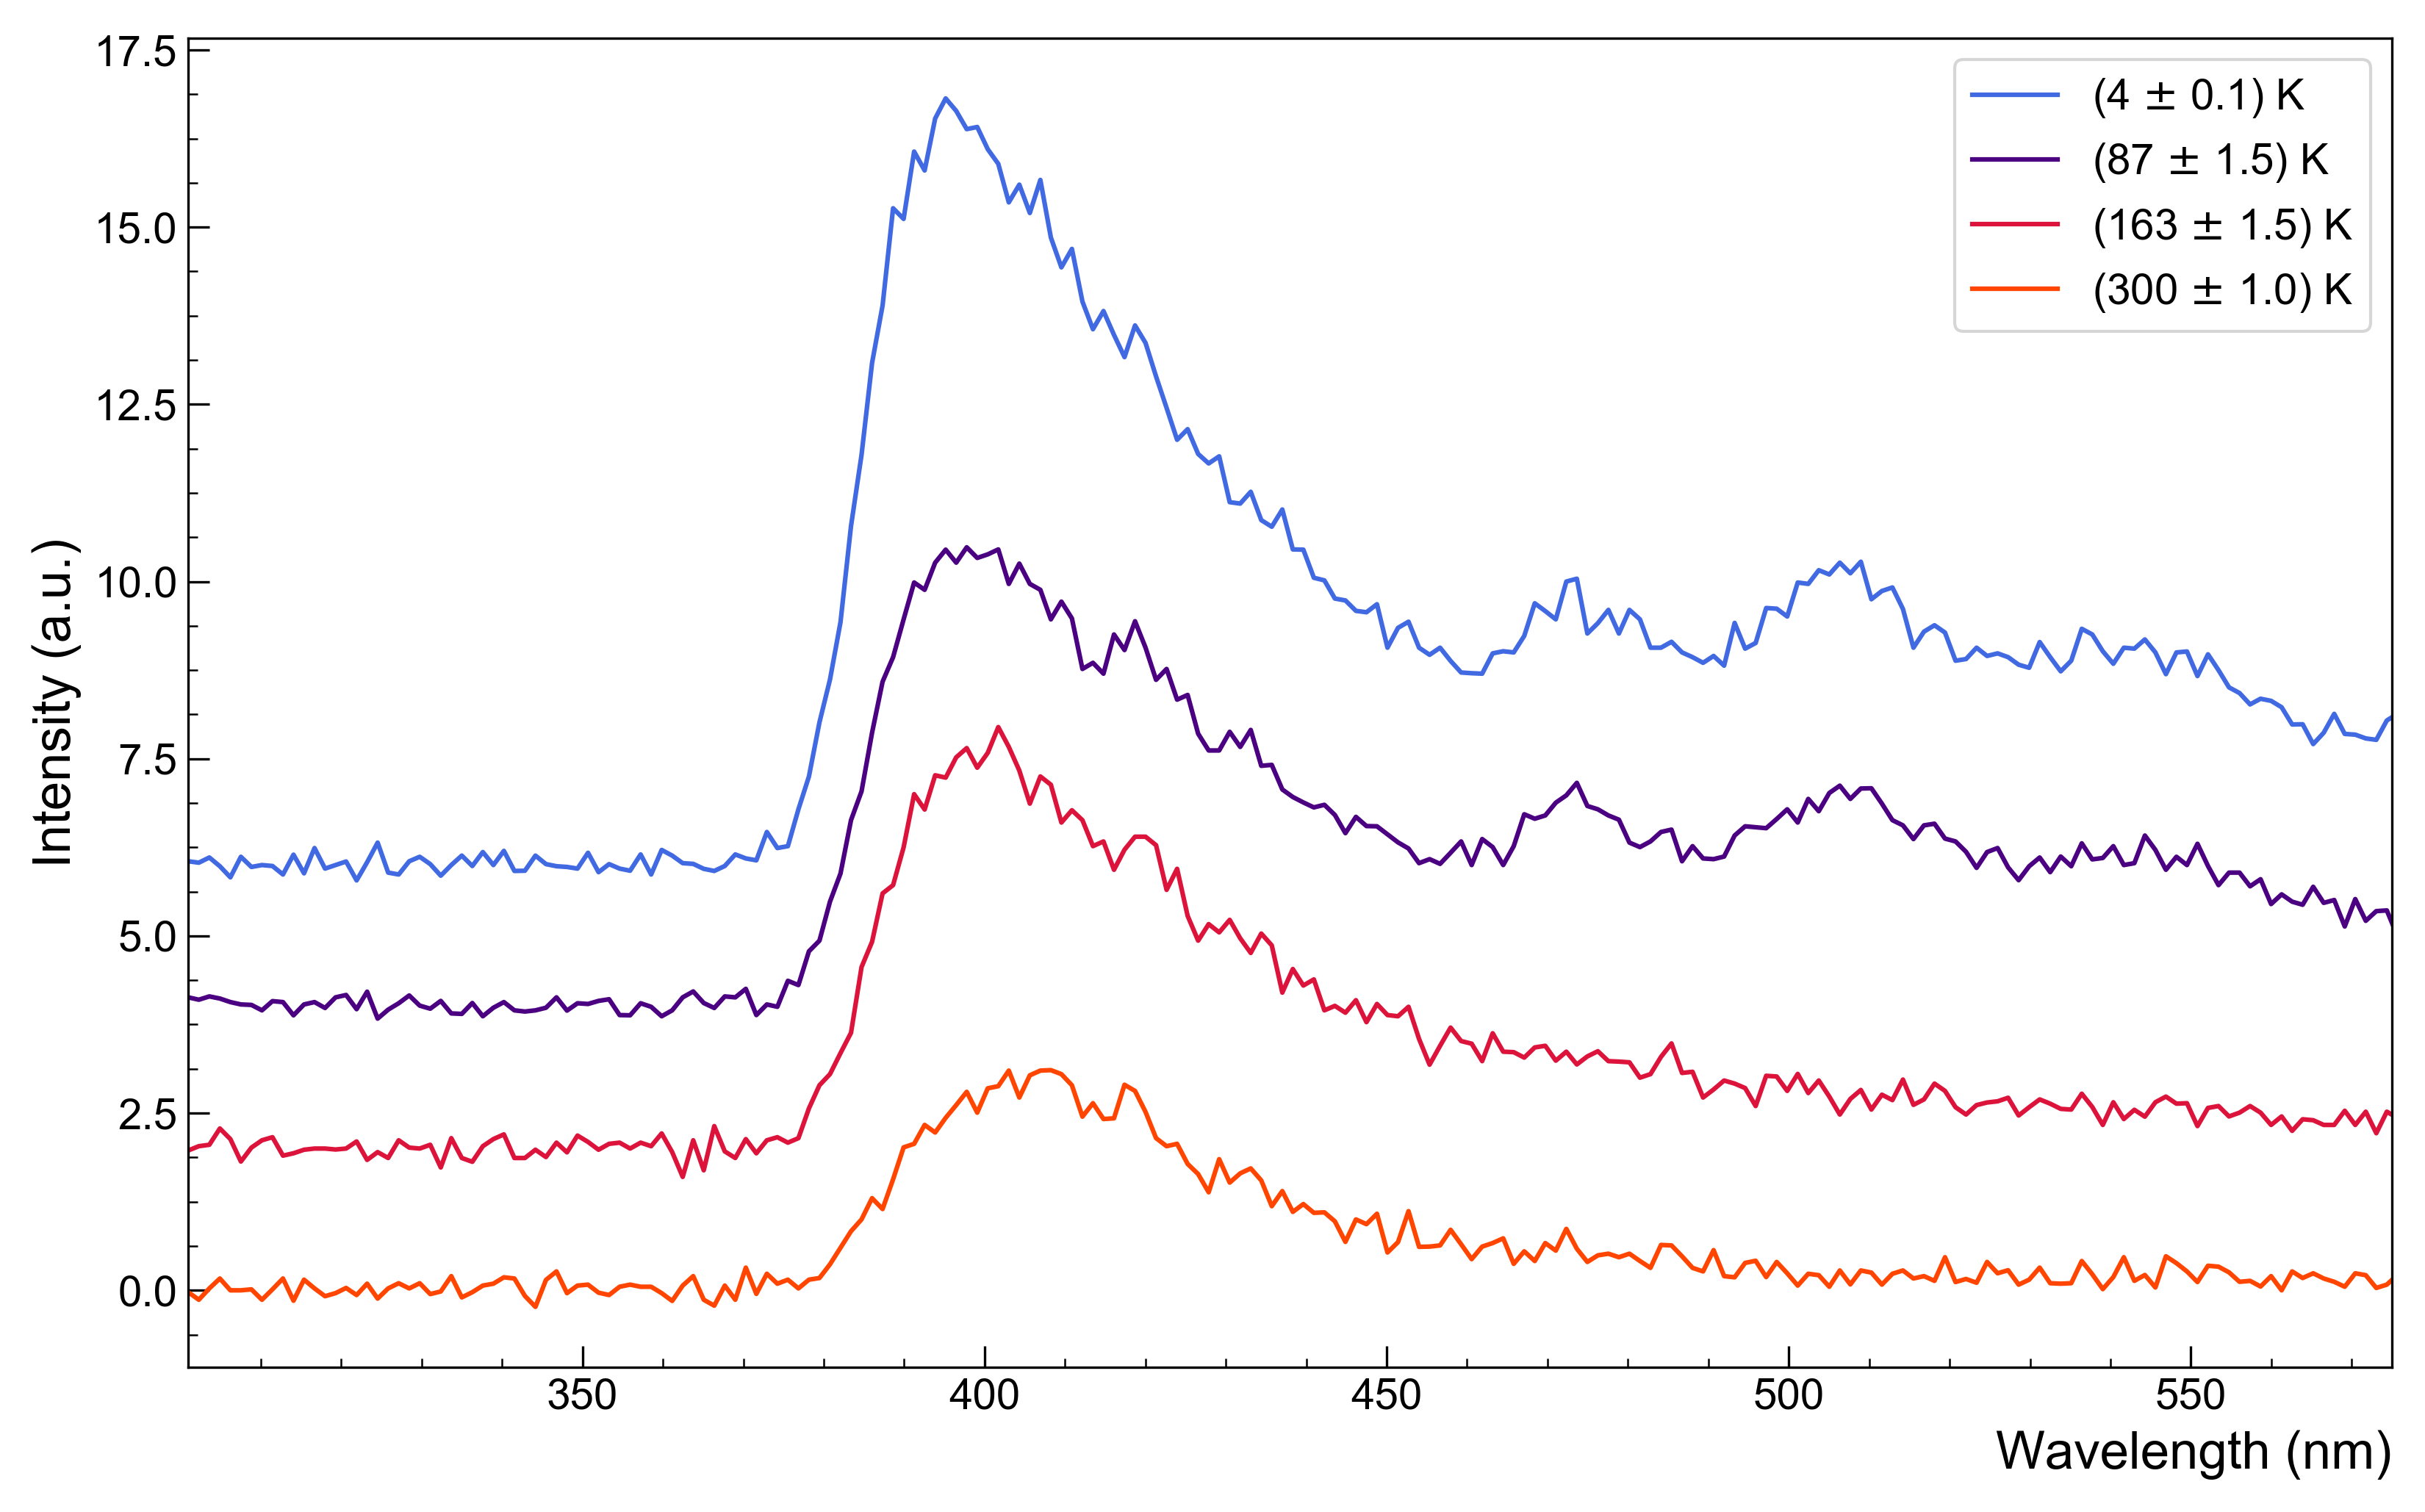
The emission spectra of RPT acrylic are shown in Figure 3. We detect visible fluorescence light from the sample well above the noise level of the spectrometer between approximately and , and at a lower level over . On the shorter-wavelength side, the structure may be cut off by the longpass filter. The intensity of the emission feature increases as the temperature decreases, particularly in the main emission peak around . A dedicated room-temperature measurement was carried out with and without the acrylic sample which confirmed that the fluorescence originates from the sample, as opposed to other components of the setup.

4 Conclusion
We measured the temperature-dependent emission spectra of TPB and RPT acrylic excited with light. The TPB spectra are consistent with previous results at higher temperatures [5], showing more clearly the vibrational structures at decreasing temperatures. The fluorescence emission spectrum of this batch of acrylic at low temperatures was measured for the first time, and its intensity increased as temperature decreased. This effect could be due to the decrease of non-radiative transitions at low temperatures, or decrease of quenching of fluorescence [6].
On the usage of acrylic in a detector for rare-events, this fluorescence can shift UV Cherenkov light produced in acrylic to the visible range. Since the UV part of the Cherenkov spectrum is not otherwise transmitted through the acrylic to be detected by the light sensors, this wavelength-shifting response must be included in detector Monte-Carlo simulations to accurately model the detector and expected backgrounds.
Fluorescence in response to UV light from a KrCl excilamp has been reported in acrylic samples previously [7]. The spectrum of the emission feature from [7] does not match the spectrum indicated here. This may be an indication that the fluorescence is dependent on the excitation wavelength or the batch of acrylic.
In future work, we will quantify the fluorescence of acrylic relative to TPB and study its time structure, by using a photomultiplier tube in place of a spectrometer. We also plan to measure the fluorescence response of PTFE, as well as the response of both acrylic and PTFE at cryogenic temperatures and under excitation with photons down to .
Acknowledgments
We thank Marcin Kuźniak from AstroCeNT for providing the DEAP acrylic samples and Jochen Wieser from Excitech GmbH for the plasma cleaning of the samples. This work has been funded in Canada by NSERC, CFI-LOF and ORF-SIF, as well as by the McDonald Institute.
References
- [1] DEAP Collaboration, P.A. Amaudruz, M. Baldwin, M. Batygov, et al., Design and construction of the DEAP-3600 dark matter detector. Astropart. Phys. 108:1–23 (2019)
- [2] Araujo, G.R., Pollmann, T. & Ulrich, A. Photoluminescence response of acrylic (PMMA) and polytetrafluoroethylene (PTFE) to ultraviolet light, Eur. Phys. J. C 79:653 (2019). arxiv: 1905.03044.
- [3] Veloce, L. et al. Temperature dependence of alpha-induced scintillation in the 1,1,4,4-tetraphenyl-1,3-butadiene wavelength shifter, J. Instr. 11:P06003 (2016). arxiv: 1511.08424.
- [4] Verdier, M.-A. A 2.8 K cryogen-free cryostat with compact optical geometry for multiple photon counting, Rev. Sci. Instrum. 80:046105 (2009).
- [5] Francini, R. VUV-Vis optical characterization of Tetraphenyl-butadiene films on glass and specular reflector substrates from room to liquid Argon temperature, JINST (2013). arXiv:1304.6117.
- [6] B. Valeur, M.N. Berberan-Santos, Molecular Fluorescence, 2nd edn. (Wiley-VCH, 2012), sec. 3.2.3
- [7] V.F. Tarasenko, E.K. Baksht, A.G. Burachenko, D.V. Beloplotov, A.V. Kozyrev, Luminescence of polymethyl methacrylate excited by a runaway electron beam and by a KrCl excilamp. IEEE Trans. Plasma Sci. 45(1):76–84 (2017)