Origin and structure of liquid crystalline Blue Phase III
Abstract
We report here an off-lattice NVT molecular dynamics simulation study of a system of polar chiral ellipsoidal molecules, which spontaneously exhibits Blue Phase III (BPIII), considering coarse-grained attractive-repulsive pair interaction appropriate for anisotropic liquid crystal mesogens. We have observed that suitable selection of chiral and dipolar strengths not only gives rise to thermodynamically stable BPIII but novel Smectic and Bilayered BPIII as well. Further, we have demonstrated that the occurrence of BPIII and its layered counterparts depend crucially on molecular elongation.
1 Introduction
Chiral liquid crystals, in addition to broken rotational and translational (optional) symmetries, belong to the symmetry group that lacks reflection symmetry. Chiral liquid crystal molecules exhibit translationally disordered cholesteric phase where the nematic director precesses about the helical axis. The isotropic-cholesteric phase transition can go through a cascade of intermediate Blue Phases (BP), which have drawn widespread interest in recent technological and biological fields of research. Experimental evidences [1, 2, 3, 4] indicate that though the BPI and the BPII possess cubic structure for the double-twist cylinders, BPIII, the so-called ‘blue fog’ [3, 5], seems to be amorphous. Apparently, the BPIII does not exhibit Bragg scattering [6] whereas it is attributed with strong optical activity along with thermodynamic stability but is lacking birefringence and having mechanical properties more like isotropic phase. Among chiral phases, the origin and structure of the BPIII phase still remain as a long-standing puzzle, despite extensive endeavour [1], because experimental explorations have been very much hindered by the occurrence of the BPIII phase in an extremely narrow temperature (or other factors affecting phase transitions) interval and optical effects are manifested only at very short wavelength range.
There are theoretical studies on the structure of the BPIII proposing that it is a quasicrystal [6, 7]. Others conclude that BPIII is an amorphous phase having ‘spaghetti’ like arrangement of double-twist cylinders (DTCs) [8], or could be a metastable state [3]. Electron micrograph experiments support an amorphous structure and thus eliminate the quasicrystal theory. A recent computer simulation study provides evidence that the structure of BPIII is basically an amorphous network of disclinations [9]. Theoretical [1, 7, 8, 9] models proposing amorphous ‘spaghetti’ like arrangement of double-twist cylinders and amorphous network of disclinations helped in determining phase properties. However, a complete understanding of these behaviours requires the information depicting molecular arrangement at the microscopic level responsible for giving rise to the BPIII, which is yet to be achieved. In the present work, we have considered systems composed of molecules interacting through chiral, dipolar and attractive-repulsive van-der-Waals’ type interactions. In this Molecular Dynamics simulation study, a microscopic structure resembling BPIII phase and its layered and novel bilayered counterparts have been realized. We also have found that molecular elongation has supported more efficient self-assembly, thus has acted as a stimulating molecular feature to widen stability region. Additionally, the study of the chain-length size [10] of the chiral molecules is important for many technological devices [11, 12, 13], lipid bilayer cell-membranes [14], chiral drugs [15], and physiological aspects [16].
2 Model and Computational Details
A coarse-grained model of a polar chiral molecule having prolate ellipsoidal shape (figure: 1a) has been used in this NVT Molecular Dynamics study [17, 18]. In this work, the pair potential acting between two such molecules and has been taken as [20, 19],
| (1) | |||||
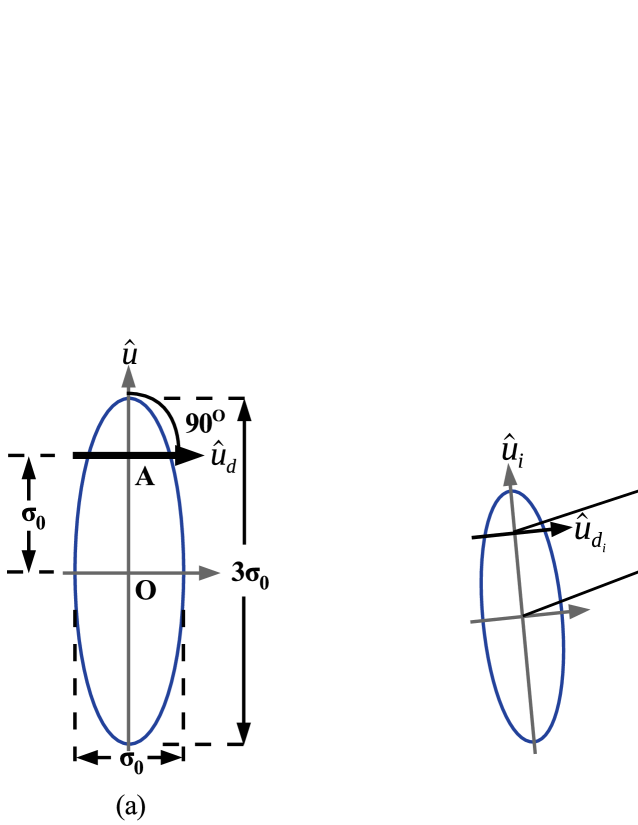
The first, second and third terms in equation 1 represent the chiral, dipolar and Gay-Berne [21] interactions respectively. Here, is the separation between the centers of mass of the molecules and ; and represent the orientations of the molecular long axes of respective molecules with respect to the laboratory axes (figure: 1b).
Here is the chirality strength parameter and the handedness of the twist depends on its sign. The form of the chiral interaction potential (first term in equation 1) used in our study can directly be obtained from the multipole expansion of electrostatic interaction [22]. To incorporate the ellipsoidal shape of the molecules the orientation dependent well-depth term and separation term have been taken as of Gay-Berne type [21], where is the contact distance i.e. the minimum approachable distance between two molecules. corresponds to the contact distance at side-by-side ( and , ) configuration which is also the breadth of the molecule. The term induces a twist giving rise to chiral phases.
The second term in equation 1 is the dipolar interaction term. The polar part of a molecule has been represented by a single terminal point dipole (figure: 1a), positioned at distance from one terminal point of a model molecule. The orientation of the dipole has been fixed at an angle of relative to the molecular long axis [19]. Here, is the separation between the point dipoles fixed at two molecules and (figure: 1b), and are their respective orientations relative to the simulation box; ‘’ suffix corresponds to the dipole. The dipole moment vectors of respective point dipoles are and where is the magnitude of the dipole moment in reduced unit, is the well-depth for a pair of molecules in side-by-side configuration. The long-range correction of the dipolar interaction has been taken care of by standard Reaction Field technique [23, 24, 25]. In this technique, a sphere of a cut-off radius is considered around a particular molecular dipole and all the dipoles outside this cut-off sphere are considered to form a dielectric continuum of dielectric constant , which produces a reaction field inside the sphere. The intensity of the reaction field applied on -th molecule is given by [17],
| (2) |
In our study, the values of cut-off radius and continuous dielectric constant have been taken as the cubic simulation box side-length and [26] respectively.
The GB parameters [length to breadth ratio], [well-depth ratio ; and being the well-depths in the side-by-side and end-to-end (; , ) configurations respectively] and the relative well depth controlling parameters and have been taken as , , and respectively [27]. Potential cut-off radius () has been taken as equal to the half of the simulation box-length. To minimize computation time we have considered cut-off distances the same for both GB and chiral interactions. However, both the potential functions have been smoothed out at the cut-off boundary by shifting them by the amount [17].
We have used a Leap-Frog algorithm [28] for Damped Force method (Hoover’s thermostat [29]) to solve the equations of motions in this NVT-Molecular Dynamics (MD) simulation study [17] which is applicable for the molecules having both translational and rotational degrees of freedom. Scaled density has been set to for [27, 26]. is the total number of molecules and is the simulation box volume. For each system, a well equilibrated isotropic phase has been used as the initial configuration and then the scaled temperature (, Boltzmann constant) has been decreased gradually to study the phase change. For a particular system at each temperature step, the initial configuration has been a previous higher temperature equilibrium phase and simulation run of steps has been performed to obtain the equilibrium configuration at that temperature. To meet equilibrium criteria, at each MD step, the average energy of the system has been calculated keeping its variation with MD steps within Root Mean Squared fluctuation about a mean value at equilibrium. Average values have been calculated from the next steps after equilibration. As the twisted cylindrical domains remain oriented at random in the BPIII, so they have no biasing in twist directionality, we have used conventional cubic periodic boundary condition. In our MD simulation, the force and torque equations for all the molecules have been solved through the Leap-frog Verlet integrator method to follow the real trajectory of the system in phase space. For this reason, MD simulation is much expensive computationally [30, 31]. To understand the phase structure of polar chiral liquid crystal molecules, we have used an NVT algorithm in this work which is developed by us and used in our earlier works [32, 19].
3 Results
For characterization of the phases, several distribution functions have been computed which have supported the formation of Blue Phase III (BPIII). To check system size effect we have simulated system sizes corresponding to and some results for . The results have shown qualitatively similar phase sequence behaviour, though stabilization of a particular phase occurs at a different range of scaled temperature, usually shifted to a lower value for larger system size, which has been due to the finite size effects. In this paper we have presented the results of the system sizes and . For all the system sizes with , phase properties have been studied for some selected discrete values of the chiral strength parameter . The value of the reduced dipole moment has been set fixed at a typical value of [19]. For & , Blue phases have been generated from a higher temperature isotropic phase (at ) by decreasing temperature. To find out the orientational correlations between the molecules, longitudinal orientational correlation functions [33] and have been calculated as functions of the intermolecular separation (in units of ) measured along a reference axis and further scaled by a distance which was related to the periodicity of the phase studied in Ref. [20]. Here, these functions have been calculated considering minimum image convention and taking the reference axis along one of the simulation box axes and the simulation box-length as the scaling length . The mathematical forms of these functions are given by,
| (3) | |||||
| (4) |
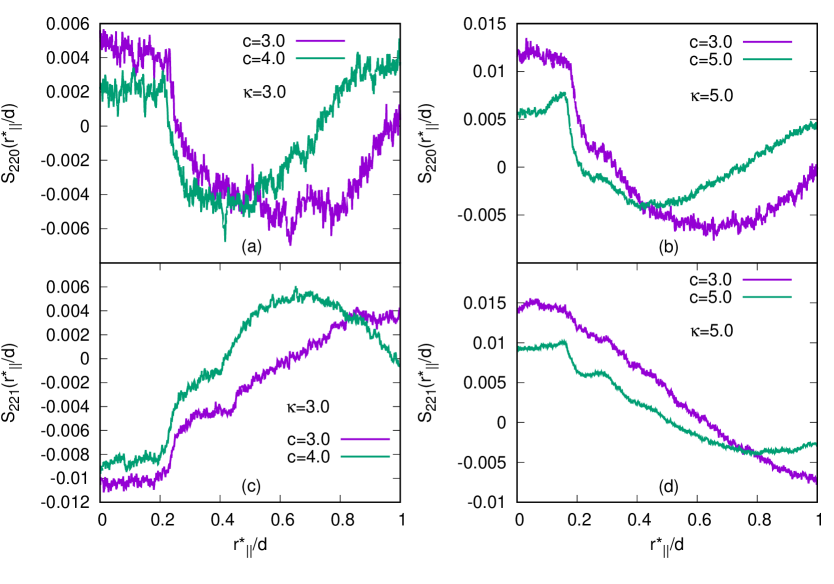
where indicates the average over all molecular pairs separated by a distance along the chosen reference axis. Here, the function has a maximum for two parallel molecules, whereas, the function has an extremum for two side-by-side molecules with angle between their long axes and thus both help characterizing the chiral phases. The plots of and (figure 2) show qualitatively the same variation as that of a Blue phase, i.e. depending on pitch length they vary approximately as sinusoidal functions with distance [19, 20] but the plots are not smooth, because in BPIII cylinders formed from twisted molecular arrangements are themselves twisted and are having comparatively shorter lengths, but in other Blue phases twisted molecular organization makes double-twist cylinders with straight-line symmetry axes spanning over the whole system. For other chiral phases obtained with lower values, these plots were quite smooth and showed sinusoidal type variation [19, 20] indicating the presence of definite orientational correlation between the molecules spreading over the whole simulation box.
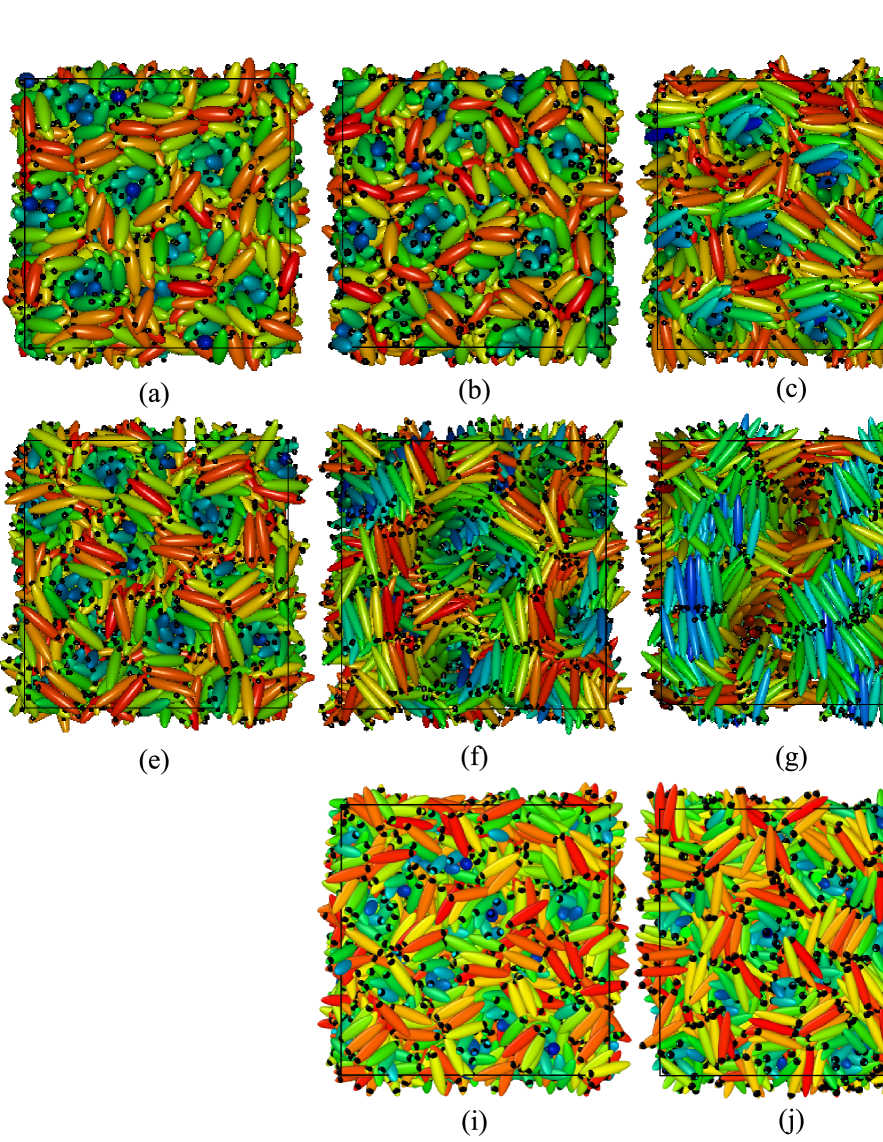
In this case, with relatively higher values of , the presence of a typical variation of the orientational correlation functions with molecular separation indicates that the obtained phases are not isotropic or nematic, but a chiral one, as isotropic plots show no orientational correlation at all whereas a perfect nematic phase gives almost a straight horizontal line of high correlation value with almost no variation showing a strong parallel orientational correlation between all the molecules. The plots indicate these phases are not like cholesteric, BPI or BPII [19, 20], but have a different blue phase character originated from chiral molecular organization packed within short size twisted cylindrical arrangements. Snapshots of the configurations of these phases with different and values are presented in figure 3.
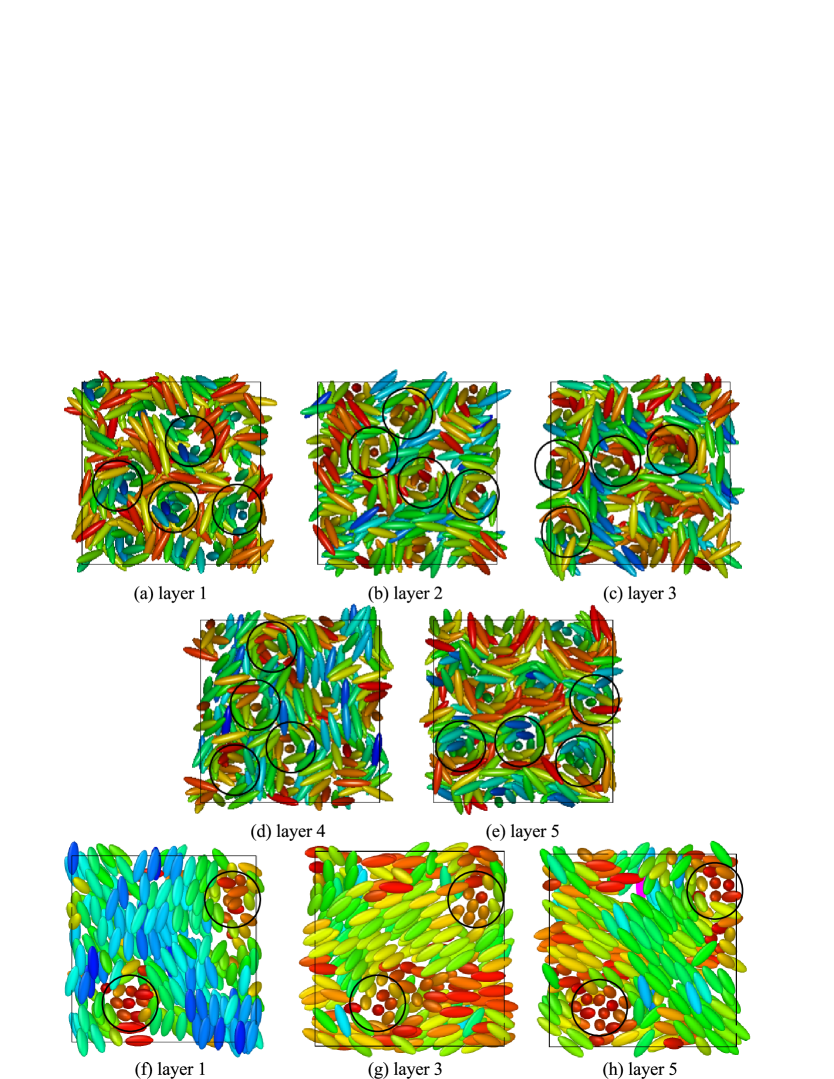
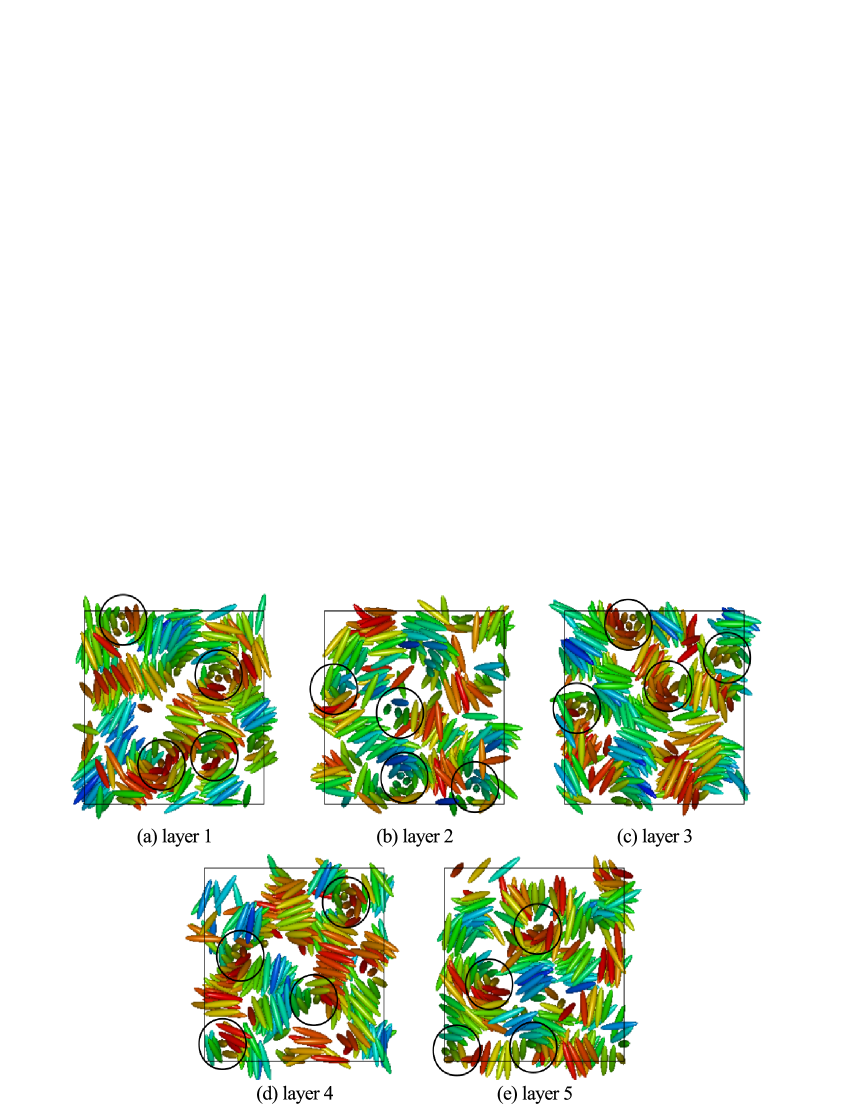
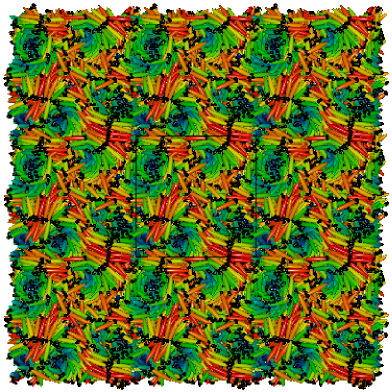
Snapshot of a typical configuration obtained for , is shown in figure 3a. Here in the case of BPIII these cylinders themselves are seen twisted in a random fashion. Careful observation of the configurations obtained in these cases reveals that the double-twist cylinders are not extended straight from a box face to the opposite face which occurs in case of other BPs. Snapshots depicting the configurations within five consecutive layers of same thickness perpendicular to one box axis are provided in figures 4(a)-(e), where circles are drawn to show the cross-sections of some of the double-twist cylinders. In figures 4(a)-(e) shifting of the cylindrical cross-section positions in different planes indicates cylinder twist in BPIII. Figures 4(f)-(h) show that the encircled cross-sections of the double-twist cylinders for BPI phase, obtained with lower value of [19], are at same positions on each layer. Thus, in case of other BPs, i.e. for BPI or BPII, double-twist cylinders go straight from one face to the opposite face of the simulation box [19, 20], whereas here these BPIII cylinders terminate at some intermediate plane instead of spanning over the whole box.
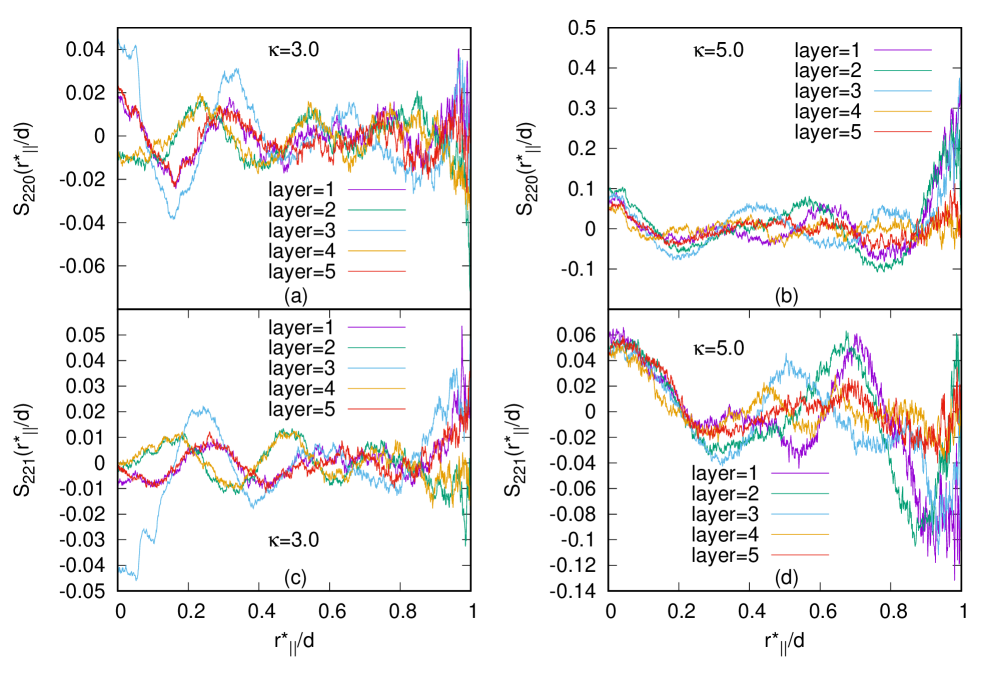
To study length dependence, we have considered (length to breadth ratio) and in addition to the previous case. Values of for different ’s have been taken equal to for and for . Again, like for both and , to check chiral strength effect, we have simulated these three systems keeping and values respectively. Unlike the blue phases I and II, the double-twist cylinders here in each case are not straight, but they are tangled, as seen from the configurations. Also, at a higher value of , stable equilibrium blue phase has been realized at a higher value of the scaled temperature . As for example, for systems with and , the typical values of at which equilibrium Blue phases have been obtained are for , for and for . For further investigation, the simulation box has been divided into some planar layers perpendicular to one of the simulation box axes and then and have been calculated for all the planes separately, considering along one of the simulation box axes parallel to the planes. Plots of these functions (figure 5) show multiple peaks, not coinciding at same points for all of the layers, but they are at different points for different layers, indicating the fact that the cross-sections of the double-twist cylinders in all planar layers are not at same positions. The number of peaks is more for higher values of showing lower pitch values (figure 6). This indicates that the number of double-twist cylinders increases with the increase in the chiral strength parameter . These double-twist cylinders are found to be intertwined to form spaghetti-like structures [8] as speculated for BPIII.

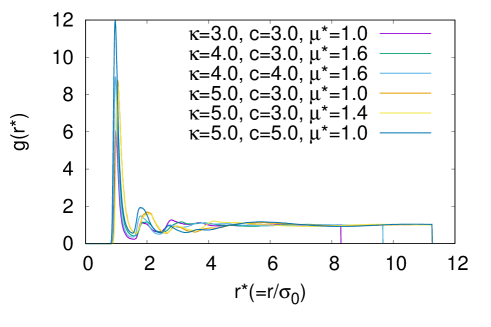
With further decrease in temperature, the formation of smectic layers has started to develop in addition to the orientational arrangement of the BPIII phase. For a system with a higher value of , smectic layers have started forming more efficiently at a relatively higher value of the scaled temperature. As for example, for systems with and , the typical values of at which equilibrium phases with smectic domains have been obtained are for , for and for . Smectic domains are more prominent with higher values, i.e. for the systems with higher molecular lengths like and , rather than . Snapshots of the configuration obtained with are presented in figure 7 dividing the simulation box into five planar layers perpendicular to -axis for visualization of the twist of the double-twist cylinders across the planar layers and formation of layered domains. The plots of the pair distribution function ( is the scaled intermolecular separation ) for these phases (figure: 8), at respective scaled temperature at which these smectic phases are stable, show short range positional order without any long range positional order.
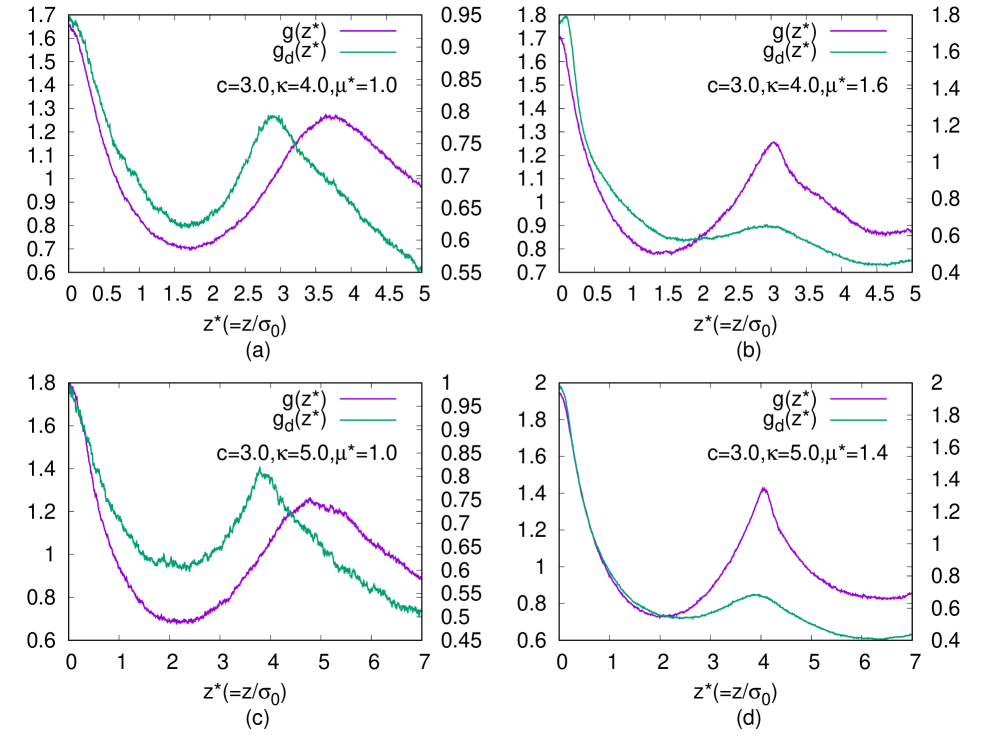
Additionally, we have checked the effect of dipole strength on the layer formation [19, 32]. The presence of dipoles gives more stability to the smectic layers. Interestingly, for a higher value of novel bilayered smectic BPIII (figure 3d and 3g) has formed, by decreasing temperature from a relatively higher temperature phase. For a system with and , by decreasing the scaled temperature from to bilayered arrangement in the smectic domains has formed where and (fig: 3d), whereas in a system with and (fig: 3g) decreasing the temperature from to bilayered arrangement has formed in the smectic domains. For formation of the bilayer is not so prominent. Plots of and (where the former is the pair correlation function for the molecular centers of mass as a function of the projection () of separation vector along the axis of a cylindrical domain considered around each molecule and the latter is the same for dipolar positions) have been drawn (figure 9) by calculating in the same fashion as plot. Thus, (where is the radius of the cylindrical sampling region) and has been calculated in the same way for the dipolar positions considering cylindrical domain of the same size. The peaks of the function indicate the presence of the molecular centers of mass in planar layers perpendicular to the symmetry axes of the cylindrical sampling regions and similarly, the peaks of the function indicate the presence of the dipolar positions in similar planar layers. For (figure 9a and 9b) cylindrical domain of length and radius has been taken. Those values for (figure 9c and 9d) are and respectively. For both the values, the peaks of comparable heights for both the functions occur at nearly same positions for lower values of (figure 9a and 9c) indicating non-bilayer arrangements, but when the value of increases the peaks of comparable heights for occur alternately with the peaks of (figure 9b and 9d) indicating the presence of small bilayered smectic domains in the BPIII. Due to the smaller size of the smectic domains, we have obtained fewer peaks in these plots. A snapshot of the bilayered BPIII is presented in figure 10 by periodic repetition of the simulation box, where bilayered domains can be identified with the dipolar ends of the molecules (shown in black dots) of two adjacent smectic layers clustered together.
4 Conclusion
Chirality, which is a very important phenomenon occurring in various fields of nature, when added to liquid crystal systems generates many phases featuring fantastic and remarkable properties and having wide applicability in technology, medical science, agriculture and chemical industry. Blue phases are one of this kind. While other liquid crystalline phases have rotational and translational symmetries, chiral Blue phases (BP), the so-called ‘crystalline liquids’, have additional symmetries of conventional solid crystals i.e. cubic crystal symmetries. Being a member of liquid crystal family, this property of BP makes them interesting both as a curious subject for scientific studies and a material of immense potential for industrial use. Theoretical and computer simulation studies on BPI and BPII have proposed that for relatively high chiral strength, the simple helical structure of the cholesteric phase is energetically less stable locally than a ‘double-twist cylinder’ structure. In a double-twist cylinder, local directors rotate simultaneously about any radius of the cylinder and the local director is parallel to the cylinder symmetry axis at its center. Such double-twist cylinders do not fit in three-dimension to fill the whole space and thus disclinations or defects are formed. Among three types of BP observed experimentally without electric field, in BPI, the arrangement of these disclinations is body center cubic and in BPII is simple cubic. However, BPIII, the so-called ‘blue fog’ [5], is amorphous, the structure of which is not very clear till date. Our simulation work supports the theoretical proposition of the ‘spaghetti’ like arrangement of the double-twist cylinders as a model of BPIII and at the same time provide microscopic description of the molecular arrangement. In this simulation study, we have found that higher chiral strength in the system induces inter-twinning of double-twist cylinders which eventually gives rise to a structure resembling BPIII phase. Additionally, we have found that higher values of dipole moment can induce novel bilayer arrangement in the smectic BPIII. Change in phase properties with increase in molecular length has also been studied. Our observation is that the Isotropic-BPIII transition temperature is higher for a system with higher molecular length. Greater the molecular length, the required value of is lower at which BPIII is formed. We also have observed that molecular elongation favours the efficacious formation of the smectic BPIII, whereas, increased dipolar strength is the key to give rise to novel bilayered BPIII. The focus of our work is to find out the proper contribution of various physical microscopic interactions responsible for the realization of BPIII and its novel layered counterparts. Consequently, this work indicates a way that may help to minimize present experimental hurdle due to significantly narrow stability region [1] of the BPIII phase. We hope, the present coarse-grained simulation study will help in the fundamental qualitative understanding of the molecular level arrangement in the BPIII and the coveted structure-property relationship.
5 Acknowledgement
T.P. gratefully acknowledges the support of Council of Scientific & Industrial Research (CSIR), India, for providing Senior Research Fellowship. This work is partly supported by the UGC-UPE scheme of the University of Calcutta.
References
- [1] Crooker, P. P. The blue phases A review of experiments. Liq. Cryst. 5, 751-775 (1989).
- [2] Marcus, M. Quasicrystalline behaviour and phase transition in cholesteric << blue >> phase. J. Phys. Paris, 42, 61 (1981).
- [3] Finn, P. L. & Cladis, P. E. Cholesteric Blue Phases in Mixtures and in an Electric Field. Mol. Cryst. Liq. Cryst. 84, 159 (1982).
- [4] Koistinen, E. P. & Keyes, P. H. Light-Scattering Study of the Structure of Blue Phase III. Phys. Rev. Lett. 74, 4460 (1995).
- [5] Wright, D. C. & Mermin, N. D. Crystalline liquids: the blue phases. Rev. Mod. Phys. 61, 385 (1989).
- [6] Hornreich, R. M. & Shtrikman, S. Broken Icosahedral Symmetry: A Quasicrystalline Structure for Cholesteric Blue Phase III. Phys. Rev. Lett. 56, 1723 (1986).
- [7] Rokhsar, D. S. & Sethna, J. P. Quasicrystalline Textures of Cholesteric Liquid Crystals: Blue Phase III? Phys. Rev. Lett. 56, 1727 (1986).
- [8] Hornreich, R. M., Kugler, M. & Shtrikman, S. Localized Instabilities and the Order-Disorder Transition in Cholesteric Liquid Crystals. Phys. Rev. Lett. 48, 1404 (1982).
- [9] Henrich, O., Stratford, K., Cates, M. E. & Marenduzzo, D. Structure of Blue Phase III of Cholesteric Liquid Crystals. Phys. Rev. Lett. 106, 107801 (2011).
- [10] Stone, M. T., Heemstra, J. M. & Moore, J. S. The Chain-Length Dependence Test. Acc. Chem. Res. 39, 11 (2006).
- [11] Az’hari, S. & Ghayeb, Y. Effect of chirality, length and diameter of carbon nanotubes on the adsorption of 20 amino acids: a molecular dynamics simulation study. Mol. Sim. 1 (2013).
- [12] Varshney, V., Lee, J., Brown, J. S., Farmer, B. L., Voevodin, A. A. & Roy, A. K. Effect of Length, Diameter, Chirality, Deformation, and Strain on Contact Thermal Conductance Between Single-Wall Carbon Nanotubes. Front. Mat. 5, 17-1 (2018).
- [13] Stojanović, M., Bubnov, A., Obanović, D. Ž., Hamplová, V., Kašpar, M. & Cvetinov, M. Effect of the chiral chain length on structural and phase properties of ferroelectric liquid crystals. Phase Transitions. 84, 380 (2011).
- [14] Skandani, A. A., Zeineldin, R. & Al-Harik, M. Effect of Chirality and Length on the Penetrability of Single-Walled Carbon Nanotubes into Lipid Bilayer Cell Membranes. Langmuir. 28, 7872 (2012).
- [15] Fu, D., Li, J., Wei, J. & Guo, J. Effects of Terminal Chain Length in Hydrogen-Bonded Chiral Switches on Phototunable Behavior of Chiral Nematic Liquid Crystals: Helicity Inversion and Phase Transition. Soft Matt. (2015).
- [16] Barzilai, N., Atzmon, G., Schechter, C., Schaefer, E., Cupples, A. L., Lipton, R., Suzanne, C. & Shuldiner, A. R. Unique Lipoprotein Phenotype and Genotype Associated With Exceptional Longevity. J. Am. Med. Assoc. 290, 2030 (2003).
- [17] Allen, M. P. and Tildesley, D. J. Computer Simulation of Liquids. Oxford University Press, Oxford, 1989.
- [18] Frenkel, D., Smit, B. Understanding Molecular Simulation: From Algorithms to Applications. Academic Press, 1996.
- [19] Paul, T. & Saha, J. Computer simulation study of novel chiral liquid crystal phases. Phys. Rev. Res. (Rapid Comm.) 1, 032012(R) (2019).
- [20] Memmer, R. Computer simulation of chiral liquid crystal phases VIII. Blue phases of the chiral Gay–Berne fluid. Liquid Crystals. 27, 533 (2000).
- [21] Gay, J. G. & Berne, B. J. Modification of the overlap potential to mimic a linear site–site potential. J. Chem. Phys. 74, 3316 (1981).
- [22] Van der Meer, B. W., Vertogen, G., Dekker, A. J. & Ypma, J. G. J. A molecular-statistical theory of the temperature-dependent pitch in cholesteric liquid crystals. J. Chem. Phys. 65, 3935 (1976), and references therein.
- [23] Onsager, L. Electric Moments of Molecules in Liquids. J. Am. Chem. Soc. 58, 1486 (1936).
- [24] Barker, J. A. & Watts, R. O. Monte Carlo studies of the dielectric properties of water-like models. Mol. Phys. 26, 789 (1973).
- [25] Watts, R. O. Monte Carlo studies of liquid water. Mol. Phys. 28, 1069 (1974).
- [26] Berardi, R., Orlandi, S. & Zannoni, C. Monte Carlo Simulations Of Rod-Like Gay Berne Mesogens With Transverse Dipoles. Int. Jour. Mod. Phys. C 10, 477 (1999).
- [27] Luckhurst, G. R., Stephens, R. A. & Phippen, R. W., Computer simulation studies of anisotropic systems. XIX. Mesophases formed by the Gay-Berne model mesogen. Liquid Crystals 8, 451 (1990).
- [28] Brown, D. & Clarke, J. H. R. A comparison of constant energy, constant temperature and constant pressure ensembles in molecular dynamics simulations of atomic liquids. Mol. Phys. 51, 1243 (1984).
- [29] Hoover, W. G. Atomistic Nonequilibrium Computer Simulations. Physica A. 118, 111 (1983).
- [30] McBride, C. & Wilson, M. R. Molecular dynamics simulations of a flexible liquid crystal. Mol. Phys. 97, 511 (1999).
- [31] Chen, W., Zhu, Y., Cui, F., Liu, L., Sun, Z., Chen, J. & Li, Y. GPU-Accelerated Molecular Dynamics Simulation to Study Liquid Crystal Phase Transition Using Coarse-Grained Gay-Berne Anisotropic Potential. PLoS ONE. 11, e0151704 (2016).
- [32] Paul, T. & Saha, J. Effect of head group orientation on phospholipid assembly. Phys. Rev. E. 95, 062703 (2017).
- [33] Stone, A. J. The description of bimolecular potentials, forces and torques: the S and V function expansions. Mol. Phys. 36, 241-256 (1978).
Author contributions statement
Jayashree Saha supervised the work. Both the authors, Tanay Paul and Jayashree Saha, contributed to the design of the work and analysis of the data and wrote the paper. Tanay Paul carried out the simulations.
Competing interests statement
The authors declare no competing interests.