22email: {yi.huang,xiaoshan.yang,csxu}@nlpr.ia.ac.cn
Time-Guided High-Order Attention Model of Longitudinal Heterogeneous Healthcare Data
Abstract
Due to potential applications in chronic disease management and personalized healthcare, the EHRs data analysis has attracted much attentions of both researchers and practitioners. There are three main challenges in modeling longitudinal and heterogeneous EHRs data: heterogeneity, irregular temporality and interpretability. A series of deep learning methods have made remarkable progress in resolving these challenges. Nevertheless, most of existing attention models rely on capturing the 1-order temporal dependencies or 2-order multimodal relationships among feature elements. In this paper, we propose a time-guided high-order attention (TGHOA) model. The proposed method has three major advantages. (1) It can model longitudinal heterogeneous EHRs data via capturing the 3-order correlations of different modalities and the irregular temporal impact of historical events. (2) It can be used to identify the potential concerns of medical features to explain the reasoning process of healthcare model. (3) It can be easily expanded into cases with more modalities and flexibly applied in different prediction tasks. We evaluate the proposed method in two tasks of mortality prediction and disease ranking on two real world EHRs datasets. Extensive experimental results show the effectiveness of the proposed model.
1 Introduction
With the wide use of digital devices and information systems in hospital, a large volume of Electronic Health Records (EHRs) data have been accumulated during the patients’ admissions to the hospital. EHRs consist of sequential records such as diagnoses, physical test indicators and medication prescriptions. Due to potential applications in chronic disease management and personalized healthcare, such EHRs data have attracted remarkable attentions of both researchers and practitioners. Deep learning based methods are widely used to model EHRs data in healthcare tasks, including disease detection [16, 23, 11], medical concept embedding [5, 2], computational phenotyping [1, 22, 3] and clinical event prediction [4, 25, 11]. However, it is still challenging to improve the quality and efficiency of the healthcare/disease management by mining large-scale heterogeneous EHRs data, where the treatment records provided by senior doctors and physical examination results monitored during hospital staying always have different formats with various recording frequencies.
There are three challenges in modeling the vast amount of longitudinal heterogeneous EHRs data: (1) Heterogeneity: EHRs data are collected from multiple devices and monitors. Multiple data streams are recorded for different destinations in different forms. For example, during a patient’s hospital stay, primary diagnostic codes are recorded by doctors for developing treatment plan, while some physical examination results are recorded by medical instruments for monitoring and evaluating the patient’s conditions. (2) Irregular temporality: On the one hand, the diagnostic codes and physical indicators are always sampled at different frequencies (e.g., ECG sampled dozens per second and vital signs sampled minutely). Moreover, the varying length of hospital staying also leads to the different length of the record sequence in different hospital visits. On the other hand, for a patient with multiple hospital visits, the time interval between two consecutive visits can vary from days to months. (3) Interpretability: It is important to improve the interpretability of the healthcare analysis model in addition to the prediction performance on EHRs sequence data. To help doctors and patients with a lot of complex EHRs data, a natural requirement is to identify the supporting evidences for the conclusions.
Over the past few years, a series of deep learning methods have made remarkable progress in resolving these challenges. Existing models often make efforts on improving the prediction performance by capturing the sequential manner of the EHRs data [8, 1], or representing the recorded medical concepts[17, 5]. In order to getting interpretable results, attention-based models geared towards a specific form of input for a particular task. [6] learns medical concepts with external knowledge. [7, 25] learn to selectively attend on different medical features. Most of these models rely on aggregated features via capturing the 1-order temporal dependencies or 2-order multimodal relationships among feature elements of the EHRs data.
In fact, when evaluating patients’ health condition, a doctor would comprehensively review both the past medical records and the current reports to find correlation factors, then focus on specific medical features, and make their decisions finally. This kind of reasoning process simultaneously explores the correlations of multiple data sources, such as medical diagnoses, lab indicators and the history medical events. Since most of existing attention models in healthcare only consider 1-order or 2-order relationships, the opportunity is likely to derive from learning high-order correlations (3-order and above) among feature elements. Learning these correlations effectively directs the appropriate attention to the relevant elements in different data modalities and at different time steps that are required to jointly solve the prediction task.
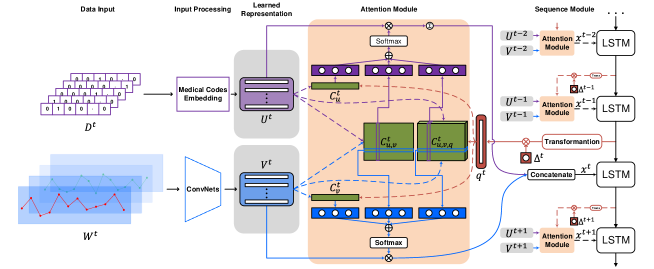
In this paper, we propose a Time-Guided High-Order Attention (TGHOA) model for analyzing the heterogeneous and irregular temporal longitudinal EHRs data. The proposed TGHOA jointly models the correlations of different types of longitudinal medical records and the irregular temporal impact of historical events. Specifically, we compute the one-hot medical diagnose feature by embedding scheme. The uniform representations of physical indicators with different recording frequencies and lengths are computed by convolution kernels. The diagnose features, physical indicator features and historical event features are comprehensively used to compute a relationship matrix which is further transformed to attention scores. Considering that a larger time interval between the previous visit and the current visit leads to less impact of the historical event feature, the time gap is used as an important factor to guide the attention computing. Finally, the attended features are combined together to predict patient’s health. Figure 1 shows the framework of the proposed method.
To summarize, the main contributions of this paper are as follows:
-
•
The proposed method can model longitudinal heterogeneous EHRs data via an efficient 3-order attention mechanism, to simultaneously capture the correlations of different modalities and the irregular temporal impact of historical events.
-
•
The proposed high-order attention module can be used to identify the potential concerns of medical features to explain the reasoning process of healthcare model.
-
•
Due to the efficient computation formula of the proposed higher-order attention mechanism, it can be easily expanded into cases with more modalities and flexibly applied in different prediction tasks. In our work, we evaluate the proposed method in two tasks of mortality prediction and disease ranking on two real world EHRs datasets.
2 Related Work
Traditional health analysis system often depends on labor intensive efforts, such as expert-defined phenotyping [20, 18] and manual feature engineering [24]. We briefly review the three kinds of deep learning based methods mostly related to our work.
Deep Learning on Longitudinal EHRs data. [15] shows that RNN models, which can capture the dynamic relationships in sequential data, perform pretty good in large historical data of EHRs. In addition, [3] found that the irregularity of longitudinal EHRs data would affect model performance and used Dynamic Time Warping (DTW) to match irregular temporal patterns in data sequences. [1] proposed a novel LSTM architecture, which performs a subspace decomposition module and a time-decaying memory module followed by the standard gated architecture of LSTM, to handle time irregularities in sequences. These methods do not consider hidden inter-correlation between different medical variables in heterogeneous EHRs data and lack of interpretability.
Deep Learning on Heterogeneous EHRs data. [12] designed a heterogeneous LSTM structure to explore multiple inter-correlations of different medical sequences with different lengths and record frequencies. [25] proposed an efficient multi-channel attention model of multimodal EHRs time series. However, these models only focus on an instance encounter and do not consider the longitudinally historical records of patients.
Attention-based Interpretable Deep Methods. RETAIN [7] used two RNNs to model visit-level and variable-level attention mechanisms. Thus it could determine which visit and which medical variable it should pay attention while doing predicting. GRAM [6] used a graph-based attention model in two sequential diagnoses prediction tasks and one heart failure (HF) prediction task. This method could learn robust representations of medical code via a knowledge graph which describes medical ontology relationships. RAIM [25] proposed a recurrent attentive and intensive model for analyzing the multimodal EHR time series. RAIM uses an efficient multi-channel attention on continuous monitored data, which is guided by discrete clinical data. Different from these works, we design a high-order attention module to jointly handle the irregular temporality and heterogeneity of the EHRs data.
3 Methods
In this section, we first define the notations describing the original EHRs events sequence, followed by representation methods of two types of heterogeneous sequential data. Then we describe the details of the proposed time-guided high-order attention module. Finally, we introduce the decision-making process based on the attended features. Figure 1 shows an overview of our method.
3.1 Notations
To reduce clutter, we will introduce our method for a single patient. We define a patient’s -th visit to hospital as one EHRs event , and multiple visits are denoted as a EHRs event sequence where is the number of this patient’s all visits. Each visit where is an integrated set of discrete diagnoses data indicating what diseases are the patient suffering from. is a set of lab results, such as saturation of pulse and arterial blood pressure. is patient’s groundtruth health evaluation after the visits. In the experiment, is death rate in the mortality estimation task and the grade of diseases in the disease ranking task.
Patients would be diagnosed with different diseases, so the number of elements in is varying in different visits. We denote , where is a one-hot representing of patient’s -th disease in -th visit. The denotes the medical code set. The is the number of unique medical codes of diseases. The is the number of diseases that the patient is suffering from. The lab indicator set , where denotes -th lab indicator at the -th visit of the patient.
3.2 EHRs Data Representation
In this section, we introduce how to to represent two types of heterogeneous data respectively. The expressive data representations are very important for capturing their correlation patterns.
3.2.1 Diagnose Embedding
Given a medical code representation , we can obtain its embedding representation as follows:
| (1) |
where is a learned embedding matrix and is the dimension of the embedding vector. Thus the diagnostic information is transformed to .
3.2.2 Lab Indicator Feature Extracting
As mentioned in Section 3.1 that lengths of lab indicator waveforms are different within a single visit. Besides, a lab indicator has different length in multiple visits. To uniformly represent these indicator waveforms, we design a one-dimension convolutional neural network to extract the fixed length features:
| (2) |
where is a two-layer convolutional neural network. The first convolutional block consists of a convolution layer, a max-pooling layer and a activation function ReLu. The second convolutional block consists of a convolution layer and a max-overtime pooling layer [14], which is applied to naturally deals with variable waveform lengths. So we could get the feature representation of the lab indicator with a fixed-length. For different lab indicators, we initialize different network parameters of to compute their features respectively. And the network parameters are shared among different visits for the same lab indicator. Then the final feature of lab indicators in -th visit are represented as .
3.3 Time-Guided High-Order Attention
In the following parts, we will refer to the iteration of LSTM with a single step using notations as follows:
| (3) |
where is the LSTM hidden state vecotor, is the LSTM memory cell vecotor and is the LSTM input vector which contains the information of and . Here we use to denote the dimensionality of hidden vectors.
Subsequently we consider the attention mechanism as an importance model with each part computing “importance” of medical variable from each types of data. We use and to denote the intra-sequence temporality of two types of sequential data. expresses inter-sequence correlation between two data sequences. captures third-order correlation among two types of sequential data and the history event feature. We compute the importance scores and of the medical diagnose representations and the lab indicator features by combination of intra-sequence irregular temporality unit, inter-sequence correlation unit, third-order correlation unit:
| (4) |
here, and are learned parameters and refers to the Softmax operation over and respectively. Such a linear combination of units provides extra flexibility for the model, since it can learn the reliability of the unit from the data.
3.3.1 Intra-sequence Irregular Temporality
The intra-sequence irregular temporality unit is designed to calculate the importance of medical factors from intra-sequence data based on the historical event feature. We first define attention query as the nonlinearly transformed feature of the previous memory by a one-layer neural network. What’s more, considering that the reference value of historical records would change over time, we use a decaying function [19, 1] as time guidance to adjust impact of historical memory. is an irregular time interval between two neighborhood visits. So the memory query is obtained via:
| (5) |
where and are learned parameters.
The intra-sequence irregular temporality attention weights are formally formulated as:
| (6) |
where , , and are trainable parameters.
3.3.2 Inter-sequence Correlation
Besides the mentioned temporal dependencies of each data sequence, we now introduce a inter-sequence correlation unit, which is able to learn the correlation between the representations of two data sequences. We use a relationship matrix between data sequences and , where each entry is calculated as follows:
| (7) |
The and are trainable parameters. measures the correlation between the -th diagnostic code and the -th lab indicator. Therefore, to retrieve the attention for a specific diagnostic code or lab indicator, we convolve the matrix along the corresponding feature dimension using a dimensional kernel. Specifically,
| (8) |
where and are trainable parameters.
3.3.3 Time-guided Inter-sequence Correlation
We formulate the high-order correlation between historical records and all data sequences as follows:
| (9) |
where , and are trainable parameters. Similar to the inter-sequence correlation unit, we use the relationship matrix to compute correlated attention scores for each data sequence:
| (10) |
where and are trainable parameters.
3.4 Prediction Model
After obtaining attention scores and for medical diagnoses and lab indicators, the attended features of different data sequences can be calculated respectively. We obtain the final representation of medical codes via attentive mean-pooling as following:
| (11) |
For all features of lab indicators, we concatenate them with attention weights:
| (12) |
We further concatenate the attended medical diagnose feature and lab indicator feature and get Then, we feed as input into the LSTM sequence model described in Eq. (3). After obtaining the final state , the estimated distribution over possible patient’s health evaluation is given by:
| (13) |
where a fully-connected layer followed by activation function . The and are learnable parameters of the output layer.
The parameters of all modules are trained end-to-end together by minimizing the following cross entropy loss:
4 Experiments
4.1 Data
In our experiment, we adopt two real world EHRs datasets, namely MIMIC-III [13] and PPMI [9]. For the MIMIC-III dataset, the proposed high-order attention model is applied to a binary classification task of predicting whether the patient would die or survive in ICU. For the PPMI dataset, the proposed attention model is applied in prediction of disease ranking.
4.1.1 MIMIC-III Dataset
Medical Information Mart for Intensive Care III (MIMIC-III) is a publicly available multimodal EHRs dataset comprising deidentified health data associated with critical care patients in Beth Israel Deaconess Medical Center over 11 years [13]. The data contains vital signs, laboratory measurements, diagnostic codes, survival data of 46,520 patients. In the mortality prediction task, we only consider a subset of this dataset. We extract data of patients who have more than two hospital visits. In order to acquire better generalization ability, we choose 1,629 diagnostic codes, whose total frequency of occurrence is greater than 95% in the dataset. For the lab indicators, we choose heart rate, saturation of pulse , blood glucose and arterial blood pressure from the CHARTEVENTS table as primary physical examination data. We finally get 9,171 records of 2,348 patients. We randomly split the dataset into training and testing sets with a ratio of 4:1. The groundtruth mortality rate in the pre-processed dataset is about 22.7%.
4.1.2 PPMI Dataset
Parkinson’s Progression Markers Initiative (PPMI) is an observational clinical and longitudinal study comprising evaluations of people with Parkinson’s disease (PD), those people with high risk, and those who are healthy [9]. We refer to [3] for data pre-processing. In our experiments, we use medication prescriptions as medical codes and choose 318 physical examination features as lab indicators according to [21]. As a result, we get 13,768 records of 586 patients. We randomly split the dataset into training and testing sets with a ratio of 4:1. For the groundtruth labels, we use Hoehn and Yahr (NHY) scale scores [10] which describe how the motor functions of PD patients deteriorate.
| Model | MIMIC-III | PPMI | |||||
|---|---|---|---|---|---|---|---|
| Accuracy | AUC-PR | AUC-ROC | Accuracy | AUC-PR | AUC-ROC | ||
| LSTM | 0.7790 | 0.8520 | 0.8555 | 0.8319 | 0.8669 | 0.9595 | |
| LSTM-Att | 0.7811 | 0.8710 | 0.8766 | 0.8319 | 0.9180 | 0.9747 | |
| T-LSTM | 0.7854 | 0.8643 | 0.8643 | 0.8230 | 0.8998 | 0.9660 | |
| RETAIN | 0.8047 | 0.8704 | 0.8772 | 0.8584 | 0.9213 | 0.9755 | |
| LSTM+TGA | 0.7961 | 0.8769 | 0.8829 | 0.8407 | 0.9185 | 0.9764 | |
| LSTM+CoA | 0.7876 | 0.8602 | 0.8664 | 0.8496 | 0.9312 | 0.9808 | |
| TGCoA | 0.8062 | 0.8878 | 0.8867 | 0.8673 | 0.9408 | 0.9837 | |
| TGHOA | 0.8155 | 0.9091 | 0.9071 | 0.8938 | 0.9581 | 0.9883 | |
4.2 Implementation
All the model parameters introduced in Section 3 are randomly initialized and trained in an end-to-end form. We use RMSProp optimizer with gradient descent to train the model. Instead of padding the sequences to the same length, we use the sequences with same number of visits to form a training batch. The learning rate is set to 0.001. Dimension of the medical code embedding is 64. The dimension of the LSTM hidden layer is set to 128. The unit of is set to year on the MIMIC-III dataset and day on the PPMI dataset respectively.
To evaluate the performance of the proposed model, we compare it with the following baseline models:
-
•
LSTM: We use basic LSTM as a simple baseline model. Without considering the irregular temporal impact and inter-correlations of EHRs data, we feed the mean-pooled feature and mean-concatenated feature into the LSTM instead of the attended feature and .
-
•
LSTM+Att: This model uses LSTM with attention mechanism which only considers the intra-sequence temporal unit without time-guided query.
-
•
T-LSTM [1]: T-LSTM uses a decaying function of time interval to adjust previous memory cell which affects current output in LSTM. We set T-LSTM as a baseline model which considers the characteristic of varying time intervals in EHRs sequences.
-
•
RETAIN [7]: RETAIN uses two RNNs to model visit-level and variable-level attention. It could detect influential past visits and clinical variables.
-
•
LSTM+TGA: This model uses LSTM with interactive attention mechanism which only considers the intra-sequence irregular temporality item and in Eq. (4).
-
•
LSTM+CoA: This model uses LSTM with interactive attention mechanism which considers only the inter-sequence correlation item in Eq. (4).
-
•
TGCoA: This model uses LSTM with attention mechanism which considers both the intra-sequence irregular temporality item and , and the inter-sequence correlation item in Eq. (4).
-
•
TGHOA: This is the proposed time-guided high-order attention model which considers all attention items as shown in Eq. (4).
4.3 Result Analysis
The prediction results obtained by all baselines are measured by three evaluation metrics including Accuracy, AUC-PR and AUC-ROC. Table 1 shows the experimental results on both MIMIC-III and PPMI datasets. As shown, The proposed TGHOA outperforms all other models on both datasets.
For the mortality prediction task on the MIMIC-III dataset, LSTM+TGA performs better than LSTM+Att. It indicates intra-sequence irregular temporality unit could better capture the irregular temporal impact than LSTM+Att which do not consider time intervals of sequential data. We also get better performance than RETAIN Besides, LSTM+TGA has better performance than T-LSTM. It shows that considering irregular temporal impact with time-guided attention is more effective. LSTM+CoA has higher scores compared to LSTM model. It indicates that considering the inter-correlation between two types of EHRs data via attention mechanism is helpful. The model LSTM+CoA that incorporates the intra-sequence irregular temporality unit and the inter-source correlation unit further improves the performance. Lastly, the proposed model TGHOA that considers the time-guided high-order correlations obtains the best performance. For the parkinson ranking task on the PPMI dataset, the proposed TGHOA has similar performance improvements over baseline models.
4.4 Effects of Time-Guided Strategy
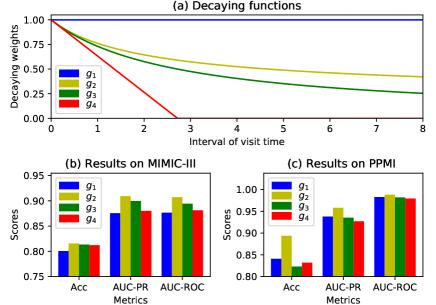
In the proposed method, the high-order attention module jointly considers the correlation between different modalities and the irregular temporal impact of historical memory. To further analysis the time-guided attention scheme, we investigate the effects of different time-guided functions to the performance of TGHOA. We compare four kinds of decaying functions including without any decaying, , and . Here, the is the adopted decaying function of the proposed method as introduced in Section 3.3.1. Figure 2(a) shows four function curves. Note that the unit of is year on the MIMIC-III dataset and day on the PPMI dataset respectively. Figure 2(b) shows results obtained by our method with four decaying functions.
When using as a guided function without time decaying, our model obtains worst performance. This further demonstrates that the time-guided attention scheme works well for modeling longitudinal EHRs data. What’s more, the decaying function performs better than and . It indicates that if the attention model forgets the history feature too quickly, we can only make a suboptimal health assessment, especially obvious on the PPMI dataset.
| Model | Diagnoses (ICD-9 Code) |
|---|---|
| TGHOA | Acidosis (276.2); History of kidney neoplasm (V10.52); |
| Urinary complications (997.5);Atrial fibrillation (427.31); | |
| Other noninfectious disorders of lymphatic channels (457.8); | |
| Other iatrogenic hypotension (458.29) | |
| TGCoA | Other noninfectious disorders of lymphatic channels (457.8); |
| Acidosis (276.2);History of kidney neoplasm (V10.52); | |
| Atrial fibrillation (427.31); Urinary complications (997.5); | |
| Other iatrogenic hypotension (458.29) | |
| LSTM+CoA | Atrial fibrillation (427.31); Other iatrogenic hypotension (458.29); |
| Urinary complications (997.5); History of kidney neoplasm (V10.52); | |
| Acidosis (276.2); | |
| Other noninfectious disorders of lymphatic channels (457.8); | |
| LSTM+TGA | Urinary complications (997.5); Other iatrogenic hypotension (458.29); |
| Atrial fibrillation (427.31); Acidosis (276.2); | |
| History of kidney neoplasm (V10.52); | |
| Other noninfectious disorders of lymphatic channels (457.8); |
4.5 Case Study
A key advantage of our model is its interpretability. We conduct a case study of an unseen patient in the testing set of the MIMIC-III dataset.
In Table 2, we rank the diagnostic codes according to their attention scores. We could see that Acidosis (276.2) and History of kidney neoplasm (V10.52), which have high fatality rate, have got high attention scores in TGHOA. While other diseases are complications which would not directly cause death. This results demonstrate that proposed attention mechanism gives reasonable cues of the medical features for the mortality prediction. On the other hand, TGHOA and TGCoA generate very different attention scores of the medical feature Other noninfectious disorders of lymphatic channels (457.8) while other diagnoses have similar rank. The LSTM+CoA and LSTM+TGA have distinctly different diagnostic attention ranks. It shows that neither LSTM+CoA nor LSTM+TGA has modeled the complete correlation information of the EHRs data.
5 Conclusions
In this paper, we proposed a time-guided high-order attention (TGHOA) model for analyzing the heterogeneous and irregular temporal longitudinal EHRs data. The diagnose features, physical indicator features and historical event features were comprehensively used to compute a relationship matrix which was further transformed to attention scores. The irregular time interval was used as an important factor to guide the attention computing. The proposed high-order attention model was evaluated on the MIMIC-III and PPMI datasets. Extensive experimental results demonstrated the effectiveness and interpretability of the proposed method.
Acknowledgments. This work was supported in part by National Key Research and Development Program of China (No. 2017YFB1002804), National Natural Science Foundation of China (No. 61702511, 61720106006, 1711530243, 61620106003, 61432019, 61632007, U1705262, U1836220) and Key Research Program of Frontier Sciences, CAS, Grant NO. QYZDJSSWJSC039. This work was also supported by Research Program of National Laboratory of Pattern Recognition (No. Z-2018007) and CCF-Tencent Open Fund.
References
- [1] Baytas, I.M., Xiao, C., Zhang, X., Wang, F., Jain, A.K., Zhou, J.: Patient subtyping via time-aware lstm networks. In: SIGKDD. pp. 65–74. ACM (2017)
- [2] Cai, X., Gao, J., Ngiam, K.Y., Ooi, B.C., Zhang, Y., Yuan, X.: Medical concept embedding with time-aware attention. In: IJCAI. pp. 3984–3990 (2018)
- [3] Che, C., Xiao, C., Liang, J., Jin, B., Zho, J., Wang, F.: An rnn architecture with dynamic temporal matching for personalized predictions of parkinson’s disease. In: SDM. pp. 198–206. SIAM (2017)
- [4] Choi, E., Bahadori, M.T., Schuetz, A., Stewart, W.F., Sun, J.: Doctor ai: Predicting clinical events via recurrent neural networks. In: MLHC. pp. 301–318 (2016)
- [5] Choi, E., Bahadori, M.T., Searles, E., Coffey, C., Thompson, M., Bost, J., Tejedor-Sojo, J., Sun, J.: Multi-layer representation learning for medical concepts. In: SIGKDD. pp. 1495–1504. ACM (2016)
- [6] Choi, E., Bahadori, M.T., Song, L., Stewart, W.F., Sun, J.: Gram: graph-based attention model for healthcare representation learning. In: SIGKDD. pp. 787–795. ACM (2017)
- [7] Choi, E., Bahadori, M.T., Sun, J., Kulas, J., Schuetz, A., Stewart, W.: Retain: An interpretable predictive model for healthcare using reverse time attention mechanism. In: NIPS. pp. 3504–3512 (2016)
- [8] Choi, E., Schuetz, A., Stewart, W.F., Sun, J.: Using recurrent neural network models for early detection of heart failure onset. Journal of the American Medical Informatics Association 24(2), 361–370 (2016)
- [9] Dinov, I.D., Heavner, B., Tang, M., Glusman, G., Chard, K., Darcy, M., Madduri, R., Pa, J., Spino, C., Kesselman, C., et al.: Predictive big data analytics: a study of parkinson’s disease using large, complex, heterogeneous, incongruent, multi-source and incomplete observations. PloS one 11(8), e0157077 (2016)
- [10] Hoehn, M.M., Yahr, M.D., et al.: Parkinsonism: onset, progression, and mortality. Neurology 50(2), 318–318 (1998)
- [11] Jagannatha, A.N., Yu, H.: Structured prediction models for rnn based sequence labeling in clinical text. In: EMNLP. vol. 2016, p. 856. NIH Public Access (2016)
- [12] Jin, B., Yang, H., Sun, L., Liu, C., Qu, Y., Tong, J.: A treatment engine by predicting next-period prescriptions. In: SIGKDD. pp. 1608–1616. ACM (2018)
- [13] Johnson, A.E., Pollard, T.J., Shen, L., Li-wei, H.L., Feng, M., Ghassemi, M., Moody, B., Szolovits, P., Celi, L.A., Mark, R.G.: Mimic-iii, a freely accessible critical care database. Scientific data 3, 160035 (2016)
- [14] Kim, Y.: Convolutional neural networks for sentence classification. arXiv preprint arXiv:1408.5882 (2014)
- [15] Lipton, Z.C., Kale, D.C., Elkan, C., Wetzel, R.: Learning to diagnose with lstm recurrent neural networks. arXiv preprint arXiv:1511.03677 (2015)
- [16] Ma, F., Chitta, R., Zhou, J., You, Q., Sun, T., Gao, J.: Dipole: Diagnosis prediction in healthcare via attention-based bidirectional recurrent neural networks. In: SIGKDD. pp. 1903–1911. ACM (2017)
- [17] Miotto, R., Li, L., Kidd, B.A., Dudley, J.T.: Deep patient: an unsupervised representation to predict the future of patients from the electronic health records. Scientific reports 6, 26094 (2016)
- [18] Pathak, J., Kho, A.N., Denny, J.C.: Electronic health records-driven phenotyping: challenges, recent advances, and perspectives (2013)
- [19] Pham, T., Tran, T., Phung, D., Venkatesh, S.: Deepcare: A deep dynamic memory model for predictive medicine. In: PAKDD. pp. 30–41. Springer (2016)
- [20] Richesson, R.L., Sun, J., Pathak, J., Kho, A.N., Denny, J.C.: Clinical phenotyping in selected national networks: demonstrating the need for high-throughput, portable, and computational methods. AIM 71, 57–61 (2016)
- [21] van Rooden, S.M., Colas, F., Martínez-Martín, P., Visser, M., Verbaan, D., Marinus, J., Chaudhuri, R.K., Kok, J.N., van Hilten, J.J.: Clinical subtypes of parkinson’s disease. Movement Disorders 26(1), 51–58 (2011)
- [22] Suresh, H., Szolovits, P., Ghassemi, M.: The use of autoencoders for discovering patient phenotypes. arXiv preprint arXiv:1703.07004 (2017)
- [23] Thodoroff, P., Pineau, J., Lim, A.: Learning robust features using deep learning for automatic seizure detection. In: MLHC. pp. 178–190 (2016)
- [24] Xu, Y., Hong, K., Tsujii, J., Chang, E.I.C.: Feature engineering combined with machine learning and rule-based methods for structured information extraction from narrative clinical discharge summaries. Journal of the American Medical Informatics Association 19(5), 824–832 (2012)
- [25] Xu, Y., Biswal, S., Deshpande, S.R., Maher, K.O., Sun, J.: Raim: Recurrent attentive and intensive model of multimodal patient monitoring data. In: SIGKDD. pp. 2565–2573. ACM (2018)