Tim Ziemer, University of Bremen, Medical Image Computing Group, Enrique-Schmidt-Str. 5, 28359 Bremen, Germany
Three Orthogonal Dimensions for Psychoacoustic Sonification
Abstract
Objective: Three perceptually orthogonal auditory dimensions for multidimensional and multivariate data sonification are identified and experimentally validated. Background: Psychoacoustic investigations have shown that orthogonal acoustical parameters may interfere perceptually. The literature hardly offers any solutions to this problem, and previous auditory display approaches have failed to implement auditory dimensions that are perceived orthogonally by a user. In this study we demonstrate how a location in three-dimensional space can be sonified unambiguously by the implementation of perceptually orthogonal psychoacoustic attributes in monophonic playback. Method: Perceptually orthogonal auditory attributes are identified from literature research and experience in music and psychoacoustic research. We carried out an experiment with participants who identified sonified locations in two-dimensional space. Results: With just minutes of explanation and exploration, naive users can interpret our multidimensional sonification with high accuracy. Conclusion: We identified a set of perceptually orthogonal auditory dimensions suitable for three-dimensional data sonification. Application: Three-dimensional data sonification promises blind navigation, e.g. for unmanned vehicles, and reliable real-time monitoring of multivariate data, e.g., in the patient care sector.
keywords:
Auditory Display, Audition, Noise/acoustics, Sound Design, Interpretability1 Introduction
Sonification is a powerful means to complement or replace visual displays, especially in situations in which vision is limited (e.g., in darkness, fog, smoke, muddy waters, etc. or due to occlusion), in which the visual scene is overloaded (e.g. due to too many displays or visual distractors), or in which spatio-visual processing is the bottleneck of spatial cognition Walker and Nees (2011).
There is a need for orthogonal dimensions in sonification for multidimensional or multivariate data Neuhoff et al. (2002); Yeung (1980); Barrass (1997); Watson and Sanderson (2004); Worrall (2019) (Worrall, 2009, ch. 6). The most prominent application area for multidimensional sonification is spatial navigation, e.g., in real and virtual environments Ziemer and Schultheis (2018b); Lokki and Gröhn (2005); Walker and Lindsay (2006), games Degara et al. (2013a), piloting Towers et al. (2014); Florez (1936), remote vehicle control Vasilijevic et al. (2016), autonomous drivingGray (2011), image-guided surgical interventions Black et al. (2017); Ziemer and Black (2017a); Ziemer et al. (2017) and neuronavigation Willems et al. (2005). Degara et al. (2014) even consider sonification for navigation “one of the most important tasks in auditory display research”. Besides navigation, examples for multidimensional or multivariate data sonification include motion analysis and interactive feedback in sports training and neuromotor rehabilitation Huang et al. (2006); Scholz et al. (2014); Reh et al. (2019); Schmitz et al. (2018) and in multivariate data monitoring, like anesthesia and patient monitoring Sanderson et al. (2005), stock market monitoring Neuhoff et al. (2002), data exploration and browsing Yeung (1980); Noirhomme-Fraiture et al. (2008); Bly (1982); Stewart (2010); Rabenhorst et al. (1990); Hermann (2002).
Here, perceptual orthogonality means that while two quantities are simultaneously sonified, both can be interpreted. Moreover, if one quantity changes, the change of sound can be attributed to its corresponding quantity, and unambiguously interpreted. This obvious necessity is not easily achieved. Due to the complicated, nonlinear processing of the auditory system, all physical sound field quantities can affect practically all perceptual attributes of sound. Despite its importance, the lack of perceptual orthogonality is considered one of the most challenging issues in sonic interaction design, auditory interfaces for Human-Computer Interaction, auditory display, and, especially, sonification design Visell et al. (2013); Brewster (2003); Worrall (2009); Hermann (2002); Anderson and Sanderson (2009, 2004); Neuhoff (2011); Kramer (1994); Grond (2013).
In this paper we present auditory attributes that can serve as three orthogonal dimensions. The approach is evaluated in a listening test with naive listeners.
2 Background
Orthogonality is a topic that has been treated a lot in the fields of psychoacoustics and auditory display research, and will be briefly discussed in this section, followed by previous work. A lot of previous work either focused on the implementation of psychoacoustics in sonification design or on orthogonal dimensions in sonification. Our work integrates these two lines of research by leveraging psychoacoustic knowledge to sonify perceptually orthogonal dimensions.
2.1 Orthogonality
Following the literature on sonification Worrall (2009); Hermann (2002) and psychoacoustics Schneider (1997, 2018a) we define dimensions in a Cartesian way as having both a direction and a distance, also referred to as polarity and magnitude. In that sense, information like the radius, which is one dimension in polar and cylindrical coordinates, is only a half-dimension; it only informs about a distance, not a direction Parseihian et al. (2016). It is widely accepted that auditory sensations and other psychological attributes are never perfectly orthogonal, as the dimensions may be correlated to some extent Schneider (1997). Hence, we consider dimensions as orthogonal, if a magnitude change of one dimension hardly affects the magnitude of any other dimension, often referred to as separable Garner (1974); Schneider (2018b); Neuhoff (2004). In that sense, they are linearly independent from one another Worrall (2009), i.e., they barely exhibit any coupling or perceptual interactions (Hermann, 2002, ch. 3); Anderson and Sanderson (2004, 2009). Furthermore, a dimension must be continuous, i.e., on interval scale or ratio scale rather than ordinal or nominal scale Schneider (1997).
2.2 Orthogonality in Sonification
There are plenty examples of sonifications mapping one half-dimension to amplitude and another to frequency Neuhoff et al. (2002) and it is not surprising that the authors realized in their evaluations that these physically orthogonal dimensions interact perceptually.
Anderson and Sanderson (2009) tried out several mapping principles for multivariate data in complex work domains. They do not consider psychoacoustics in their parameter mapping approach, but map multiple variables to physical parameters, like amplitude, amplitude modulations, fundamental frequency, cutoff-frequency, pulse width, etc. They realize that participants had problems interpreting multiple variables at once. They criticize that psychoacoustic research does not provide sufficient guidelines for sophisticated, orthogonal sonification design. Yet, they hope that “…careful sonification design, based on a complete understanding of the mechanisms causing perceptual interactions, could overcome such problems”. A similar observation has been made by Hellier et al. (1993), who carried out experiments in which they altered the magnitude of several acoustical quantities to see how it affects perceived urgency. They realized that changing the magnitude of one parameter, like raising the fundamental frequency, increasing the amplitude or increasing the playback speed, increased the perceived urgency. However, when altering several parameters at once, the urgency levels do not add up, but create somewhat nonlinear effects.
Hermann (2002) lists the “lack of perceptual orthogonality” as one of the most important difficulties in auditory displays. He agrees with Anderson and Sanderson (2009) that auditory perception is too little understood to specify multiple orthogonal dimensions. Likewise, Brewster (2003) lists the “lack of orthogonality” one of the problems with nonspeech sound.
(Worrall, 2009, ch. 2) agrees with this observation, too, stating that “(…) parameter mapping requires a working knowledge of how the parameters interact with each other perceptually”, because these interaction may obscure data relations and even confuse the listener Worrall (2019). He thinks that attempts to create a perceptually orthogonal sonification space have not yet been successful, giving the timbre space sonification approach Barrass (1997) as an example. At the same time, he expressed the need for better tools.
2.3 Psychoacoustics in Sonification Design
The need to consider psychoacoustics in sonification design has been expressed in numerous studies Hellier et al. (1993); Hermann (2002); Bovermann et al. (2011); Bly (1982); Kramer (1994); Barrass (1994); Smith (1990); Williams (1994); Ferguson and Brewster (2017); Walker and Kramer (2004); Ferguson et al. (2006); Bliss and Spain (2007); Hunt and Hermann (2011); Degara et al. (2013b).
Ferguson and Brewster (2017) evaluate psychoacoustic parameters for sonification. They argue that pitch is a meaningful dimension, as human listeners have a high resolution in pitch perception. They suggest the use of loudness fluctuation and roughness as additional dimensions. The authors of Ferguson et al. (2006) suggest mapping of parameters to pitch, loudness, roughness, and brightness. Likewise, Parseihian et al. (2016) consider pitch, loudness, duration/tempo and timbre as orthogonal and as the main perceptual attributes of sound. Arfib et al. (2002) name pitch, loudness, timbre aspects, like brightness, roughness, attack time, vibrato and formants, spatialization, as well as their temporal derivatives, as psychoacoustic parameters suitable for understandable multidimensional sonification.
The authors of Parseihian et al. (2016) managed to implement and validate sonification designs derived from psychoacoustic considerations. Here, the distance to a target was not just mapped to physical audio parameters, but to psychoacoustic quantities. The distance to a target was mapped to the speed of modulations of either frequency or amplitude. These modulations create the impression of pitch fluctuations or loudness fluctuations, respectively. Only at the target location, the pitch, or loudness, respectively, was steady. They implemented neither a complete one-dimensional approach (with both a polarity and a distance) nor a multi-dimensional approach. But they suggest to map orthogonal dimensions to segregate auditory streams Bregman (1990), like one to pitch- and another to tempo-fluctuations.
2.4 Orthogonal Psychoacoustic Sonification
A few studies aimed at creating multi-dimensional sonification based on psychoacoustic knowledge. Already in 1980 Yeung (1980) argues that no less than dimensions can be created from the parameters pitch, loudness, damping, direction, duration of sound and duration of silence, attack time, phase coherence and overtones. However, the study gives no evidence for this claim. The work does not clearly distinguish between physical and perceptual parameters and neglects the interference problems mentioned in the previous section.
Barrass (1994, 1997) describes a theory to map three cylindrical dimensions to a perceptual auditory space. Here, pitch is the height dimension, brightness is the radius, and timbre in terms of different musical instruments serve as angles. However, the author identify timbre in terms of musical instruments to be nominal rather than in interval scale. Furthermore, he recognized that this timbre choice does not allow for comprehensible opposite angles, which would be necessary for interpretable cylindrical coordinates. Overall, he considered the sounds of his sonification approach as difficult to interpret.
Scholz et al. (2014) map one direction to pitch and another one to brightness of a synthesized sound. The sonification informs about the magnitude in each direction, but not about the polarity. Hence, we consider these as half-dimensions. In an experiment elderly participants were presented one reference sound. Then, they explored a map with times fields, each playing one sound with a distinct combination of pitch and brightness. Their task was to select the field whose sound equaled the reference sound. Their mean error lay between about and fields for the pitch direction and between and for the brightness direction. A random guess would have led to a mean error of . Based on these results, they consider the two parameters as orthogonal and implement the two, together with loudness as parameter for the third half-dimension, for motion sonification in Scholz et al. (2016). However, their study does not evaluate the perceptual orthogonality of the third dimension.
The authors of Ferguson et al. (2006) come up with a framework, for psychoacoustic sonification of multidimensional or multivariate data. They suggest to map one dimension or variable to one psychoacoustic parameter and another dimension or variable to another psychoacoustic parameter. They understand that mapping orthogonal data to the magnitude of orthogonal auditory qualities is an inverse problem; the desired perceptual outcome is known, but the the physical audio parameters necessary to create such output need to be found. This problem is ill-posed. Hence, there is no analytical solution. They suggest to solve the problem by massive lookup tables. However, they see the problem that this solution may cause large jumps of audio parameter magnitudes by just small changes of the input data. These jumps may cause audible artifacts.
In our own previous work we introduced chroma as one and a combination of beats and roughness as orthogonal auditory dimensions for two-dimensions sonification Ziemer and Black (2017b); Ziemer (2017). The digital signal processing for this psychoacoustic sonification approach is explained in Ziemer et al. (2017, 2018). We validated the approach in a passive listening experiment with inexperienced listeners. In a multiple-choice task with fields on a map, they correctly identified % of the sonified targets even though the performance of one participant was near chance level. Over % of the quadrants were identified correctly. These results indicate that listeners are able to interpret the direction and distance along each dimension independently, despite the fact that both dimensions are presented at the same time. Motivated by these results we carried out slight improvements of the sonification and then conducted an interactive experiment with participants Ziemer and Schultheis (2018a, b). Results of this experiment underlined that these dimensions are in fact orthogonal, and gave additional indication about good linearity and high resolution of the dimensions and about learnability and training effects and the way people interact with the sound in a navigation task. In Ziemer and Schultheis (2019) we describe a modified signal processing approach to add a third dimension to the two-dimensional sonification. However, the interpretability and orthogonality have only been explored by the authors.
In this contribution we explain how we derived the third dimension. We repeat the passive experiment from Ziemer et al. (2017); Ziemer and Black (2017b) to evaluate the orthogonality of our improved two-dimensional sonification and our newly introduced third dimension as described in Ziemer and Schultheis (2019).
3 Psychoacoustic Sonification
This section starts with an overview of perceptual auditory qualities that can be found in the literature. We then describe how to derive three orthogonal dimensions, including direction and distance. We distinguish acoustic attributes from auditory attributes, the first describing the physical domain, the latter referring to the perceptual domain.
3.1 Perceptual Auditory Qualities
Previous work demonstrated that acoustic attributes may interfere perceptually, and even individual auditory qualities may correlate to some extent. This led to the above statements that there is a lack of orthogonal auditory attributesHermann (2002); Worrall (2009); Anderson and Sanderson (2009). However, in our opinion, orthogonal auditory dimensions exist. What is missing is a comprehensive treatise of orthogonality in the psychoacoustic literature. As Neuhoff (2004) states: “…perceptual interaction of auditory dimensions (…) have also been studied very little compared with more traditional areas of psychoacoustic research”. However, a heuristic technique to derive perceptually independent attributes for multidimensional sonification is an accepted and promising approach Worrall (2019). A brief discussion is presented in this section.
Literature on auditory sensation and perception describes several auditory qualities. Some are unidimensional, others are multidimensional. Some are independent from the others, whereas some interfere to some extent. Auditory qualities include:
In the psychoacoustic literature orthogonality of only a few of the above-listed auditory attribute has been discussed, e.g., in Ziemer et al. (2016); Aures (1985); Marozeau and de Cheveigné (2007); Schneider (2018b, 1997, c); Shepard (1964); Grau and Nelson (1988); Neuhoff (2004); Zwicker and Fastl (1999); Terhardt (1981); Lichte (1941).
From our own experience in the recording studio and in psychoacoustic research, and from the above-mentioned literature, we could already combine roughness and the subjective duration of chroma change and beats to two dimensions and provide evidence for their orthogonality Ziemer et al. (2017); Ziemer (2017); Ziemer and Black (2017b). These two dimensions are briefly described in Sect. Orthogonal Qualities.
To extend our previous sonification to three dimensions, the literature suggest the use of sharpness, tonalness, and/or fullness. Unfortunately, tonalness is not an option, since a low degree of tonalness, i.e., a high degree of noisiness eliminates pitch in terms of both height and chroma. This means that tonalness is not orthogonal to any aspect of pitch. This leaves us mainly one choice: the incorporation of sharpness and fullness for the two directions of the third dimension. The signal processing to implement this has been described in Ziemer and Schultheis (2019).
The paper at hand explains how the sonification works and gives an experimental evaluation of the orthogonality of these perceptual auditory attributes. Experimental results provide evidence that all dimensions are independent from one another. The sonification is perceived as one sound, i.e., as one auditory stream in terms of auditory scene analysis Ziemer and Black (2017a). This sound has multiple orthogonal characteristics, i.e., independent perceptual auditory qualities. Each perceptual auditory quality represents another direction along the orthogonal dimensions within the Cartesian space. The magnitude of each individual quality indicates the distance along that direction.
3.2 Orthogonal Qualities
From the discussion above, we can derive an orthogonal, three-dimensional sonification. Following the idea of Ferguson et al. (2006); Peres et al. (2008), we map three orthogonal dimensions to independent psychoacoustic parameters, which are closely related to perceptual auditory qualities. Each quality stands for one direction, its magnitude for the distance along that direction. As most perceptual auditory qualities tend to have a magnitude, but no direction, two of the three dimensions are made of two independent perceptual auditory qualities, one for each direction along the dimension. The result is a three-dimensional sonification made from five psychoacoustic quantities that are summarized in table 1.
| Dim. | Dir. | Psychoac. quantity | Dist. |
|---|---|---|---|
| left | counterclockwise chroma change | speed | |
| right | clockwise chroma change | speed | |
| up | loudness fluctuation | speed | |
| down | roughness | degree | |
| front | fullness | degree | |
| back | brightness | degree |
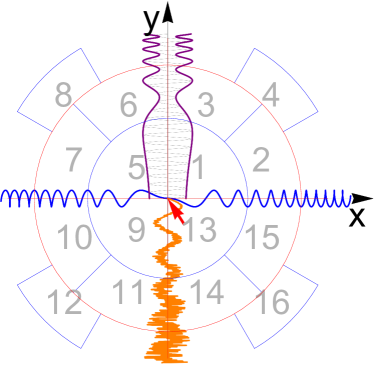
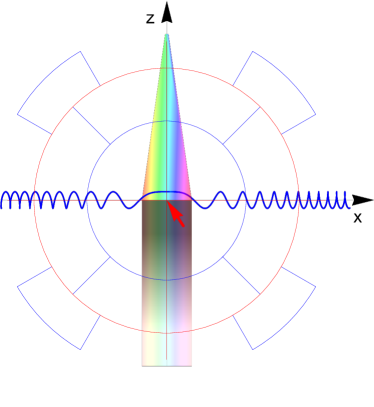
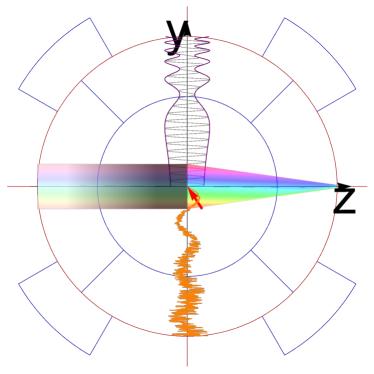
The detailed signal processing for the psychoacoustic sonification is described in Ziemer et al. (2018); Ziemer and Schultheis (2019). Figure 1 illustrates the three-dimensional sonification. The -axis is the chroma axis. At , the pitch is steady in terms of both chroma and height. Targets to the right are denoted by a clockwise motion of chroma. Most listeners perceive this as a rising pitch Shepard (1964). The further to the right, the faster the chroma cycles clockwise. In the figure the rising speed of clockwise chroma change is indicated by the blue, clockwise winding whose density of turns increases. Targets to the left are denoted by a counterclockwise motion of chroma. Most listeners perceive this as a falling pitch Shepard (1964). The further to the left, the faster the chroma cycles counterclockwise. In the figure the counterclockwise chroma change is indicated by the blue, counterclockwise winding. The -axis is divided in two. A target above is indicated by cyclic, continuous loudness fluctuation. The distance is denoted by the fluctuation speed. The further up, the faster the fluctuation. In the graphic this is indicated by the purple envelope with increasing fluctuation density. A target below is denoted by roughness. The further down, the higher the degree of roughness. In the graphic this is indicated by the orange curve that fades from sinusoidal to random. The -dimension is also divided in two. Targets in front are denoted by fullness. The further away, the lower the degree of fullness. In the graphic this is indicated by the rainbow whose spectral bandwidth decreases. Targets in the back are denoted by brightness. The distance in this direction is denoted by the degree of brightness. In the graphic this is indicated by the visual brightness level of the rainbow.
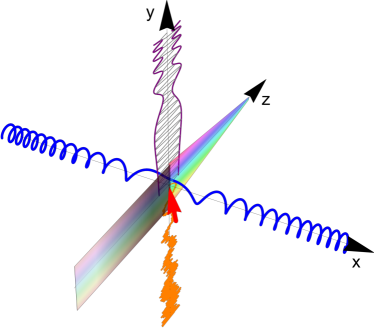
Note that the sonification is perceived as one continuous sound, i.e., as one auditory stream in terms of auditory scene analysis (Ziemer, 2020, ch. 4); Ziemer and Black (2017a). The magnitude of its perceptual auditory qualities inform about the distance along its respective direction. No reference sound is needed, as the sonification itself communicates if the target is already reached, and if not, where it is located.
4 Evaluation
In this section we describe our experimental setup to evaluate the orthogonality of the proposed dimensions for psychoacoustic sonification. Basically, we employed the same experimental setup as in of our previous study with passive listeners Ziemer et al. (2017); Ziemer and Black (2017b); Ziemer (2017). These existing results serve as a benchmark.
We repeated the experiment for the --plane to ensure that the modified signal processing did not affect the interpretability of these two dimensions. More importantly, we carried out the same experiment for the - and the - plane to evaluate whether the new -dimension is readily interpretable and orthogonal to both the - and the -dimension. We decided to stick to two dimensions at a time because this procedure is typical for evaluating orthogonality of auditory attributes Neuhoff (2004), since learning two attributes is easier for inexperienced listeners than learning three attributes. Furthermore, we already have a benchmark for two- but not for three-dimensional sonification.
We carried out the experiment with participants ( female, age between and , median = 26, mean = , ). Most participants were recruited from our near environment, i.e., mostly undergraduate and graduate computer science students. Participants volunteered to take part in the study without monetary compensation. First, the participants filled out a questionnaire, reporting age and sex, confirming that they were not aware of suffering from hearing loss, and rating their previous experience with sonification on a scale from (no experience) to (a lot of experience). Some of the participants had heard previous versions of the sonification, or were familiar with sonification, generally, from their car’s park distance control system, whereas others were completely naive concerning sonification. The participants were arbitrarily assigned to one of the three groups -, - and -, so that each group comprised participants.
To each group we first explained the psychoacoustic mapping principle, which took about minutes. First, we explained the sound attributes for the horizontal dimension in colloquial terms and imitated it with our voice. We repeated this for the vertical dimension. Then, in contrast to our earlier study, we let the participants explore the two dimensions themselves with a computer mouse for about minutes. Our hope was that this interaction with the sound would create a better understanding of the sonification, so no participant would perform at chance level.
We explained the experimental procedure to the participants. We showed them a map with fields as illustrated in the background of Figs. 2 to 4. Then, a series of sounds was played to them. Each sound was a sonification of a location in one of the fields. They could take all the time they needed to decide in what field they assumed the sonified target to be and click on it. After each click, the next target was sonified without a pause in between. Participants did not receive feedback on their choice. We told them that the order of sonified targets would be random and that a) one or more target fields might be sonified multiple times and b) not necessarily every target field would be sonified. We did this to prevent the participants from drawing conclusions from already experienced trials, like excluding fields that they had clicked before. In fact we sonified all target fields in pseudo-random order and then repeated four randomly chosen fields. Participants were allowed to adjust the volume as they like and even mute the sound occasionally, if it would help them to take a break or to concentrate better.
The experimental preparation, i.e., explanation of the mapping principle, the sonification exploration and the description of the experiment process took about minutes.
5 Results and Discussion
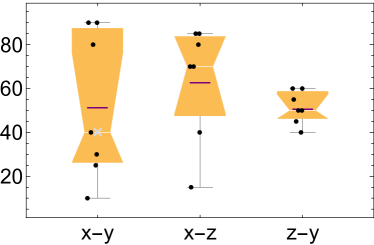
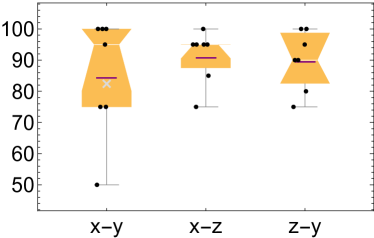
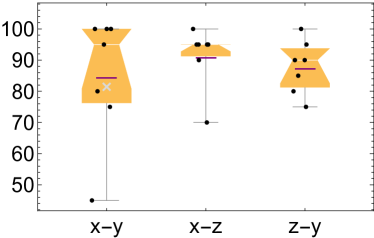
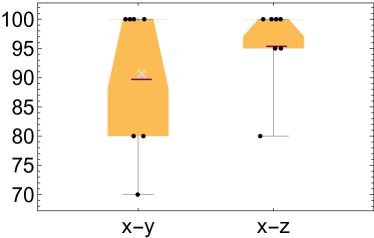
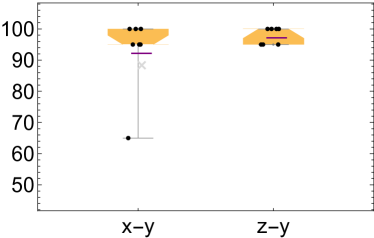
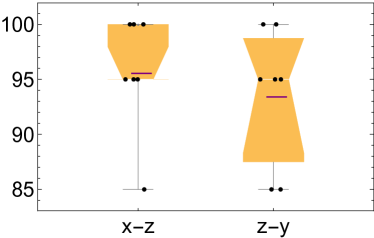
On average, it took participants roughly minutes to complete the experiment. The main results are shown in Figs. 5 to 10. The boxplots give details about user performances in the three scenarios. They show the score of each individual participant, the range, the and percentile, the median and the arithmetic mean value, and, where available, the results of our previous studies that serve as a benchmark Ziemer et al. (2017); Ziemer and Black (2017b); Ziemer (2017). Overall, one can see that the results of all three groups are comparable in magnitude to the results of our previous study.
Fig. 5 shows the hit rates of the three groups, which have a mean value between % and % and a median between % and %. Binomial tests indicated that the hit rate of every single participant was significantly higher than expected by chance (all s). Accordingly, every participant was able to interpret the sonification. Fig. 6 shows the number of correct quadrants, having a mean value between % and % and a median between % and %. Fig. 7 shows how frequently the correct field or its direct neighbor was identified. Here, as for the quadrants, the mean value lay between % and % and the median between % and %. Figs.8 to 10 show how often the -, -, or -direction was identified correctly by the participants. Here, the arithmetic mean lay between % and %, the median between % and %. All these measures clearly show that the participants performed similarly well in all groups, and about as good as in our previous experiment, that had already been validated by an interactive experiment Ziemer and Schultheis (2018b).
Of particular interest was to what extent previous experience with sonification had an influence on performance and also to what extent the different axis combinations were easier/harder to use than others. To investigate these two questions we proceeded as follows. First, we split participants into two groups based on experience: one group considered experienced (rating ) and the other considered inexperienced (rating ). We have both cases in each group, i.e., vs. in -, vs. in -, and vs. -. On average, the participants rated their previous experience with sonification with (median = ) .Our evaluation measures — i.e., number of hits, correct quadrants, correctly identified field or neighbor, correct left/right direction and correct up/down direction — exhibit relatively high correlation (), as, for example a hit naturally comes along with a correct left/right and up/down direction, etc. We therefore carried out a Principal Component Analysis, to summarize the performance of the participants. Here, the first component explained % of the variance and the load of all measures on the component ranged between and . Two-way analysis of variance (ANOVA) revealed no significant effect of previous experience and/or group on the results in terms of the first principal components().
We have demonstrated already in Ziemer et al. (2017); Ziemer and Schultheis (2018b), that the - and -dimensions are orthogonal. Hence, we can conclude from the results of the statistical tests that also the new -dimension is orthogonal to the previous ones, as the -- and --group reveal no significant difference in terms of performance. This finding confirms that the new dimension is orthogonal to the and the dimension. The new dimension is equally well-combinable with the and the dimension. The fact that some participants have heard previous versions of the sonification before did not affect the results.
We observe that the --group in this experiment performed better than in our previous study Ziemer et al. (2017); Ziemer (2017). The main reason for this may be that we optimized the mapping based on the results of the previous study. Another reason may be the slight difference in the signal processing between Ziemer et al. (2018) and Ziemer and Schultheis (2019). Furthermore, letting the participants interactively explore the single and the combined audible dimensions may have improved their understanding of the perceptual auditory qualities and the psychoaocustic mapping principle.
| t1 | t2 | t3 | t4 | t5 | t6 | t7 | t8 | t9 | t19 | t11 | t12 | t13 | t14 | t15 | t16 | |
|---|---|---|---|---|---|---|---|---|---|---|---|---|---|---|---|---|
| t1 | ||||||||||||||||
| t2 | ||||||||||||||||
| t3 | ||||||||||||||||
| t4 | ||||||||||||||||
| t5 | ||||||||||||||||
| t6 | ||||||||||||||||
| t7 | ||||||||||||||||
| t8 | ||||||||||||||||
| t9 | ||||||||||||||||
| t10 | ||||||||||||||||
| t11 | ||||||||||||||||
| t12 | ||||||||||||||||
| t13 | ||||||||||||||||
| t14 | ||||||||||||||||
| t15 | ||||||||||||||||
| t16 |
Tables 2 to 4 are tables of confusion. They show the relationship between sonified and clicked target fields not with a focus on the individual participant but on the individual field. Here, each row represents a sonified target field and the columns indicate the target as selected by the participants. The elements in the table indicate how frequently each field was marked as the target field by the participants. Consequently, the total of each row is %. In addition to the numbers, the frequency is also indicated by gray level from white ( %) to black (%). The four quadrants are separated by double lines to highlight how many false clicks fall into the right quadrant. These tables help to get a further impression of whether the distributions of clicked targets differs significantly from random clicks, whether the participants performed similarly well in all three dimension pairs, and whether the distribution is roughly uniform across the whole two-dimensional spaces.
One can clearly see the dark diagonal lines, which indicates that the target field was typically correctly identified most frequently in all three groups. The correct field was identified in to % of all trials. Only in two to three out of cases per group the most frequently chosen field did not coincide with the sonified target field. Most confusions were between the target and other fields from the same quadrant. For most sonified targets, only three to four fields have been clicked at all. Only for very few targets, more than four different fields have been clicked by participants, namely t10 and t15 in group -, none in group -, and t9 and t14 in group -. Some targets were only confused with one other target. This was the case for t1, t5, t11 in group - and for t6, t7, t10 in group -. The - group identified the outermost fields well, i.e., t4, t8, t12 and t16, and did not click on them, when any other target was sonified. The same is true for fields t4, t6, t9 and t13 for the - group and for t3, t4 and t9 in the - group. From visual inspection, all three tables seem similar to each other. This observation is confirmed by Kendall’s test. After vectorization of the confusion matrices to one-dimensional vectors, the three show a fair but highly significant rank correlation (, between - and -, , between - and -, and , ). This observation supports the finding from the ANOVA, i.e., that group did not have a significant effect on performance. The fair correlation is owed to the fact that all three share the strong diagonal. But the participants did not confuse the same fields in all three groups. The two groups with the new dimension exhibit similarities with the - pair, which has already been shown to be orthogonal. This suggests that each dimension can be interpreted correctly during the presence of a second dimension, which indicates that all three dimensions are orthogonal.
6 Conclusion
In this work we have highlighted the need of perceptually orthogonal dimensions for multidimensional or multivariate data sonification. We suggest five psychoacoustic quantities that can serve as three orthogonal dimensions. Experimental results show that these dimensions are learnable by inexperienced listeners under passive conditions. Participants were able to interpret the direction and distance of a sonified location in all two-dimensional pairs of the three-dimensional space. As our previous experiment on two-dimensional sonification Ziemer and Schultheis (2018b) has shown, the accuracy was much higher when participants interacted with the sound instead of listening passively. Furthermore, its resolution had been proven to be very high and the axes had been perceived as linear. Interactive experiments with the newly developed three-dimensional sonification will reveal whether the third dimension has the same qualities concerning accuracy, resolution and linearity.
7 Outlook
As “(…) is critical to examine performance longitudinally when evaluating auditory display designs” Walker and Lindsay (2003), we are designing a game to motivate users for long-term interaction with the sonification. Progress on the game can be found on http://curat.informatik.uni-bremen.de/. In addition to interactive experiments to evaluate the sonification itself, we plan to evaluate the benefit of the sonification in a potential application area, like an image-guided surgery scenario.
8 Key Points
-
•
We discussed the problem of low interpretability due to a lack of orthogonality in multidimentional/multivariate sonification
-
•
We identified a number of auditory attributes that seem perceptually orthogonal
-
•
We implemented them in a psychoacoustic sonification
-
•
Our experiment revealed that all three dimensions are in fact orthogonal to each other
References
- Anderson and Sanderson (2004) Anderson J and Sanderson P (2004) Designing sonification for effective attentional control in complex work domains. In: Proc. Human Factors and Ergonomins Society 48th annual meeting. New Orleans, LA. 10.1037/e577082012-006.
- Anderson and Sanderson (2009) Anderson JE and Sanderson P (2009) Sonification design for complex work domains: Dimensions and distractors. Journal of Experimental Psychology: Applied 15(3): 183–198. 10.1037/a0016329. URL http://dx.doi.org/10.1037/a0016329.
- Arfib et al. (2002) Arfib D, Couturier J, Kessous, L and Verfaille V (2002) Strategies of mapping between gesture data and synthesis model parameters using perceptual spaces. Journal of Organised Sound 7(2): 127–144. 10.1017/S1355771802002054.
- Aures (1985) Aures W (1985) Berechnungsverfahren für den sensorischen wohlklang beliebiger schallsignale (a model for calculating the sensory euphony of various sounds). Acustica 59(2): 130–141.
- Barrass (1994) Barrass S (1994) A perceptual framework for the auditory display of scientific data. In: International Conference on Auditory Display. Santa Fe, pp. 131–145. URL http://hdl.handle.net/1853/50821.
- Barrass (1997) Barrass S (1997) Auditory Information Design. PhD Thesis, Australian National University, Canberra. URL http://hdl.handle.net/1885/46072.
- Black et al. (2017) Black D, Hettig J, Luz M, Hansen C, Kikinis R and Hahn H (2017) Auditory feedback to support image-guided medical needle placement. International Journal of Computer Assisted Radiology and Surgery 12(9): 1655–1663. 10.1007/s11548-017-1537-1. URL http://dx.doi.org/10.1007/s11548-017-1537-1.
- Bliss and Spain (2007) Bliss JP and Spain RD (2007) Sonification and reliability — implications for signal design. In: ICAD. Montréal, pp. 154–159. URL http://hdl.handle.net/1853/50028.
- Bly (1982) Bly S (1982) Sound and computer information presentation. PhD Thesis, University of California. 10.2172/5221536.
- Bovermann et al. (2011) Bovermann T, Rohrhuber J and de Campo A (2011) Laboratory methods for experimental sonification. In: Hermann T, Hunter A and Neuhoff JG (eds.) The Sonification Handbook, chapter 10. Berlin: COST and Logos, pp. 237–272. URL http://sonification.de/handbook/.
- Bregman (1990) Bregman AS (1990) Auditory Scene Analysis. Cambridge, MA: MIT Press.
- Brewster (2003) Brewster S (2003) Nonspeech auditory output. In: Jacko JA and Sears A (eds.) The Human-Computer Interaction Handbook. London: Lawrence Erlbaum Associates, pp. 220–239.
- Degara et al. (2013a) Degara N, Kuppanda T and Nagel F (2013a) The walking game: A framework for evaluating sonification methods in blind navigation. In: Proceedings of the 4th Interactive Sonification Workshop (ISon2013). Erlangen.
- Degara et al. (2014) Degara N, Kuppanda T, Neate T, Yang J and Torres AV (2014) Reproducible sonification for virtual navigation. In: 2014 IEEE VR Workshop: Sonic Interaction in Virtual Environments (SIVE). pp. 35–40. 10.1109/SIVE.2014.7006288.
- Degara et al. (2013b) Degara N, Nagel F and Hermann T (2013b) Sonex: An evaluation exchange framework for reproducible sonification. In: Proceedings of the 19th International Conference on Auditory Display (ICAD2013). Lodz. URL http://hdl.handle.net/1853/51662.
- Ferguson and Brewster (2017) Ferguson J and Brewster SA (2017) Evaluation of psychoacoustic sound parameters for sonification. In: Proceedings of the 19th ACM International Conference on Multimodal Interaction, ICMI ’17. New York, NY, USA: ACM. ISBN 978-1-4503-5543-8, pp. 120–127. 10.1145/3136755.3136783. URL http://doi.acm.org/10.1145/3136755.3136783.
- Ferguson et al. (2006) Ferguson S, Cabrera D, Beilharz K and Song HJ (2006) Using psychoacoustical models for information sonification. In: 12th International Conference on Auditory Display (ICAD2006). London. URL http://hdl.handle.net/1853/50694.
- Florez (1936) Florez L (1936) True blind flight. Journal of the Aeronautical Sciences 3(5): 168–170. 10.2514/8.176. URL http:doi.org/10.2514/8.176.
- Garner (1974) Garner WR (1974) The processing of information and structure. Oxford: Lawrence Erlbaum.
- Ghez et al. (2000) Ghez C, Rikakis T, DuBois RL and Cook PR (2000) An auditory display system for aiding interjoint coordination. In: ICAD. Atlanta (GO). URL http://www.icad.org/websiteV2.0/Conferences/ICAD2000/PDFs/LukeGhez.pdf.
- Grau and Nelson (1988) Grau JW and Nelson DK (1988) The distinction between integral and separable dimensions: Evidence for the integrality of pitch and loudness. J. Experimental Psychol.: Gen. 117(4): 347–370. 10.1037/0096-3445.117.4.347.
- Gray (2011) Gray R (2011) Looming auditory collision warnings for driving. Human Factors 53(11): 63–74. 10.1177/0018720810397833. URL http://doi.org/10.1177/0018720810397833.
- Grond (2013) Grond F (2013) Listening-Mode-Centered Sonification Design for Data Exploration. PhD Thesis, Universität Bielefeld, Bielefeld.
- Hellier et al. (1993) Hellier EJ, Edworthy J and Dennis I (1993) Improving auditory warning design: Quantifying and predicting the effects of different warning parameters on perceived urgency. Human Factors 35(4): 693–706.
- Hermann (2002) Hermann T (2002) Sonification for Exploratory Data Analysis. PhD Thesis, Bielefeld University, Bielefeld. URL http://www.techfak.uni-bielefeld.de/ags/ami/publications/media/Hermann2002-SFE.pdf.
- Hermann et al. (2006) Hermann T, Höner O and Ritter H (2006) AcouMotion – An Interactive Sonification System for Acoustic Motion Control, Lecture Notes in Computer Science, volume 3881. Berlin, Heidelberg: Springer, pp. 312–323. 10.1007/11678816_35. URL http://link.springer.com/chapter/10.1007%2F11678816_35.
- Huang et al. (2006) Huang H, Wolf SL and He J (2006) Recent developments in biofeedback for neuromotor rehabilitation. Journal of NeuroEngineering and Rehabilitation 3(11). 10.1186/1743-0003-3-11. URL http://www.jneuroengrehab.com/content/3/1/11.
- Hunt and Hermann (2011) Hunt A and Hermann T (2011) Interactive sonification. In: Thomas Hermann JGN Andy Hunt (ed.) The Sonification Handbook, chapter 11. Berlin: COST and Logos, pp. 273–298. URL http://sonification.de/handbook/.
- Kramer (1994) Kramer G (1994) Some organizing principles for representing data with sound. In: Kramer G (ed.) Auditory Display: Sonification, Audification, and Auditory Interfaces, Santa Fe Studies in the Science of Complexity, Proc. Vol. XVIII. Reading, MA: Addison-Wesley, pp. 223–252.
- Lichte (1941) Lichte W (1941) Attributes of complex tones. J. Exp. Psychol. 28: 455–481.
- Lokki and Gröhn (2005) Lokki T and Gröhn M (2005) Navigation with auditory cues in a virtual environment. IEEE MultiMedia 12(2): 80–86. 10.1109/MMUL.2005.33.
- Marozeau and de Cheveigné (2007) Marozeau J and de Cheveigné A (2007) The effect of fundamental frequency on the brightness dimension of timbre. Journal of the Acoustical Society of America 121: 383–387.
- Neuhoff (2004) Neuhoff JG (2004) Interacting perceptual dimensions. In: Neuhoff JG (ed.) Ecological Psychoacoustics, chapter 10. San Diego (CA): Elsevier, pp. 249–269.
- Neuhoff (2011) Neuhoff JG (2011) Perception, cognition and action in auditory displays. In: Hermann T, Hunt A and Neuhoff JG (eds.) The Sonification Handbook, chapter 4. Berlin: COST and Logos, pp. 63–85. URL http://sonification.de/handbook/.
- Neuhoff et al. (2002) Neuhoff JG, Kramer G and Wayand J (2002) Pitch and loudness interact in auditory displays: Can the data get lost in the map? Journal of Experimental Psychology: Applied 8(1): 17–25.
- Noirhomme-Fraiture et al. (2008) Noirhomme-Fraiture M, Schöller O, Demoulin C and Simoff SJ (2008) Complementing Visual Data Mining with the Sound Dimension: Sonification of Time Dependent Data. Berlin, Heidelberg: Springer Berlin Heidelberg. ISBN 978-3-540-71080-6, pp. 236–247. 10.1007/978-3-540-71080-6_15. URL https://doi.org/10.1007/978-3-540-71080-6_15.
- Parseihian et al. (2016) Parseihian G, Gondre C, Aramaki M, Ystad S and Kronland-Martinet R (2016) Comparison and evaluation of sonification strategies for guidance tasks. IEEE Trans. Multimedia 18(4): 674–686. 10.1109/TMM.2016.2531978.
- Peres et al. (2008) Peres SC, Best V, Brock D, Frauenberger C, Hermann T, Neuhoff JG, Nickerson LV, Shinn-Cunningham B and Stockman T (2008) Auditory interfaces. In: P K (ed.) HCI Beyond the GUI. Design for haptic, speech, olfactory and other nontraditional interfaces, chapter 5. Burlington, MA: Morgan Kaufman, pp. 147–195.
- Rabenhorst et al. (1990) Rabenhorst DA, Farrell EJ, Jameson DH, Linton TD and Mandelman JA (1990) Complementary visualization and sonification of multi-dimensional data. In: SPIE: Extracting Meaning from Complex Data: Processing, Display, Interaction.
- Reh et al. (2019) Reh J, Hwang TH, Schmitz G and Effenberg AO (2019) Dual mode gait sonification for rehabilitation after unilateral hip arthroplasty. Brain Sci. 9(3, 66: Special Issue: Rhythm Perception and Neural Plasticity). 10.3390/brainsci9030066.
- Sanderson et al. (2005) Sanderson PM, Watson MO and Russell WJ (2005) Advanced patient monitoring displays: Tools for continuous informing. Anesthesia & Analgesia 101(1). 10.1213/01.ANE.0000154080.67496.AE.
- Schmitz et al. (2018) Schmitz G, Bergmann J, Effenberg AO, Krewer C, Hwang TH and Müller F (2018) Movement sonification in stroke rehabilitation. Frontiers in Neurology 9: Article: 389. 10.3389/fneur.2018.00389. URL https://www.frontiersin.org/article/10.3389/fneur.2018.00389.
- Schneider (1997) Schneider A (1997) Tonhöhe–Skala–Klang. Akustische, tonometrische und psychoakustische Studien auf vergleichender Grundlage. Bonn: Orpheus-Verlag für Systematische Musikwissenschaft.
- Schneider (2018a) Schneider A (2018a) Fundamentals. In: Bader R (ed.) Springer Handbook of Systematic Musicology. Berlin, Heidelberg: Springer. ISBN 978-3-662-55004-5, pp. 559–603. 10.1007/978-3-662-55004-5_30.
- Schneider (2018b) Schneider A (2018b) Perception of timbre and sound color. In: Bader R (ed.) Springer Handbook of Systematic Musiwology, chapter 32. Berlin, Heidelberg: Springer, pp. 687–726. URL http://doi.org/10.1007/978-3-662-55004-5_32.
- Schneider (2018c) Schneider A (2018c) Pitch and pitch perception. In: Bader R (ed.) Springer Handbook of Systematic Musicology. Berlin, Heidelberg: Springer Berlin Heidelberg. ISBN 978-3-662-55004-5, pp. 605–685. 10.1007/978-3-662-55004-5_31.
- Scholz et al. (2016) Scholz DS, Rohde S, Nikmaram N, Brückner HP, Großbach M, Rollnik JD and Altenmüller EO (2016) Sonification of arm movements in stroke rehabilitation – a novel approach in neurologic music therapy. Frontiers in Neurology 7: Article ID: 106. 10.3389/fneur.2016.00106.
- Scholz et al. (2014) Scholz DS, Wu L, Pirzer J, Schneider J, Rollnik JD, Großbach M and Altenmüller EO (2014) Sonification as a possible stroke rehabilitation strategy. Frontiers in Neuroscience 8: Article 332. 10.3389/fnins.2014.00332. URL http://doi.org/10.3389/fnins.2014.00332.
- Schwarz and Ziemer (2019) Schwarz S and Ziemer T (2019) A psychoacoustic sound design for pulse oximetry. In: 25th International Conference on Auditory Display (ICAD 2019). Newcastle. 10.21785/icad2019.024. URL http://hdl.handle.net/1853/61504.
- Shepard (1964) Shepard RN (1964) Circularity in judgments of relative pitch. The Journal of the Acoustical Society of America 36(12): 2346–2353. 10.1121/1.1919362.
- Smith (1990) Smith S (1990) Representing data with sound. In: Proc. IEEE Visualization. Piscataway (NJ).
- Stewart (2010) Stewart R (2010) Spatial Auditory Display for Acoustics and Music Collections. PhD Thesis, University of London. URL https://qmro.qmul.ac.uk/xmlui/handle/123456789/413.
- Terhardt (1981) Terhardt E (1981) Aspekte und moglichkeiten der gehörbezogenen schallanalyse und -bewertung. In: Fortschritte der Akustik, DAGA ’81. Berlin: VDE-Verlag, pp. 99–110.
- Towers et al. (2014) Towers J, Burgess-Limerick R and Riek S (2014) Concurrent 3-d sonifications enable the head-up monitoring of two interrelated aircraft navigation instruments. Human Factors 56(8): 1414–1427. 10.1177/0018720814536443.
- Vasilijevic et al. (2016) Vasilijevic A, Vukic Z and Miskovic N (2016) Teleoperated trajectory tracking of remotely operated vehicles using spatial auditory interface. In: IFAC PapersOnLine, volume 49. pp. 079–102.
- Visell et al. (2013) Visell Y, Murray-Smith R, Brewster SA and Williamson J (2013) Continuous auditory and tactile interaction design. In: Serafin K Stefania amd Franinovic (ed.) Sonic Interaction Design, chapter 3. Cambridge, MA: MIT Press, pp. 77–123.
- Walker and Kramer (2004) Walker BN and Kramer G (2004) Ecological psychoacoustics and auditory displays: Hearing, grouping, and meaning making. In: Neuhoff JG (ed.) Ecological Psychoacoustics, chapter 6. Amsterdam: Elsevier, pp. 149–174.
- Walker and Lindsay (2003) Walker BN and Lindsay J (2003) Effect of beacon sounds on navigation performance in a virtual reality environment. In: Proceedings of the 2003 International Conference on Auditory Display (ICAD2003). Boston, MA, pp. 204–207.
- Walker and Lindsay (2006) Walker BN and Lindsay J (2006) Navigation performance with a virtual auditory display: Effects of beacon sound, capture radius, and practice. Human Factors 48(2): 265–278.
- Walker and Nees (2011) Walker BN and Nees MA (2011) Theory of sonification. In: Hermann T, Hunt A and Neuhoff JG (eds.) The Sonification Handbook, chapter 2. Berlin: COST and Logos, pp. 9–39. URL http://sonification.de/handbook/.
- Watson and Sanderson (2004) Watson M and Sanderson P (2004) Sonification supports eyes-free respiratory monitoring and task time-sharing. Human Factors 46(3): 497–517. 10.1518/hfes.46.3.497.50401.
- Willems et al. (2005) Willems P, Noordmans H, van Overbeeke J, Viergever M, Tulleken C and von der Sprenkel JB (2005) The impact of auditory feedback on neuronavigation. Acta Neurochir 147: 167–173. 10.1007/s00701-004-0412-3.
- Williams (1994) Williams SM (1994) Perceptual principles in sound grouping. In: Kramer G (ed.) Auditory Display: Sonification, Audification and Auditory Interfaces. Reading (MA): Addison Wesley, pp. 95–126.
- Worrall (2009) Worrall D (2009) Sonification and Information. Concepts, Instruments and Techniques. PhD Thesis, University of Canberra, Canberra. URL http://worrall.avatar.com.au/papers/phd/.
- Worrall (2019) Worrall D (2019) Sonification Design. Cham: Springer. ISBN 978-3-030-01497-1. 10.1007/978-3-030-01497-1.
- Yeung (1980) Yeung ES (1980) Pattern recognition by audio representation of multivariate analytical data. Anal. Chem. 52: 1120–1123. 10.1021/ac50057a028. URL http://pubs.acs.org/doi/pdf/10.1021/ac50057a028.
- Ziemer (2017) Ziemer T (2017) Two-dimensional psychoacoustic sonification. In: Olbertz F (ed.) 33. Jahrestagung der deutschen Gesellschaft für Musikpsychologie (DGM). Hamburg, pp. 60–61. URL https://www.researchgate.net/publication/319778727_Two-dimensional_psychoacoustic_sonification.
- Ziemer (2020) Ziemer T (2020) Psychoacoustic Music Sound Field Synthesis, Current Research in Systematic Musicology, volume 7. Cham: Springer. ISBN 978-3-030-23033-3. 10.1007/978-3-030-23033-3.
- Ziemer and Black (2017a) Ziemer T and Black D (2017a) Psychoacoustic sonification for tracked medical instrument guidance. The Journal of the Acoustical Society of America 141(5): 3694. 10.1121/1.4988051. URL http://dx.doi.org/10.1121/1.4988051.
- Ziemer and Black (2017b) Ziemer T and Black D (2017b) Psychoacoustically motivated sonification for surgeons. In: International Journal of Computer Assisted Radiology and Surgery, volume 12. Barcelona, pp. 265–266. URL https://link.springer.com/article/10.1007/s11548-017-1588-3.
- Ziemer et al. (2017) Ziemer T, Black D and Schultheis H (2017) Psychoacoustic sonification design for navigation in surgical interventions. Proceedings of Meetings on Acoustics 30. 10.1121/2.0000557. URL http://asa.scitation.org/doi/abs/10.1121/2.0000557.
- Ziemer and Schultheis (2018a) Ziemer T and Schultheis H (2018a) A psychoacoustic auditory display for navigation. In: 24th International Conference on Auditory Displays (ICAD2018). Houghton, MI. 10.21785/icad2018.007. URL http://doi.org/10.21785/icad2018.007.
- Ziemer and Schultheis (2018b) Ziemer T and Schultheis H (2018b) Psychoacoustic auditory display for navigation: an auditory assistance system for spatial orientation tasks. J. Multimodal User Interfaces Special Issue: Interactive Sonification. 10.1007/s12193-018-0282-2.
- Ziemer and Schultheis (2019) Ziemer T and Schultheis H (2019) Psychoacoustical signal processing for three-dimensional sonification. In: 25th International Conference on Auditory Displays (ICAD2019). Newcastle. 10.21785/icad2019.018. URL https://smartech.gatech.edu/handle/1853/61499.
- Ziemer et al. (2018) Ziemer T, Schultheis H, Black D and Kikinis R (2018) Psychoacoustical interactive sonification for short range navigation. Acta Acustica united with Acustica 104(6): 1075–1093. 10.3813/AAA.919273. URL https://www.ingentaconnect.com/content/dav/aaua/2018/00000104/00000006/art00018.
- Ziemer et al. (2016) Ziemer T, Yu Y and Tang S (2016) Using psychoacoustic models for sound analysis in music. In: Proceedings of the 8th Annual Meeting of the Forum on Information Retrieval Evaluation, FIRE ’16. New York, NY, USA: ACM. ISBN 978-1-4503-4838-6, pp. 1–7. 10.1145/3015157.3015158. URL http://doi.acm.org/10.1145/3015157.3015158.
- Zwicker and Fastl (1999) Zwicker E and Fastl H (1999) Psychoacoustics. Facts and Models. second updated edition. Berlin, Heidelberg: Springer. 10.1007/978-3-662-09562-1.