Stars and their variability observed from space
R-mode oscillations in eclipsing binaries
Abstract
The presence of r mode oscillations (global modes of Rossby waves coupled with buoyancy) in an eclipsing binary is recognized as frequency groups in a frequency-amplitude diagram obtained from a Fourier analysis of Kepler light curve data. The frequency at the upper bound of an r-mode frequency group is close to the rotation frequency of the star. Analysing about eight hundred Kepler light curves of eclipsing binaries finds about seven hundred cases showing the signature of r modes. Sometimes two sets of the frequency groups are found, which indicates the two component stars to have slightly different rotation frequencies. Plotting thus obtained rotation frequencies with respect to orbital frequencies, we find that rotation is roughly synchronous to the orbital frequency if the latter is larger than about 1 c/d, while some stars rotate super-synchronously in systems with longer orbital periods.
keywords:
Stars:binaries:eclipsing, Stars:oscillations, Stars:rotation1 Introduction
Possible presence of r mode oscillations (global modes of Rossby waves coupled with buoyancy; sometimes called ‘rossby modes’) in rotating stars has been discussed theoretically for long (e.g., Papaloizou & Pringle 1978; Provost et al. 1981; Saio 1982). But the first clear evidence of r modes was discovered only recently by Van Reeth et al. (2016) in Kepler data of rapidly rotating Dor variables; the evidence of r modes is the period-spacing increasing with period, while the period spacing of prograde g modes decreases with period. Later, from the period-spacing property Li et al. (2019a, b) found r modes in a large fraction of rapidly rotating Dor stars.
Another property of r modes is a frequency group located just below the rotation frequency in frequency-amplitude diagrams, which is useful to identify r modes when each frequency in the group cannot be resolved. From this property Saio et al. (2018); Saio (2018) found r modes in Kepler data for spotted early-type stars, binary stars, chemically-peculiar stars, and Be stars. Saio (2019) discusses that short period oscillations observed in accreting white dwarfs in cataclysmic variables are consistent with r mode oscillations. We note that this possibility was already discussed more than 40-years ago by Papaloizou & Pringle (1978).
Here, we discuss r mode oscillations in eclipsing binaries adopting Kepler data from the Kepler Eclipsing Binary Catalog (KEBC) V3 maintained by the eclipsing binary working group (e.g. Kirk et al. 2016; Matijevič et al. 2012; Slawson et al. 2011; Prša et al. 2011, http://keplerebs.villanova.edu/). We identify r modes from the property of frequency groups in frequency-amplitude diagrams, which will be discussed below.
2 Basic properties of r modes
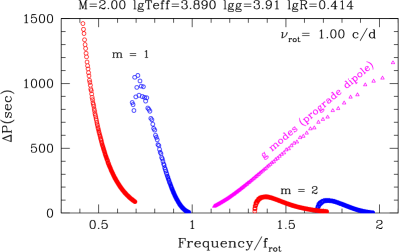
R-modes are normal modes of large scale Rossby waves, which have nearly toroidal motions but couple with buoyancy due to the effect of Coriolis force. In the co-rotating frame, r-modes are retrograde modes and have frequencies smaller than the rotation frequency. Therefore, in the inertial frame, r modes are observed as prograde modes with phase speeds less than the rotation speed, and the frequencies of r modes with azimuthal order (; we adopt in this paper the convention that for retrograde modes in the co-rotating frame) are less than with being cyclic frequency of rotation. Period spacing in the co-rotating frame is roughly constant (see e.g. Saio et al. 2018, for details), while in the inertial frame, period spacing, , decreases with frequency (Fig. 1), or increases with period. The sign of the slope of with respect to frequency (or period) of r modes in the inertial frame is opposite to that of g modes. From this fact r modes can be detected convincingly if each r-mode frequency is resolved as in many amplitude-period diagrams obtained from Kepler data for Dor stars (Van Reeth et al. 2016; Li et al. 2019a, b).
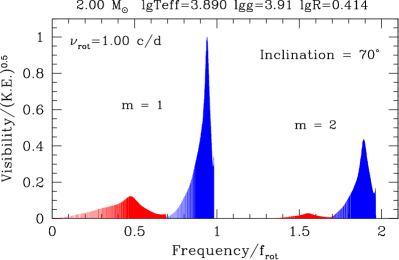
For other type variables, however, each r-mode frequency is not resolved, but r modes appear as dense frequency groups in frequency-amplitude diagrams. As seen in the right panel of Fig. 1, even (i.e., symmetric with respect to the equator) r modes, in particular mode-group, are most visible, whose frequencies are slightly lower than . In other words, if we find an r-mode frequency group of , we can estimate an approximate rotation frequency as the frequency at the upper bound of the group.
3 R modes in eclipsing binaries
From the Kepler Eclipsing Binary Catalog V3 (KEBC), 837 binaries have been chosen in a range of orbital frequencies from 0.2 to 2.5 c/d, under the condition that they were observed by Kepler longer than 3 quarters, and the primary’s effective temperatures are higher than 4000 K.
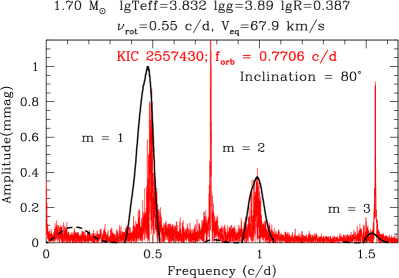
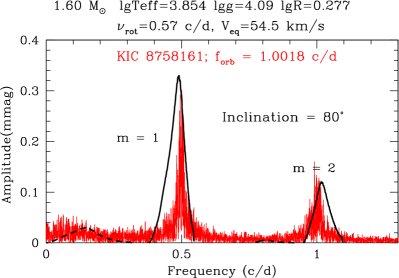
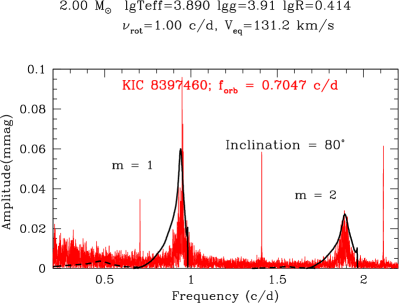
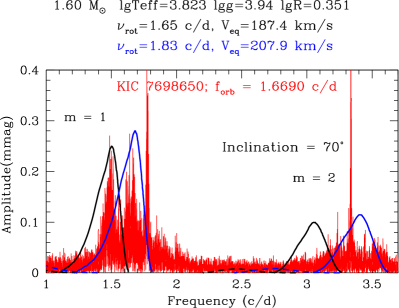
For each case, mean light curve of eclipses is subtracted from the original Kepler light-curve data using the polynomial fit given in the KEBC. A Fourier analysis by the software PERIOD04 (Lenz & Breger 2005) for the residual data yields a frequency-amplitude diagram, which is searched by eye for frequency groups attributable to r modes. R-mode features are found in 737 binaries, and among them, 320 cases show r-mode features from both components. Figs. 2 and 3 show four examples of frequency-amplitude diagrams and fits with theoretical visibility distributions of r modes (solid and dashed lines) derived from models with best-fit rotation frequencies, where model parameters were adopted by referring to the effective temperatures obtained by Armstrong et al. (2014). We note that the frequency-amplitude diagram in the right panel of Fig. 3 is an example showing r modes from both two component stars rotating at slightly different rates from each other.
4 Rotation frequencies of stars in eclipsing binaries
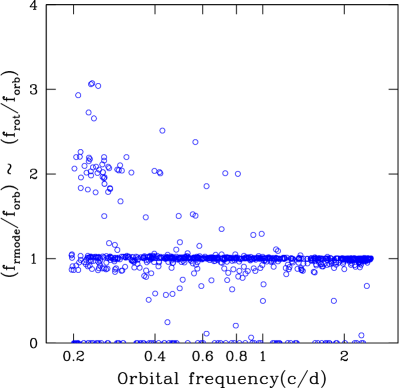
In the left panel of Fig. 4, an open circle gives the ratio of the frequency at the upper bound of the r-mode frequency group (, which should be similar to the rotation frequency) to the orbital frequency of an eclipsing binary. Non-detection cases lie on the horizontal axis. This figure indicates that stars in eclipsing binaries with orbital frequencies larger than about 1 c/d tend to rotate more-or-less synchronously to the orbital motion, while in some longer-period binaries rotation frequencies are considerably higher than orbital frequencies.
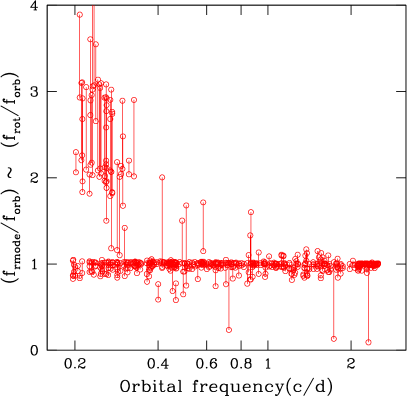
The right panel of Fig. 4 is the same as the left panel but for the eclipsing binaries which show two sets of closely separated r mode frequency groups which should correspond to r modes in each component star. If the orbital frequency is less than about 1 c/d, rotation frequencies of the two component stars sometimes differ considerably from each other.
5 Conclusions
We found that r-mode oscillations are present frequently in eclipsing binaries (737 cases are found among 837 samples), which suggests that fluid motions arisen by tidal force should generate Rossby waves and hence r-mode oscillations. Detecting r-mode frequency groups is useful to obtain a rotation frequency of a star or sometimes rotation frequencies of both components in eclipsing binaries. These rotation frequencies relative to orbital frequencies would give insight about the orbit-rotation interaction in close-binary stars.
Although the results presented in this paper are still preliminary, they seem to indicate that in the binary systems whose orbital periods are shorter than about one day, stellar rotation is more-or-less synchronized, while in the systems with longer orbital periods, stellar rotation periods can be considerably shorter than the orbital periods. Further accumulation of analyses is needed to have a clearer picture on the orbit-rotation interactions in close binaries.
Acknowledgements.
The author is very grateful to the Kepler Eclipsing Binary working group for their maintenance of the Kepler Eclipsing Binary Catalog.References
- Armstrong et al. (2014) Armstrong, D. J., Gómez Maqueo Chew, Y., Faedi, F., & Pollacco, D. 2014, MNRAS, 437, 3473
- Kirk et al. (2016) Kirk, B., Conroy, K., Prša, A., et al. 2016, AJ, 151, 68
- Lenz & Breger (2005) Lenz, P. & Breger, M. 2005, Communications in Asteroseismology, 146, 53
- Li et al. (2019a) Li, G., Van Reeth, T., Bedding, T. R., Murphy, S. J., & Antoci, V. 2019a, MNRAS, 487, 782
- Li et al. (2019b) Li, G., Van Reeth, T., Bedding, T. R., et al. 2019b, MNRAS, 2517
- Matijevič et al. (2012) Matijevič, G., Prša, A., Orosz, J. A., et al. 2012, AJ, 143, 123
- Papaloizou & Pringle (1978) Papaloizou, J. & Pringle, J. E. 1978, MNRAS, 182, 423
- Provost et al. (1981) Provost, J., Berthomieu, G., & Rocca, A. 1981, A&A, 94, 126
- Prša et al. (2011) Prša, A., Batalha, N., Slawson, R. W., et al. 2011, AJ, 141, 83
- Saio (1982) Saio, H. 1982, ApJ, 256, 717
- Saio (2018) Saio, H. 2018, arXiv e-prints, arXiv:1812.01253
- Saio (2019) Saio, H. 2019, MNRAS, 487, 2177
- Saio et al. (2018) Saio, H., Kurtz, D. W., Murphy, S. J., Antoci, V. L., & Lee, U. 2018, MNRAS, 474, 2774
- Slawson et al. (2011) Slawson, R. W., Prša, A., Welsh, W. F., et al. 2011, AJ, 142, 160
- Van Reeth et al. (2016) Van Reeth, T., Tkachenko, A., & Aerts, C. 2016, A&A, 593, A120