Robust increase in supply by vessel dilation in globally coupled microvasculature
Abstract
Neuronal activity induces changes in blood flow by locally dilating vessels in the brain microvasculature. How can the local dilation of a single vessel increase flow-based metabolite supply, given that flows are globally coupled within microvasculature? Solving the supply dynamics for rat brain microvasculature, we find one parameter regime to dominate physiologically. This regime allows for robust increase in supply independent of the position in the network, which we explain analytically. We show that local coupling of vessels promotes spatially correlated increased supply by dilation.
Vascular networks pervade all organs of animals and are the paradigm of adaptive transport networks. Their self-organized architecture continuously inspires the search for their underlying physical principles Murray (1926); West et al. (1997); Hu and Cai (2013); Ronellenfitsch and Katifori (2016); West et al. (1997) and at the same time serves as a template for designing efficient networks in engineering Zheng et al. (2017). The blood flowing through vessels transports nutrients, hormones, and metabolites to adjacent tissues. Metabolite exchange primarily occurs within the fine vessel meshwork formed by microvasculature. In the brain, local metabolite demand can abruptly rise due to an increase in neural activity Boynton et al. (1996), altering blood flow Raichle and Mintun (2006); Blinder et al. (2013) in the same brain region, observable in fMRI Logothetis (2008). During the process of increased neuronal activity, neurons signal their increased demand to adjacent astrocyte cells, which in turn trigger small ring muscles surrounding blood vessels to relax MacVicar and Newman (2015). Thus, neural activity drives local dilation of a vessel Cai et al. (2018); Hill et al. (2015), and hence regulates metabolite supply Vanzetta et al. (2005); Raichle and Mintun (2006). However, from a fluid dynamics perspective there is a mystery: blood vessels form a highly interconnected network in the microvasculature Blinder et al. (2013), resulting in a global coupling of blood flow. A single dilating vessel can potentially change the metabolite supply in a broad region of the network - and thus the local increase due to dilation is a function of specific network topology. Quantitatively, how much control over changes in blood-based supply resides in a single dilating vessel?
Models considering metabolite spread in tissue date back more than a hundred years to A. Krogh Krogh (1919). Krogh’s model estimates the supply pattern in a tissue enclosed by vessels assuming that supply is constant on all vessel walls. Yet, on a larger tissue scale, supply spatially varies along the vasculature since resources supplied upstream are not available downstream. Alternative models consider vessel-based transport Schneider et al. (2012), yet only diffusive transport is taken into account. The combined importance of advection and diffusion for transporting solutes in a single tube was discovered by G.I. Taylor Taylor (1953); Aris (1956), with subsequent work outlining modifications due to solute absorption at the tube boundary Lungu and Moffatt (1982); Shapiro and Brenner (1986); Mercer and Roberts (1994). Yet, there has been much less work capturing the coupling of advection and diffusion in tubular network structures Marbach et al. (2016); Fang et al. (2008), including solute absorption Meigel and Alim (2018). The impact of a dilating vessel is hard to estimate since not only the absorption dynamics on the level of single vessels is changed, but also solute flux throughout the network is rerouted since fluid flow and thus solute flux are globally coupled. However, to connect fMRI, which relies on a fluid dynamic signal He et al. (2018); Tian et al. (2010); Logothetis (2008), and the change in blood flow with neuronal activity Paulson et al. (2010); Cai et al. (2018); Raichle and Mintun (2006); O’Herron et al. (2016); Peppiatt et al. (2006), we need to understand how vessel dilations affect the supply with metabolites.
In this letter, we present a theoretical model to determine the change in supply resulting from the dilation of a single vessel. On the level of an individual vessel, we analytically identify three regimes, each yielding a different functional dependence of the overall supply by absorption along the vessel wall on vessel geometry, blood flow, and blood flow based solute flux. Numerically analyzing supply dynamics in a microvasculature excerpt of a rat brain supplied from the Kleinfeld laboratory Blinder et al. (2013), we find that a single regime dominates. This regime has the important property that dilating a single vessel robustly increases the supply along the dilated vessel independent of the exact location of the vessel in the network. We explain analytically how a single vessel can buffer the global coupling of solute fluxes within the network and yield a robust local increase independent of network topology. We further discuss how a single dilating vessel impacts the solute flux downstream and thereby induces spatial correlations in supply increase.
To understand how a change in flow induces changes in solute flux and supply dynamics, we first focus on a single vessel. We assume that the flow is laminar with longitudinal velocity profile Chang et al. (2017); Obrist et al. (2010), where denotes the cross-sectional averaged longitudinal flow velocity. The dispersion of soluble molecules of concentration by the fluid flow within a tubular vessel of radius and length is then given by
| (1) |
where denotes the molecular diffusivity of the solute, and and parameterize the radial and longitudinal component of the vessel. The soluble molecule is absorbed at the vessel boundary, following
| (2) |
with absorption parameter . In analogy to the derivation of Taylor Dispersion Taylor (1953); Aris (1956); Meigel and Alim (2018), we simplify the multidimensional diffusion-advection for to an equation for the cross-sectionally averaged concentration if the cross-sectional variations of the concentration are much smaller than the averaged concentration itself. This is true if the time scale to diffuse radially within the vessel is much shorter than the time scale of advection along the vessel, , if the vessel itself can be characterized as a long, slender vessel, , and if the absorption parameter is small enough to keep a shallow gradient in concentration across the vessel’s cross-section , which states that the length scale of absorption is much bigger than the vessel radius. All these approximations are valid for the rat brain microvasculature example considered here Blinder et al. (2013). With these assumptions, the concentration profile along the vessel approaches a steady state over a timescale given by (see the Supplemental Material S1 for derivation)
| (3) | ||||
| (4) |
where is the Péclet number, , and measures the ratio of absorption rate to advection rate. Note, that the concentration decays along the vessel starting from an initial concentration that itself is determined by the solute flux entering a vessel . Also for the solute influx into a vessel advective and diffusive transport contribute,
| (5) |
We define as supply of a vessel the integrated diffusive flux through the entire vessel surface of the cylindrical vessel,
| (6) |
resulting in,
| (7) |
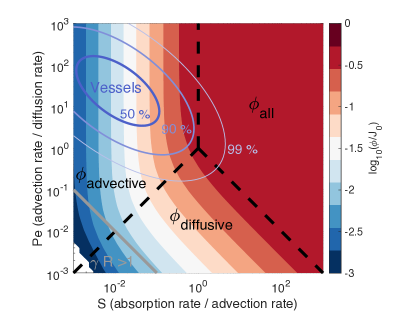
For physical intuition on how flow and vessel properties affect supply, we partition the phase space of supply dynamics spanned by and into three regimes, keeping fixed, see Fig. 1. At large values of and the solute decays very quickly along the vessel. Here, all solute that flows into the vessel of cross-sectional area is absorbed at the wall, here denoted all-absorbing regime
| (8) |
For a network this implies that after a vessel in this regime, no solute for further absorption downstream of this vessel is available, which indeed is physiologically rare, in the rat brain microvasculature considered here. A second regime occurs at , where diffusive transport dominates, here denoted diffusive regime. We distinguish a third regime, which we denote advective regime where advective transport dominates, defined by and . In both cases the solute decay is very shallow, in Eqs. (3), (6), resulting in supply independent of flow velocity, except for the dependence on the initial concentration
| (9) |
Yet, note that the reason for the solute decay, i.e. being small, arises from entirely different transport dynamics, see Fig. 1. This is reflected in the very different relation between initial solute concentration at the start of the vessel and the solute influx for the two regimes (see the Supplemental Material S1 for derivation)
| (10) | |||
| (11) |
Hence, under constant solute influx the diffusive and the advective regime show a fundamentally different, yet both non-linear dependence on the vessel radius,
| (12) | |||
| (13) |
Based on these results for a single vessel we expect largely varying increase in supply in response to vessel dilation. The coupling of flows and solute flux in a network is likely to make supply changes even more complex.
Within a network not only fluid flows are coupled with every network node obeying Kirchhoff’s law but also solute flux is conserved at every node . Here, the solute influx is determined by the inlet’s vessel inflow upstream reduced by the amount of supply, , via that vessel, see Eq. (7). The influxes downstream a node, defined by Eq. (5), follow from the solute concentration at the network node , given by
| (14) |
Thus, solute fluxes are subsequently propagated from network inlets throughout the network.
To now investigate the impact of single vessel dilation on supply within a network, we turn to an experimentally mapped rat brain microvasculature Blinder et al. (2013). The data specifies , , and for all vessels as well as the pressures at network inlets and outlets. Focussing on glucose as primary demand, we account for glucose’s diffusion constant Stein (2012) and estimate glucose’s permeability rate and include , see Supplemental Material S2. Interestingly, we find of all vessels to be in the advective regime. Is there a functional property that makes the advective regime stand out?
We next quantify the change in supply due to vessel radius dilation in a capillary bed excerpt of the mapped rat brain microvasculature excluding pial and penetrating vessels. To this end, we use the pressures given in the data set Blinder et al. (2013) and impose the pressure values at inlet and outlet vessels of a network excerpt. To be consistent with the flows determined within the data set we use a modified hydraulic vessel resistance to account for additional blood hematocrit resistance Pries (1996); Rubenstein et al. (2015) in accordance with Blinder et al. Blinder et al. (2013). Note, that a vessel’s hydraulic resistance is only important to calculate fluid flow velocities within vessels but does not modify the supply dynamics derived above. Pressures and hydraulic resistances then fully determine the flow velocities throughout the network due to Kirchhoff’s law.
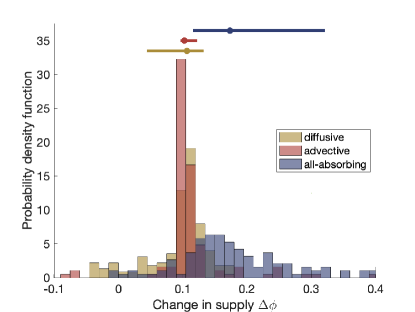
To identify differences in the behaviour of the three supply regimes that may justify the physiological abundance of the advective regime, we sample the effect of vessel dilation for all three regimes, drawing randomly 120 vessels in each regime out of the total number of 21793 vessels. The sheer total number of vessels allows us to sample underrepresented diffusive and all-absorbing regime without introducing a statistical bias due to sample size. Each vessels radius is dilated by 10%, and the flow and solute flux is recalculated throughout the network keeping the networks inlet and outlet pressures fixed. The relative change in supply in the dilated vessel itself is evaluated in a histogram, see Fig. 2. Vessels in the all-absorbing regime show a broad response to vessel dilation. Vessels in the advective regime, in contrast, peak sharply at a robust 10% increase in supply, . The diffusive regime is also somewhat peaked around , but in addition shows a significant amount of vessels with smaller supply increase of . Particularly the advective regime shows a robust increase in supply matching the increase in vessel diameter independent of the vessels’ exact position within the network topology. This observation is robust against changes in the choice of the diffusion constant and permeability rate, see Supplemental Material S6.
Despite our expectations of a non-linear change in supply from single vessel dynamics, Eqs. (12), (13), we find a robust increase of 10% for 10% vessel dilation, which would be reconciled within Eq. (9), if the initial concentration at the inlet of a dilating vessel , Eq. (14), stays constant despite changes in flow and solute flux throughout the network. Which network properties allow to stay constant? What makes the advective regime more robust than the diffusive?
Let us consider a network node, where all vessels are in the advective regime with one inlet vessel and two outlet vessels, out of the latter one is being dilated. Following Eq. (14) and the simplification of the solute fluxes from Eq. (10) for the advective regime the initial concentration at the node is
| (15) |
where Kirchhoff’s law was used for further simplification. Hence, even though vessel radius dilation induces changes in the flow, remains unchanged, though might be affected by upstream changes in the supply. However, we find that upstream effects on are small if the upstream vessels are in the advective or diffusive regime, see Supplemental Material S3 and S5, which leaves and thus approximately constant during vessel dilation. This result generalizes to good approximation to the case where the non-dilating outlet vessel is in the diffusive rather than in the advective regime, see Supplemental Material S3. Note, that the case where two inlet vessels merge into one outlet vessels is fundamentally different, as then the initial concentration at the node is a mixture from the two inlet vessels. Dilation of the outlet vessel changes flow in inlets differently and thereby changes the mixing ratio non-linearly. Physiologically, we find this pattern especially closer toward venules. Taken together, these analytical results are in agreement with the statistics of Fig. 2 and explain in particular the robust increase in supply by dilation if the vessel is in the advective regime.
We next probe why the diffusive regime is less robust and revisit the setting of one inlet and one outlet in the advective regime, and the second outlet in the diffusive regime. But now we compute the initial concentration at the node given that we dilate the vessel in the diffusive regime,
| (16) |
Now the dilation of the vessel in the diffusive regime increases the denominator and thus leads to a decrease in resulting , rendering the diffusive vessel’s response less robust compared to the advective. The same effect happens if all vessels at a node are in the diffusive regime, even more so as no vessel in the advective regime can buffer the dilation and diffusion dominated solute flux independent of flow velocity, see Eq. (11). Together, these analytical arguments explain why the diffusive regime yields a less robust increase in supply upon vessel dilation.
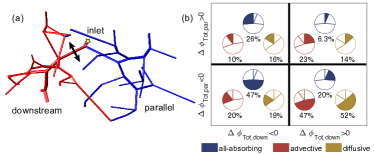
We found in Fig. 2, that the supply in upstream vessel remains approximately constant during a single vessel dilation. What is the effect on vessels downsteam the dilated vessel? For this, we focus on the dilating vessel’s immediate neighborhood and find that change in supply is spatially correlated, Fig. 3. We distinguish the vessels in the direct neighbourhood of the dilated vessel in two categories: downstream vessels are vessels that are located directly downstream of the dilated vessel and parallel vessels are vessels that are downstream the node the dilated vessels branches off, but not downstream the dilated vessel itself. The microvasculature data set is known to show predominantly loop topologies, with a median size of eight vessels within a loop Blinder et al. (2013). We thus considered only vessels with a topological distance of four vessels to the dilated vessel for the analysis of the immediate neighbourhood. We find that the typical response of a dilating vessel in both advective and diffusive regime is to increase supply downstream at the cost of reducing supply in the parallel vessels, Fig. 3 (b). More solute is drawn along the branch of the loop containing a dilating vessel than the dilating vessel itself is taking up, which increases the supply in downstream vessels. This is at the expense of the vessels in the parallel branch, reducing the supply there. See also Supplemental Material S4. While this applies qualitatively, the strength of this effect depends on the exact network topology.
We here provided a theoretical framework to investigate supply dynamics in a dynamically adapting tubular network, where flows are globally coupled by topology. We find that individual vessels can be classified in three regimes by vessel geometry and flow rate. Among those particularly the regime governed by advective transport - and to lesser extend also the regime governed by diffusive transport - yield a robust increase in supply upon vessel dilation within the dilating vessel, notably leaving the supply pattern upstream unchanged and increasing supply immediately downstream. Interestingly, the most robust advective regime is found to dominate in brain microvasculature. Our findings therefore promote that vessel dilation results in a robust increase in supply independent of the exact position of the vessel in the network. Our results are important for understanding the link between neural activity and patterns of change in supply invoked by vessel dilations and changes in blood flow underlying fMRI. Moreover, our framework is instrumental to predict drug delivery, design blood vessel architecture in synthetic organs but may also open entire new avenues for the programming of soft robotics and smart materials.
Acknowledgements.
We thank David Kleinfeld and collaborators for sharing their data on the rat brain microvasculature with us. This work was supported by the Max Planck Society and the National Science Foundation Division of Mathematical Sciences DMS 1411694 and DMS 1715477. K.A. further acknowledges the stimulating environment of American Institute of Mathematics’ Square Meetings. M.P.B. is an investigator of the Simons Foundation.References
- Murray (1926) C. D. Murray, Proc. Natl. Acad. Sci. U.S.A. 12, 207 (1926).
- West et al. (1997) G. B. West, J. H. Brown, and B. J. Enquist, Science 276, 122 (1997).
- Hu and Cai (2013) D. Hu and D. Cai, Phys. Rev. Lett. 111, 138701 (2013).
- Ronellenfitsch and Katifori (2016) H. Ronellenfitsch and E. Katifori, Phys. Rev. Lett. 117, 138301 (2016).
- Zheng et al. (2017) X. Zheng, G. Shen, C. Wang, D. Dunphy, T. Hasan, C. J. Brinker, Y. Li, and B.-L. Su, Nat. Commun. 8, 1 (2017).
- Boynton et al. (1996) G. M. Boynton, S. A. Engel, G. H. Glover, and D. J. Heeger, J. Neurosci. 16, 4207 (1996).
- Raichle and Mintun (2006) M. E. Raichle and M. A. Mintun, Annu. Rev. Neurosci. 29, 449 (2006).
- Blinder et al. (2013) P. Blinder, P. S. Tsai, J. P. Kaufhold, P. M. Knutsen, H. Suhl, and D. Kleinfeld, Nat. Neurosci. 16, 889 (2013).
- Logothetis (2008) N. K. Logothetis, Nature 453, 869 (2008).
- MacVicar and Newman (2015) B. A. MacVicar and E. A. Newman, Cold Spring Harb. Perspect. Biol. 7, a020388 (2015).
- Cai et al. (2018) C. Cai, J. C. Fordsmann, S. H. Jensen, B. Gesslein, M. Lønstrup, B. O. Hald, S. A. Zambach, B. Brodin, and M. J. Lauritzen, Proc. Natl. Acad. Sci. U.S.A. 115, E5796 (2018).
- Hill et al. (2015) R. A. Hill, L. Tong, P. Yuan, S. Murikinati, S. Gupta, and J. Grutzendler, Neuron 87, 95 (2015).
- Vanzetta et al. (2005) I. Vanzetta, R. Hildesheim, and A. Grinvald, J. Neurosci. 25, 2233 (2005).
- Krogh (1919) A. Krogh, J. Physiol. 52, 409 (1919).
- Schneider et al. (2012) M. Schneider, J. Reichold, B. Weber, G. Székely, and S. Hirsch, Med. Image Anal. 16, 1397 (2012).
- Taylor (1953) G. I. Taylor, Proc. R. Soc. Lond. A 219, 186 (1953).
- Aris (1956) R. Aris, Proc. R. Soc. Lond. A 235, 67 (1956).
- Lungu and Moffatt (1982) E. M. Lungu and H. K. Moffatt, J. Eng. Math. 16, 121 (1982).
- Shapiro and Brenner (1986) M. Shapiro and H. Brenner, Chem. Eng. Sci. 41, 1417 (1986).
- Mercer and Roberts (1994) G. N. Mercer and A. J. Roberts, Japan J. Indust. Appl. Math. 11, 499 (1994).
- Marbach et al. (2016) S. Marbach, K. Alim, N. Andrew, A. Pringle, and M. P. Brenner, Phys. Rev. Lett. 117, 178103 (2016).
- Fang et al. (2008) Q. Fang, S. Sakadzić, L. Ruvinskaya, A. Devor, A. M. Dale, and D. A. Boas, Opt. Express 16, 17530 (2008).
- Meigel and Alim (2018) F. J. Meigel and K. Alim, Roy. Soc. Interface 15, 20180075 (2018).
- He et al. (2018) Y. He, M. Wang, X. Chen, R. Pohmann, J. R. Polimeni, K. Scheffler, B. R. Rosen, D. Kleinfeld, and X. Yu, Neuron 97, 925 (2018).
- Tian et al. (2010) P. Tian, I. C. Teng, L. D. May, R. Kurz, K. Lu, M. Scadeng, E. M. C. Hillman, A. J. D. Crespigny, H. E. D’Arceuil, J. B. Mandeville, J. J. A. Marota, B. R. Rosen, T. T. Liu, D. A. Boas, R. B. Buxton, A. M. Dale, and A. Devor, Proc. Natl. Acad. Sci. U.S.A. 107, 15246 (2010).
- Paulson et al. (2010) O. B. Paulson, S. G. Hasselbalch, E. Rostrup, G. M. Knudsen, and D. Pelligrino, Journal of Cerebral Blood Flow & Metabolism 30, 2 (2010).
- O’Herron et al. (2016) P. O’Herron, P. Y. Chhatbar, M. Levy, Z. Shen, A. E. Schramm, Z. Lu, and P. Kara, Nature 534, 378 (2016).
- Peppiatt et al. (2006) C. M. Peppiatt, C. Howarth, P. Mobbs, and D. Attwell, Nature 443, 700 (2006).
- Chang et al. (2017) S.-S. Chang, S. Tu, K. I. Baek, A. Pietersen, Y.-H. Liu, V. M. Savage, S.-P. L. Hwang, T. K. Hsiai, and M. Roper, PLOS Comp. Biol. 13, e1005892 (2017).
- Obrist et al. (2010) D. Obrist, B. Weber, A. Buck, and P. Jenny, Philos. Trans. Roy. Soc. A 368, 2897 (2010).
- Stein (2012) W. D. Stein, Channels, Carriers, and Pumps: An Introduction to Membrane Transport (Academic Press, 2012).
- Pries (1996) A. Pries, Cardiovasc. Res. 32, 654 (1996).
- Rubenstein et al. (2015) D. Rubenstein, W. Yin, and M. D. Frame, Biofluid Mechanics, An Introduction to Fluid Mechanics, Macrocirculation, and Microcirculation (Academic Press, 2015).
See pages 1, of supplementRevised See pages 2, of supplementRevised See pages 3, of supplementRevised See pages 4, of supplementRevised See pages 5, of supplementRevised See pages 6, of supplementRevised See pages 7, of supplementRevised See pages 8, of supplementRevised See pages 9, of supplementRevised See pages 10, of supplementRevised See pages 11, of supplementRevised See pages 12, of supplementRevised