11email: {msingh,nupkumar}@adobe.com, abhishek.sinha94@gmail.com , kbalaji@adobe.com 22institutetext: IIT Hyderabad, India
22email: {cs17btech11029,vineethnb}@iith.ac.in
Attributional Robustness Training using Input-Gradient Spatial Alignment
Abstract
Interpretability is an emerging area of research in trustworthy machine learning. Safe deployment of machine learning system mandates that the prediction and its explanation be reliable and robust. Recently, it has been shown that the explanations could be manipulated easily by adding visually imperceptible perturbations to the input while keeping the model’s prediction intact. In this work, we study the problem of attributional robustness (i.e. models having robust explanations) by showing an upper bound for attributional vulnerability in terms of spatial correlation between the input image and its explanation map. We propose a training methodology that learns robust features by minimizing this upper bound using soft-margin triplet loss. Our methodology of robust attribution training (ART) achieves the new state-of-the-art attributional robustness measure by a margin of 6-18 on several standard datasets, ie. SVHN, CIFAR-10 and GTSRB. We further show the utility of the proposed robust training technique (ART) in the downstream task of weakly supervised object localization by achieving the new state-of-the-art performance on CUB-200 dataset. Code is available at https://github.com/nupurkmr9/Attributional-Robustness.
Keywords:
Attributional robustness; Adversarial robustness; Explainable deep learning1 Introduction
Attribution methods [12, 53, 59, 56, 55, 62, 54] are an increasingly popular class of explanation techniques that aim to highlight relevant input features responsible for model’s prediction. These techniques are extensively used with deep learning models in risk-sensitive and safety-critical applications such as healthcare [5, 38, 64, 27], where they provide a human user with visual validation of the features used by the model for predictions. E.g., in computer-assisted diagnosis, [64] showed that predictions with attribution maps increased accuracy of retina specialists above that of unassisted reader or model alone. Also, in [27], the authors improve the analysis of skin lesions by leveraging explanation maps of prediction.
It has been recently demonstrated that one could construct targeted [15] and un-targeted perturbations [19, 13] that can arbitrarily manipulate attribution maps without affecting the model’s prediction. This issue further weakens the cause of safe application of machine learning algorithms. We show an illustrative example of attribution-based attacks for image classifiers over different attribution methods in Fig. 1. This vulnerability leads to newer challenges for attribution methods, as well as robust training techniques. The intuition of attributional robustness is that if the inputs are visually indistinguishable with the same model prediction, then interpretation maps should also remain the same.
As one of the first efforts, [13] recently proposed a training methodology that aims to obtain models having robust integrated gradient [62] attributions. In addition to being an early effort, the instability of this training methodology, as discussed in [13], limits its usability in the broader context of robust training in computer vision. In this paper, we build upon this work by obtaining an upper bound for attributional vulnerability as a function of spatial correlation between the input image and its explanation map. Furthermore, we also introduce a training technique that minimizes this upper bound to provide attributional robustness. In particular, we introduce a training methodology for attributional robustness that uses soft-margin triplet loss to increase the spatial correlation of input with its attribution map. The triplet loss considers input image as the anchor, gradient of the correct class logit with respect to input as the positive and gradient of the incorrect class with highest logit value with respect to input as the negative. We show empirically how this choice results in learning of robust and interpretable features that help in other downstream weakly supervised tasks.
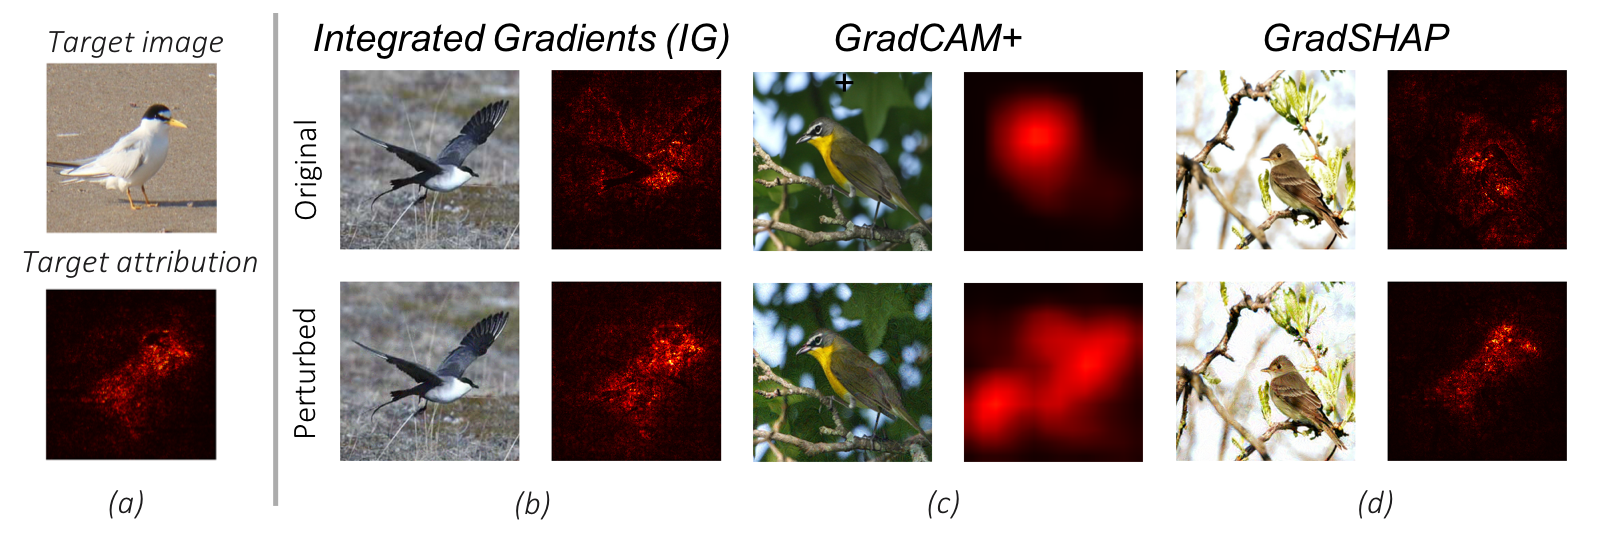
Existing related efforts in deep learning research are largely focused on robustness to adversarial perturbations [20, 63], which are imperceptible perturbations which, when added to input, drastically change the neural network’s prediction. While adversarial robustness has been explored significantly in recent years, there has been limited progress made on the front of attributional robustness, which we seek to highlight in this work. Our main contributions can be summarized as:
-
•
We tackle the problem of attribution vulnerability and provide an upper bound for it as a function of spatial correlation between the input and its attribution map [56]. We then propose ART, a new training method that aims to minimize this bound to learn attributionally robust model.
-
•
Our method outperforms prior work in this direction, and achieves state-of-the-art attributional robustness on Integrated Gradient [62] based attribution method.
- •
-
•
We show the utility of ART for other computer vision tasks such as weakly supervised object localization and segmentation. Specifically, ART achieves state-of-the-art performance in weakly supervised object localization on CUB-200 [69] dataset.
2 Related Work
Our work is associated with various recent development made in the field of explanation methods, robustness to input distribution shifts and weakly supervised object localization. We hence describe earlier efforts in each of these directions below.
Visual Explanation Methods:
Various explanation methods have been proposed that focus on producing posterior explanations for the model’s decisions. A popular approach to do so is to attribute the predictions to the set of input features [56, 60, 55, 62, 54, 7]. Sample-based explanation methods [30, 71] leverage previously seen examples to describe the prediction of the model. Concept-based explanation techniques [8, 29] aim to explain the decision of the model by high-level concepts. There has also been work that explores interpretability as a built-in property of architecture inspired by the characteristics of linear models [4]. [79, 16] provide a survey of interpretation techniques. Another class of explanation methods, commonly referred to as attribution techniques, can be broadly divided into three categories - gradient/back-propagation, propagation and perturbation based methods. Gradient-based methods attribute an importance score for each pixel by using the derivative of a class score with respect to input features [56, 55, 62]. Propagation-based techniques [7, 54, 77] leverage layer-wise propagation of feature importance to calculate the attribution maps. Perturbation-based interpretation methods generate attribution maps by examining the change in prediction of the model when the input image is perturbed [74, 47, 49]. In this work, we primarily report results on the attribution method of Integrated Gradients IG [62] that satisfies desirable axiomatic properties and was also used in the previous work [13].
Robustness of Attribution Maps:
Recently, there have been a few efforts [80, 19, 15, 13, 3] that have explored the robustness of attribution maps, which we call attributional robustness in this work. The authors of [19, 15, 80] study the robustness of a network’s attribution maps and show that the attribution maps can be significantly manipulated via imperceptible input perturbations while preserving the classifier’s prediction. Recently, Chen, J. et al.[13] proposed a robust attribution training methodology, which is one of the first attempts at making an image classification model attributionally robust and is the current state of the art. The method minimizes the norm of difference in Integrated Gradients [62] of an original and perturbed image during training to achieve attributional robustness. In this work, we approach the problem from a different perspective of maintaining spatial alignment between an image and its saliency map.
Adversarial Perturbation and Robustness:
Adversarial attacks can be broadly categorized into two types: White-box [39, 36, 10, 70] and Black-box attacks [25, 66, 2, 46]. Several proposed defense techniques have been shown to be ineffective to adaptive adversarial attacks [6, 33, 10, 9]. Adversarial training [21, 36, 58], which is a defense technique that continuously augments the data with adversarial examples while training, is largely considered the current state-of-the-art to achieve adversarial robustness. [76] characterizes the trade-off between accuracy and robustness for classification problems and propose a regularized adversarial training method. Recent work of [48] proposes a regularizer that encourages the loss to behave linearly in the vicinity of the training data, and [75] improves the adversarial training by also minimizing the convolutional feature distance between the perturbed and clean examples. Prior works have also attempted to improve adversarial robustness using gradient regularization that minimizes the Frobenius norm of the Hessian of the classification loss with respect to input[50, 40, 35] or weights [26]. For a comprehensive review of the work done in the area of adversarial examples, please refer [72, 1]. We show in our work that in addition to providing attributional robustness, our proposed method helps in achieving significant performance improvement on downstream tasks such as weakly supervised object localization. We hence briefly discuss earlier efforts on this task below.
Weakly Supervised Object Localization (WSOL):
The problem of WSOL aims to identify the location of the object in a scene using only image-level labels, and without any location annotations. Generally, rich labeled data is scarcely available, and its collection is expensive and time-consuming. Learning from weak supervision is hence promising as it requires less rich labels and has the potential to scale. A common problem with most previous approaches is that the model only identifies the most discriminative part of the object rather than the complete object. For example, in the case of a bird, the model may rely on the beak region for classification than the entire bird’s shape. In WSOL task, ADL [14], the current state-of-the-art method, uses an attention-based dropout layer while training the model that promotes the classification model to also focus on less discriminative parts of the image. For getting the bounding box from the model, ADL and similar other techniques in this domain first extract attribution maps, generally CAM-based[81], for each image and then fit a bounding box as described in [81]. We now present our methodology.
3 Attributional Robustness Training: Methodology
Given an input image with true label , we consider a neural network model with ReLU activation function that classifies into one of classes as where . Here, is the logit of . Attribution map with respect to a given class assigns an importance score to each input pixel of based on its relevance to the model for predicting the class .
3.1 Attribution Manipulation
It was shown recently [15, 19] that for standard models , it is possible to manipulate the attribution map (denoted as for simplicity in the rest of the paper) with visually imperceptible perturbation in the input by optimizing the following loss function.
| (1) | ||||
| subject to: |
where is an ball of radius centered at and is a dissimilarity function to measure the change between attribution maps. The manipulation was shown for various perturbation-based and gradient-based attribution methods.
This vulnerability in neural network-based classification models suggests that the model relies on features different from what humans perceive as important for its prediction. The goal of attributional robustness is to mitigate this vulnerability and ensure that attribution maps of two visually indistinguishable images are also nearly identical. In the next section, we propose a new training methodology for attributional robustness motivated from the observation that feature importance in image space has a high spatial correlation with the input image for robust models [65, 18].
3.2 Attributional Robustness Training (ART)
Given an input image with ground truth label and a classification model , the gradient-based feature importance score is defined as and denoted as in the rest of the paper. For achieving attributional robustness, we need to minimize the attribution vulnerability to attacks as defined in Equation 1. Attribution vulnerability can be formulated as the maximum possible change in in a -neighborhood of if is taken as gradient attribution method [56] and is a distance measure in some norm i.e.
| (2) |
We show that Equation 2 is upper bounded by the maximum of the distance between and for in neighbourhood of .
| (3) | ||||
Taking max on both sides:
| (4) |
Leveraging existing understanding [52, 24] that minimizing the distance between two quantities can benefit from a negative anchor, we use a triplet loss formulation as defined in Equation 5 with image as an anchor, as positive sample and as negative sample. More details about the selection of the optimization objective 5 and choice for the negative sample can be found in Appendix 0.A.1. Hence to achieve attributional robustness, we propose a training technique ART that encourages high spatial correlation between and by optimizing which is a triplet loss [24] with soft margin on cosine distance between and i.e.
| (5) | ||||
| where |
Hence, the classification training objective for ART methodology is:
| (6) | ||||
Here is the standard cross-entropy loss. The optimization of involves computing gradient of with respect to input which suffers from the problem of vanishing second derivative in case of ReLU activation, i.e. . To alleviate this, following previous works [15, 13], we replace ReLU with softplus non-linearities while optimizing as it has a well-defined second derivative. The softplus approximates to ReLU as the value of in increases. Note that optimization of follows the usual ReLU activation pathway. Thus, our training methodology consists of two steps: first, we calculate a perturbed image that maximizes through iterative projected gradient descent; secondly, we use as the training point on which and is minimized with their relative weightage controlled by the hyper-parameter .
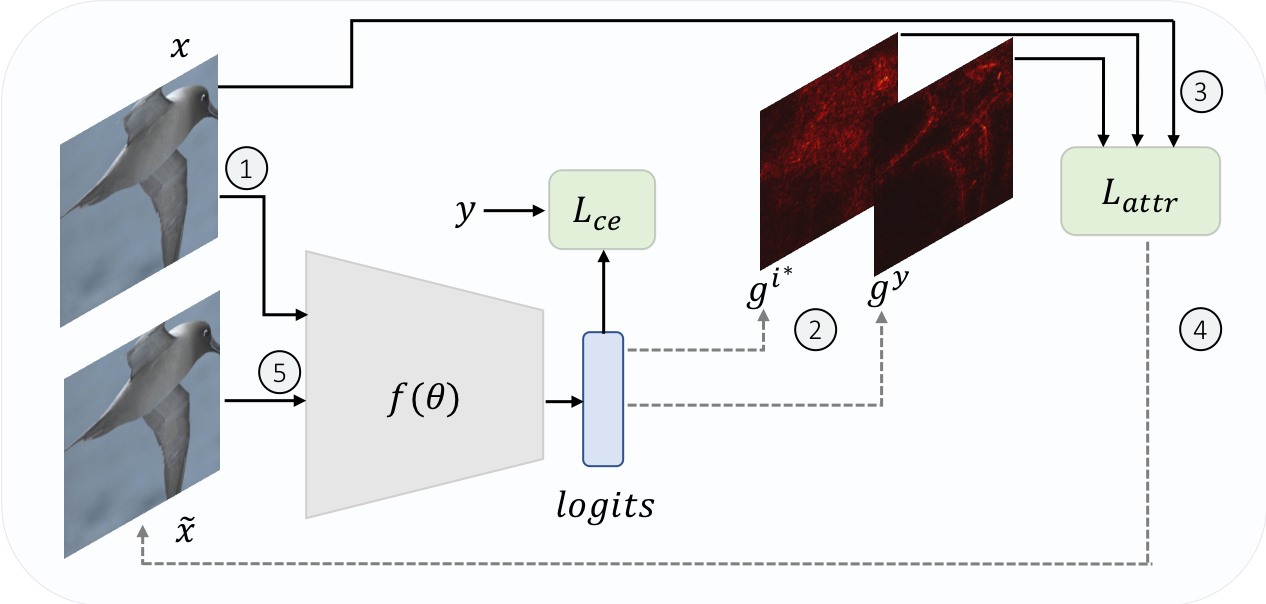
Note that the square root of cosine distance for unit norm vectors as used in our formulation of is a valid distance metric and is related to the Euclidean distance as shown in Appendix 0.A.2. Through experiments, we empirically show that minimizing the upper bound in Equation 4 as our training objective increases the attributional robustness of the model by a significant margin. The block diagram for our training methodology is shown in Fig 2, and its pseudo-code is given in Algorithm 1.
3.3 Connection to Adversarial Robustness
For a given input image , an adversarial example is a slightly perturbed image such that is small in some norm but the model classifies incorrectly. Adversarial examples are calculated by optimizing a loss function which is large when :
| (7) |
where can be the cross-entropy loss, for example. For an axiomatic attribution function which satisfies the completeness axiom i.e. , it can be shown that , as below:
| (8) | ||||
The above relationship connects adversarial robustness to attributional robustness as the maximum change in is upper bounded by the maximum change in attribution map of in its neighborhood. Also, it was shown [65] recently that for an adversarially robust model, gradient-based feature importance map has high spatial correlation with the image and it highlights the perceptually relevant features of the image. For classifiers with a locally affine approximation like a DNN with ReLU activations, Etmann et al.[18] establish theoretical connection between adversarial robustness, and the correlation of with image . [18] shows that for a given image , its distance to the nearest distance boundary is upper-bounded by the dot product between and . The authors of [18] showed that increasing adversarial robustness increases the correlation between and . Moreover, this correlation is related to the increase in attributional robustness of model as we show in Section 3.2.
3.4 Downstream Task: Weakly supervised Object localization (WSOL)
As an additional benefit of our approach, we show its improved performance on a downstream task - Weakly supervised Object localization (WSOL), in this case. The problem of WSOL deals with detecting objects where only class label information of images is available, and the ground truth bounding box location is inaccessible. Generally, the pipeline for obtaining bounding box locations in WSOL relies on attribution maps. Also, the task of object detection is widely used to validate the quality of attribution maps empirically. Since our proposed training methodology ART promotes attribution map to be invariant to small perturbations in input, it leads to better attribution maps identifying the complete object instead of focusing on only the most discriminative part of the object. We validate this empirically by using attribution maps obtained from our model for bounding-box detection on the CUB dataset and obtaining new state-of-the-art localization results.
| Dataset | Approach | Attributional Robustness | Accuracy | ||
| IN | K | Natural | PGD-40 Attack | ||
| CIFAR-10 | Natural | 40.25 | 49.17 | 95.26 | 0. |
| PGD-10 [36] | 69.00 | 72.27 | 87.32 | 44.07 | |
| ART | 92.90 | 91.76 | 89.84 | 37.58 | |
| SVHN | Natural | 60.43 | 56.50 | 95.66 | 0. |
| PGD-7 [36] | 39.67 | 55.56 | 92.84 | 50.12 | |
| ART | 61.37 | 72.60 | 95.47 | 43.56 | |
| GTSRB | Natural | 68.74 | 76.48 | 99.43 | 19.9 |
| IG Norm [13] | 74.81 | 75.55 | 97.02 | 75.24 | |
| IG-SUM Norm [13] | 74.04 | 76.84 | 95.68 | 77.12 | |
| PGD-7 [36] | 86.13 | 88.42 | 98.36 | 87.49 | |
| ART | 91.96 | 89.34 | 98.47 | 84.66 | |
| Flower | Natural | 38.22 | 56.43 | 93.91 | 0. |
| IG Norm [13] | 64.68 | 75.91 | 85.29 | 24.26 | |
| IG-SUM Norm [13] | 66.33 | 79.74 | 82.35 | 47.06 | |
| PGD-7 [36] | 80.84 | 84.14 | 92.64 | 69.85 | |
| ART | 79.84 | 84.87 | 93.21 | 33.08 | |
4 Experiments and Results
In this section, we first describe the implementation details of ART and evaluation setting for measuring the attributional and adversarial robustness. We then show the performance of ART on the downstream task of weakly supervised image localization task.
4.1 Attributional and Adversarial Robustness
4.1.1 Baselines:
We compare our training methodology with the following approaches:
-
•
Natural: Standard training with minimization of cross entropy classification loss.
- •
-
•
IG Norm and IG-SUM Norm [13]: Current state-of-the-art robust attribution training technique.
4.1.2 Datasets and Implementation Details:
To study the efficacy of our methodology, we benchmark on the following standard vision datasets: CIFAR-10 [32], SVHN [42], GTSRB [61] and Flower [43]. For CIFAR-10, GTSRB and Flower datasets, we use Wideresnet-28-10 [73] model architecture for Natural, PGD-10 and ART. For SVHN, we use WideResNet-40-2 [73] architecture. We use the perturbation in -norm for ART and PGD-n as in [36, 13]. We use , and for all experiments in the paper. For training, we use SGD optimizer with step-wise learning rate schedule. More details about datasets and training hyper-parameters are given in Appendix 0.A.3.
4.1.3 Evaluation:
For evaluating attributional robustness, we follow [13] and present our results with Integrated Gradient ()-based attribution maps. We show attributional robustness accuracy of ART on other attribution methods in Section 4. satisfies several theoretical properties desirable for an attribution method, e.g. sensitivity and completeness axioms and is defined as:
| (9) |
where is a suitable baseline at which the function prediction is neutral. For computing perturbed image on which changes drastically from , we perform Iterative Feature Importance Attack (IFIA) proposed by Ghorbani et al.[19] with bound of as used by previous work [13].
For assessing similarity between and perturbed image , we use Top-k intersection () and Kendall’s tau coefficient () similar to [13]. Kendall’s tau coefficient is a measure of similarity of ordering when ranked by values, and therefore is a suitable metric for comparing attribution maps. Top-k intersection measures the percentage of common indices in top-k values of attribution map of and . We report average of and metric over random samples of test-set. More details about the attack methodology and evaluation parameters can be found in Appendix 0.A.3.5. For evaluating adversarial robustness, we perform step PGD attack [36] using cross-entropy loss with bound of and report the model accuracy on adversarial examples. Table 1 compares attributional and adversarial robustness across different datasets and training approaches. Our proposed approach ART achieves state-of-the-art attributional robustness on attribution attacks [19] when compared with baselines. We also observe that ART consistently achieves higher test accuracy than [36] and has adversarial robustness significantly greater than that of the Natural model.
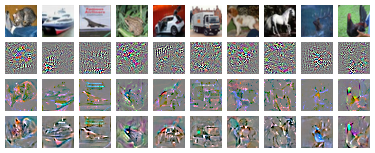

4.1.4 Qualitative study of input-gradients for ART:
Motivated by [65] which claims that adversarially trained models exhibits human-aligned gradients (agree with human saliency), we studied the same with (ART), and the results are shown in Fig 3. Qualitative study of input-gradients shows a high degree of spatial alignment between the object and the gradient. We also show image generation from random seeds in Fig 4 using robust ART model as done in [51]. The image generation process involves maximization of the class score of the desired class starting from a random seed which is sampled from some class-conditional seed distribution as defined in [51].

| Model | Method | Saliency Method | Top-1 Acc | |||
| Grad | CAM | |||||
| GT-Known Loc | Top-1 Loc | GT-Known Loc | Top-1 Loc | |||
| ResNet50-SE | ADL [14] | - | - | - | 62.29∗ | 80.34∗ |
| ResNet50 | ADL# | 52.93 | 43.78 | 56.85 | 47.53 | 80.0 |
| Natural | 50.2 | 42.0 | 60.37 | 50.0 | 81.12 | |
| PGD-7[36] | 66.73 | 47.48 | 55.24 | 39.45 | 70.3 | |
| ART | 82.65 | 65.22 | 58.87 | 46.02 | 77.51 | |
| VGG-GAP | ADL# | 63.18 | 43.59 | 69.36 | 50.88 | 70.31 |
| Natural | 72.54 | 53.81 | 48.75 | 35.03 | 72.94 | |
| ART | 76.50 | 57.74 | 52.88 | 40.75 | 74.51 | |
4.2 Weakly Supervised Image Localization
This task relies on the attribution map obtained from the classification model to estimate a bounding box for objects. We compare our approach with ADL [14]111https://github.com/junsukchoe/ADL/tree/master/Pytorch on the CUB dataset, which has ground truth bounding box of 5794 bird images. We adopt similar processing steps as ADL for predicting bounding boxes except that we use gradient attribution map instead of CAM [81]. As a post-processing step, we convert the attribution map to grayscale, normalize it and then apply a mean filtering of kernel over it. Then a bounding box is fit over this heatmap to localize the object.
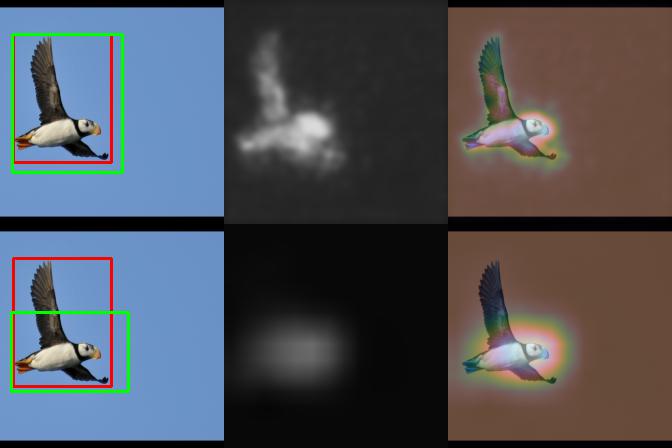
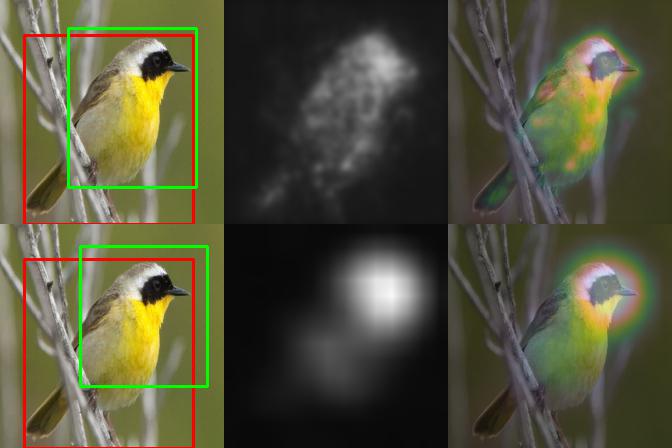
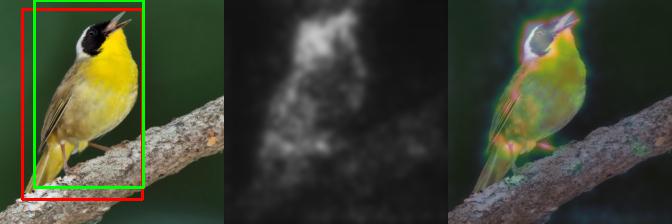
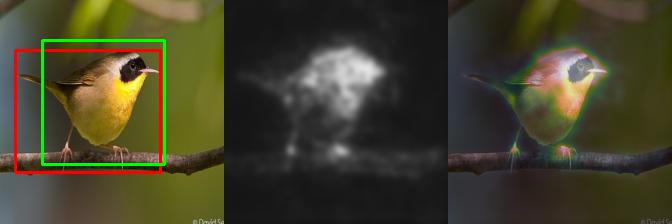
We perform experiments on Resnet-50 [22] and VGG [57] architectures. We use bound of for ART and PGD-7 training on the CUB dataset. For evaluation, we used similar metrics as in [14] i.e. GT-Known Loc: Intersection over Union (IoU) of estimated box and ground truth bounding box is atleast and ground truth is known; Top-1 Loc: prediction is correct and IoU of bounding box is atleast ; Top-1 Acc: top-1 classification accuracy. Details about dataset and training hyper-parameters are given in Appendix 0.B.1. Our approach results in higher GT-Known Loc and Top-1 Loc for both Resnet-50 and VGG-GAP [14] model as shown in Table 2. We also show qualitative comparison of the bounding box estimated by our approach with [14] in Fig 5.
5 Discussion and Ablation Studies
To understand the scope and impact of the proposed training approach ART, we perform various experiments and report these findings in this section. These studies were carried out on the CIFAR-10 dataset.
Robustness to targeted attribution attacks: In targeted attribution attacks, the aim is to calculate perturbations that minimize dissimilarity between the attribution map of a given image and a target image’s attribution map. We evaluate the robustness of ART model using targeted attribution attack as proposed in [15] using the attribution method on a batch of test examples. To obtain the target attribution maps, we randomly shuffle the examples and then evaluate ART and PGD-10 trained model on these examples. The kendall’s tau coefficient and top-k intersection similarity measure between original and perturbed images on ART was and as compared to and on the PGD-10 adversarially trained model.
| Models | GN | SN | IN | DB | Gl-B | MB | ZB | S | F | B | C | E | P | J | Sp-N |
| Natural | 49.16 | 61.42 | 59.22 | 83.55 | 53.84 | 79.16 | 79.18 | 84.53 | 91.6 | 94.37 | 87.63 | 84.44 | 74.12 | 79.76 | 65.04 |
| PGD-10 | 83.32 | 84.33 | 73.73 | 83.09 | 81.27 | 79.60 | 82.07 | 82.68 | 68.81 | 85.97 | 57.86 | 81.68 | 85.56 | 85.56 | 83.64 |
| ART | 85.44 | 86.41 | 77.07 | 86.07 | 81.70 | 83.14 | 85.54 | 84.99 | 71.04 | 89.42 | 56.69 | 84.72 | 87.64 | 87.89 | 86.02 |
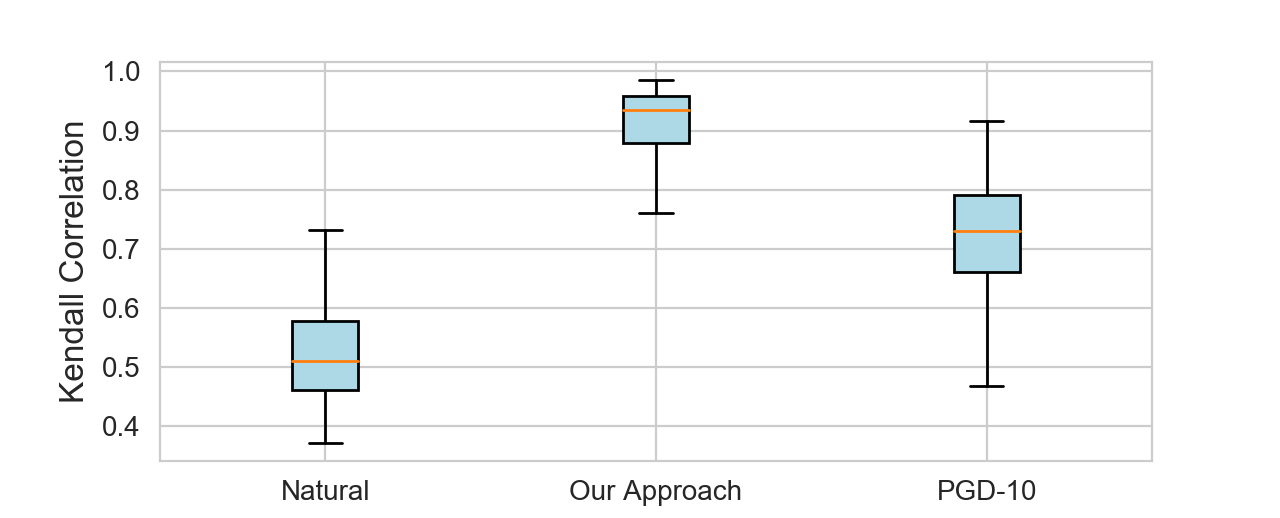
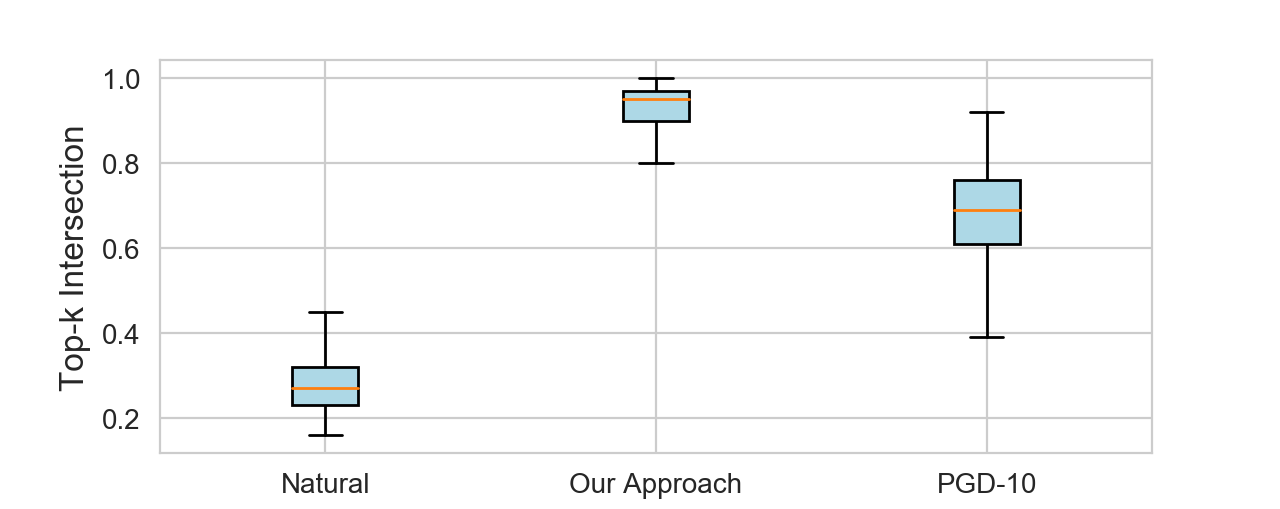
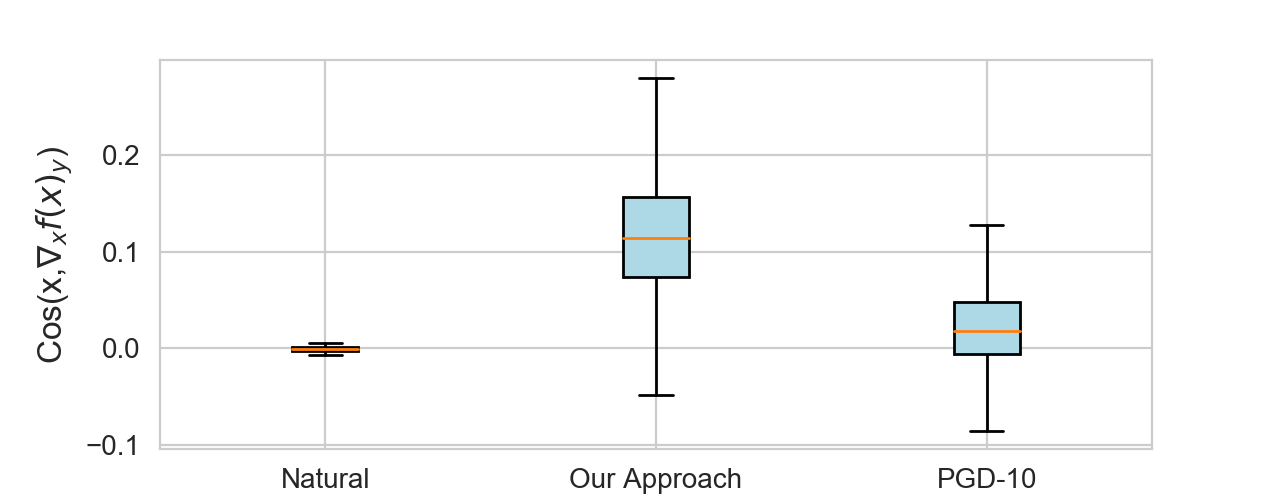
Attributional robustness for other attribution methods: We show the efficacy of ART against attribution attack [19] using gradient[56] and gradSHAP[34] attribution methods in Table 4. We observe that ART achieves higher attributional robustness than Natural and PGD-10 models on Top-k intersection (IN) and Kendall’s tau coefficient (K) measure. We also compare the cosine similarity between and for all models trained on CIFAR-10 dataset and show its variance plot in Fig. 6. We can see that ART trained model achieves higher cosine similarity Natural and PGD-10 models. This empirically validates that our optimization is effective in increasing the spatial correlation between image and gradient.
Robustness against gradient-free and stronger attacks: To show the absence of gradient masking and obfuscation [6, 9], we evaluate our model on a gradient-free adversarial optimization algorithm [66] and a stronger PGD attack with a larger number of steps. We observe similar adversarial robustness when we increase the number of steps in PGD-attack. For step and step PGD attacks, ART achieves and accuracy respectively. On the gradient-free SPSA [66] attack, ART obtains adversarial accuracy that was evaluated over random test samples.
Robustness to common perturbations [23] and spatial adversarial perturbations [17]: We compare ART with PGD-10-based adversarially trained model on the common perturbations dataset [23] for CIFAR-10. The dataset consists of perturbed images of common-place visual perturbations at five levels of severity, resulting in distinct corruptions. We report the mean accuracy over severity levels for all types of perturbations and observe that ART achieves better generalization than other models on a majority of these perturbations, as shown in Table 3. On PGD-40 norm attack with and spatial attack [17] we observe robustness of , for ART and , for PGD-10 trained model, highlighting the improved robustness provided by our method. We show more results on varying in adversarial attacks and combining PGD adversarial training [36] with ART in Appendix 0.C.
Image Segmentation: Data annotations collection for image segmentation task is time-consuming and costly. Hence, recent efforts [31, 67, 68, 28, 45, 78, 44] have focused on weakly supervised segmentation models, where image labels are leveraged instead of segmentation masks. Since models trained via our approach perform well on WSOL, we further evaluate it on weakly supervised image segmentation task for Flowers dataset [43] where we have access to segmentation masks of 849 images. Samples of weakly-supervised segmentation mask obtained from attribution maps on various models are shown in Fig. 7. We observe that attribution maps of ART can serve as a better prior for segmentation masks as compared to other baselines. We evaluate our results using Top-1 Seg metric which considers an answer as correct when the model prediction is correct and the IoU betweeen ground-truth mask and estimated mask is atleast . We compare ART against Natural and PGD-7 trained models using gradient[56] and IG [62] based attribution map. Attribution maps are converted into gray-scale heatmaps and a smoothing filter is applied as a post-processing step. We obtain a Top-1 Seg performance of , , and via IG attribution maps and , , via gradient maps for Natural, PGD-7 and ART models respectively.

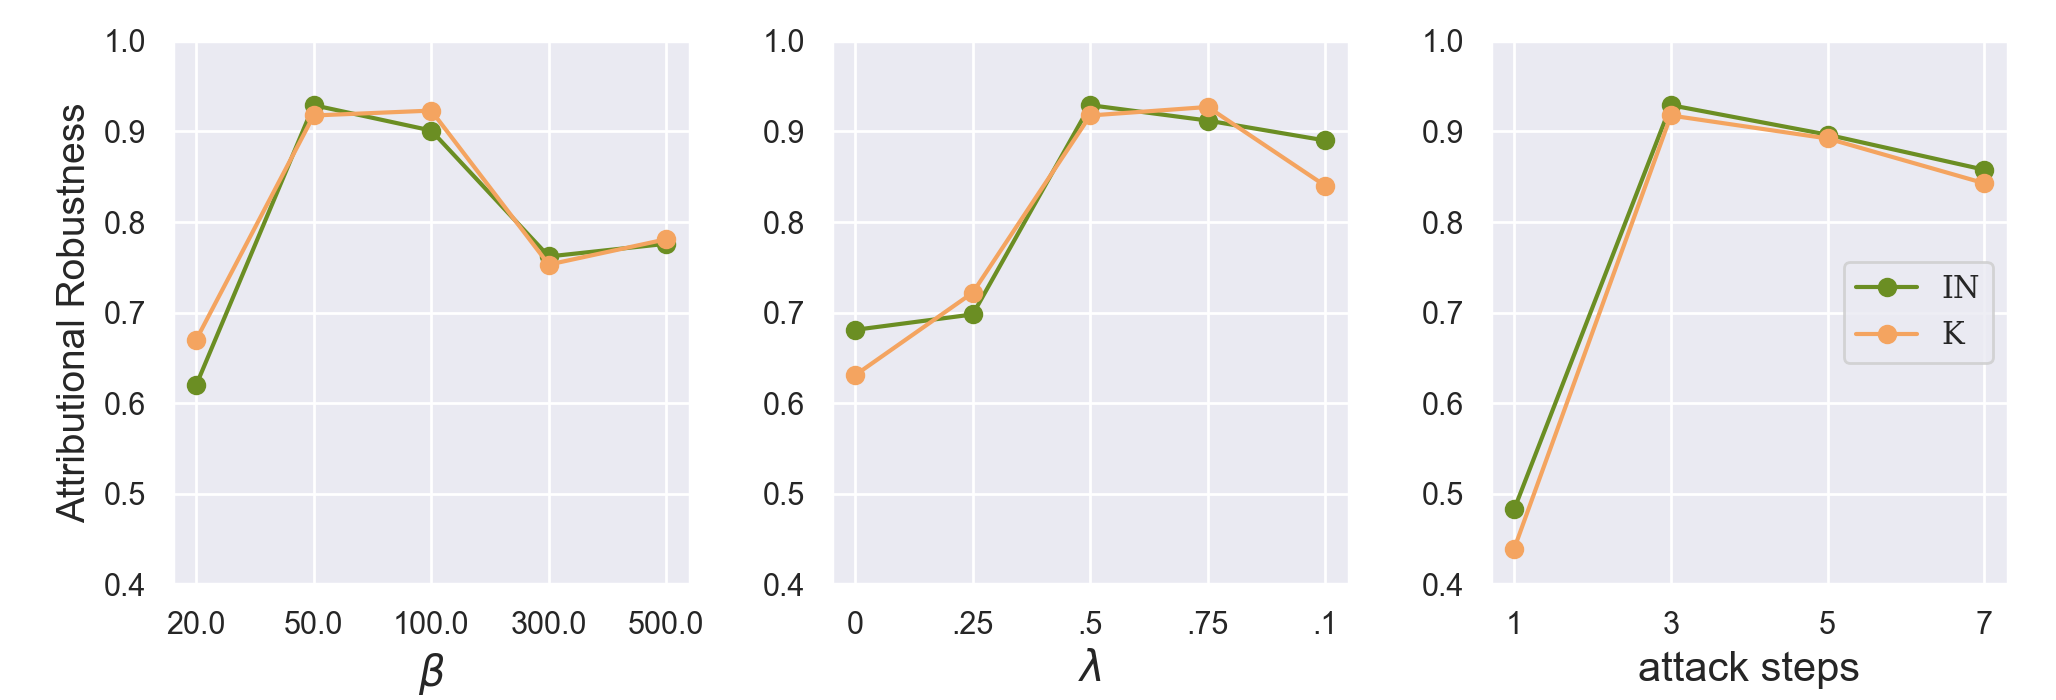
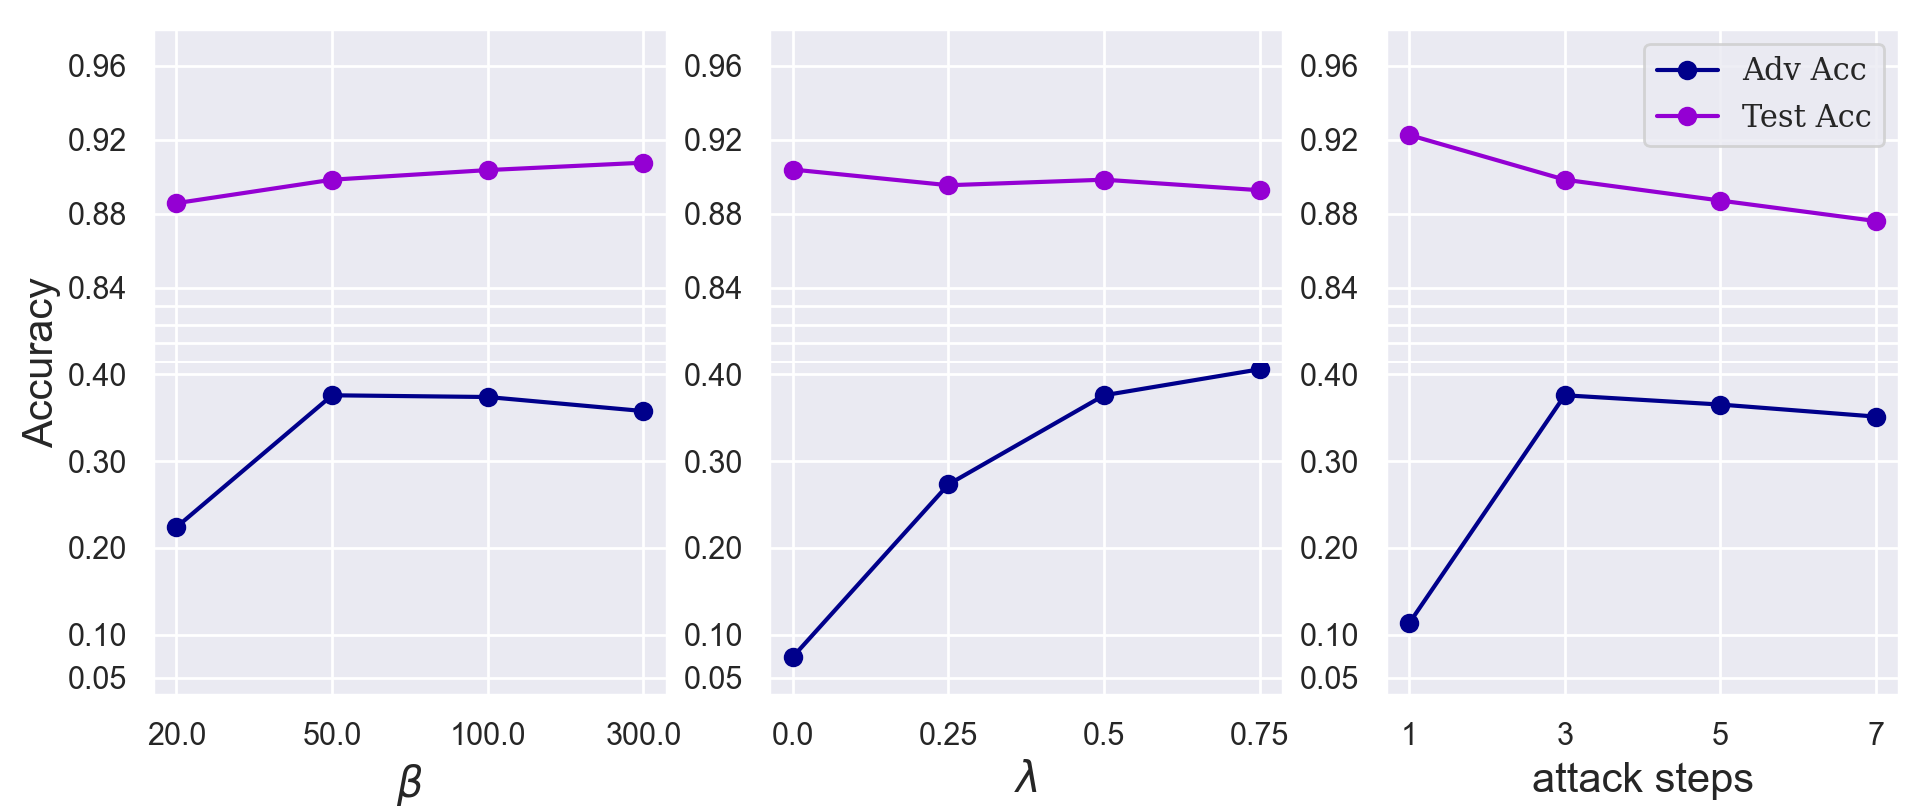
Effect of , and on performance: We perform experiments to study the role of , and as used in Algorithm 1 on the model performance by varying one parameter and fixing the others on their best-performing values, i.e. , and respectively. Fig. 8 shows the plots of attributional robustness. Fig. 9 shows the plots of test accuracy and adversarial accuracy on PGD-40 perturbations with along varying parameters. From Fig. 9, we observe that adversarial accuracy initially increases with increasing , but the trend reverses for higher values of . Similar is the trend for attributional robustness on varying as can be seen from the Fig. 8. On varying , we find that the attributional and adversarial robustness of the model increases with increasing and saturates after . However, the test accuracy starts to suffer as the magnitude of increases. For attack steps parameter , we find that the performance in terms of test accuracy, adversarial accuracy and attributional robustness saturates after as shown in the right-side plot of Fig. 8 and Fig. 9.
6 Conclusion
We propose a new method for the problem space of attributional robustness, using the observation that increasing the alignment between the object in an input and the attribution map generated from the network’s prediction leads to improvement in attributional robustness. We empirically showed this for both un-targeted and targeted attribution attacks over several benchmark datasets. We showed that the attributional robustness also brings out other improvements in the network, such as reduced vulnerability to adversarial attacks and common perturbations. For other vision tasks such as weakly supervised object localization, our attributionally robust model achieves a new state-of-the-art accuracy even without being explicitly trained to achieve that objective. We hope that our work can open a broader discussion around notions of robustness and the application of robust features on other downstream tasks.
Acknowledgements. This work was partly supported by the Ministry of Human Resource Development and Department of Science and Technology, Govt of India through the UAY program.
References
- [1] Akhtar, N., Mian, A.: Threat of adversarial attacks on deep learning in computer vision: A survey. IEEE Access (2018)
- [2] Alexey Kurakin, Ian J. Goodfellow, S.B.: Adversarial examples in the physical world. ICLR Workshop (2017)
- [3] Alvarez-Melis, D., Jaakkola, T.S.: On the robustness of interpretability methods. ICML 2018 Workshop (2018)
- [4] Alvarez-Melis, D., Jaakkola, T.S.: Towards robust interpretability with self-explaining neural networks. NeurIPS (2018)
- [5] Ardila, D., Kiraly, A.P., Choi, B., Reicher, J.J., Peng, L., Tse, D., Etemadi, M., Ye, W., Corrado, G., Naidich, D.P., Shetty, S.: End-to-end lung cancer screening with three-dimensional deep learning on low-dose chest computed tomography. Nature Medicine 25, 954––961 (2019)
- [6] Athalye, A., Carlini, N., Wagner, D.: Obfuscated gradients give a false sense of security: Circumventing defenses to adversarial examples. ICML (2018)
- [7] Bach, S., Binder, A., Montavon, G., Klauschen, F., Müler, K.R., Samek, W.: On pixel-wise explanations for non-linear classifier decisions by layer-wise relevance propagation. PLoS ONE 10(7): e0130140 (2015)
- [8] Bau, D., Zhou, B., Khosla, A., Oliva, A., Torralba, A.: Network dissection: Quantifying interpretability of deep visual representations. In: Computer Vision and Pattern Recognition (2017)
- [9] Carlini, N., Athalye, A., Papernot, N., Brendel, W., Rauber, J., Tsipras, D., Goodfellow, I., Madry, A., Kurakin, A.: On evaluating adversarial robustness. arXiv preprint arXiv:1902.06705 (2019)
- [10] Carlini, N., Wagner, D.: Towards evaluating the robustness of neural networks. In: 2017 IEEE Symposium on Security and Privacy (SP) (2017)
- [11] Chan, A., Tay, Y., Ong, Y.S., Fu, J.: Jacobian adversarially regularized networks for robustness. ICLR (2020)
- [12] Chattopadhyay, A., Sarkar, A., Howlader, P., Balasubramanian, V.N.: Grad-cam++: Generalized gradient-based visual explanations for deep convolutional networks. arXiv preprint arXiv:1710.11063 (2017)
- [13] Chen, J., Wu, X., Rastogi, V., Liang, Y., Jha, S.: Robust attribution regularization. arXiv preprint arXiv:1905.09957 (2019)
- [14] Choe, J., Shim, H.: Attention-based dropout layer for weakly supervised object localization. In: Proceedings of the IEEE Conference on Computer Vision and Pattern Recognition. pp. 2219–2228 (2019)
- [15] Dombrowski, A.K., Alber, M., Anders, C., Ackermann, M., Müller, K.R., Kessel, P.: Explanations can be manipulated and geometry is to blame. In: Advances in Neural Information Processing Systems. pp. 13567–13578 (2019)
- [16] Du, M., Liu, N., Hu, X.: Techniques for interpretable machine learning. arXiv preprint arXiv:1808.00033 (2018)
- [17] Engstrom, L., Tran, B., Tsipras, D., Schmidt, L., Madry, A.: Exploring the landscape of spatial robustness. In: International Conference on Machine Learning. pp. 1802–1811 (2019)
- [18] Etmann, C., Lunz, S., Maass, P., Schönlieb, C.B.: On the connection between adversarial robustness and saliency map interpretability. arXiv preprint arXiv:1905.04172 (2019)
- [19] Ghorbani, A., Abid, A., Zou, J.: Interpretation of neural networks is fragile. In: Proceedings of the AAAI Conference on Artificial Intelligence. vol. 33, pp. 3681–3688 (2019)
- [20] Goodfellow, I.J., Shlens, J., Szegedy, C.: Explaining and harnessing adversarial examples. In: International Conference on Learning Representations (2015)
- [21] Goodfellow, I.J., Shlens, J., Szegedy, C.: Explaining and harnessing adversarial examples. ICLR (2015)
- [22] He, K., Zhang, X., Ren, S., Sun, J.: Deep residual learning for image recognition. arXiv preprint arXiv:1512.03385 (2015)
- [23] Hendrycks, D., Dietterich, T.: Benchmarking neural network robustness to common corruptions and perturbations. Proceedings of the International Conference on Learning Representations (2019)
- [24] Hermans, A., Beyer, L., Leibe, B.: In defense of the triplet loss for person re-identification. arXiv preprint arXiv:1703.07737 (2017)
- [25] Ilyas, A., Engstrom, L., Athalye, A., Lin, J.: Black-box adversarial attacks with limited queries and information. ICML (2018)
- [26] Jakubovitz, D., Giryes, R.: Improving dnn robustness to adversarial attacks using jacobian regularization. ECCV (2018)
- [27] Jia, X., Shen, L.: Skin lesion classification using class activation map. arXiv preprint arXiv:1703.01053 (2017)
- [28] Jiang, Q., Tawose, O.T., Pei, S., Chen, X., Jiang, L., Wang, J., Zhao, D.: Weakly-supervised image semantic segmentation based on superpixel region merging. Big Data and Cognitive Computing 3(2), 31 (2019)
- [29] Kim, B., Wattenberg, M., Gilmer, J., Cai, C., Wexler, J., Viegas, F., Sayres, R.: Interpretability beyond feature attribution: Quantitative testing with concept activation vectors (tcav). ICML (2018)
- [30] Koh, P.W., Liang, P.: Understanding black-box predictions via influence functions. In: Precup, D., Teh, Y.W. (eds.) Proceedings of the 34th International Conference on Machine Learning. Proceedings of Machine Learning Research, vol. 70, pp. 1885–1894. PMLR, International Convention Centre, Sydney, Australia (06–11 Aug 2017), http://proceedings.mlr.press/v70/koh17a.html
- [31] Kolesnikov, A., Lampert, C.H.: Seed, expand and constrain: Three principles for weakly-supervised image segmentation. CoRR abs/1603.06098 (2016), http://arxiv.org/abs/1603.06098
- [32] Krizhevsky, A., Nair, V., Hinton, G.: Cifar-10. URL http://www.cs.toronto.edu/kriz/cifar.html (2010)
- [33] Logan Engstrom, Andrew Ilyas, A.A.: Evaluating and understanding the robustness of adversarial logit pairing. NeurIPS SECML (2018)
- [34] Lundberg, S.M., Lee, S.I.: A unified approach to interpreting model predictions. In: Guyon, I., Luxburg, U.V., Bengio, S., Wallach, H., Fergus, R., Vishwanathan, S., Garnett, R. (eds.) NeurIPS (2017), http://papers.nips.cc/paper/7062-a-unified-approach-to-interpreting-model-predictions.pdf
- [35] Lyu, C., Huang, K., Liang, H.N.: A unified gradient regularization family for adversarial examples. ICDM (2015)
- [36] Madry, A., Makelov, A., Schmidt, L., Tsipras, D., Vladu, A.: Towards deep learning models resistant to adversarial attacks. arXiv preprint arXiv:1706.06083 (2017)
- [37] MadryLab: cifar10_challenge. URL https://github.com/MadryLab/cifar10_challenge (2017)
- [38] Mitani, A., Huang, A., Venugopalan, S., Corrado, G.S., Peng, L., Webster, D.R., Hammel, N., Liu, Y., Varadarajan, A.V.: Detection of anaemia from retinal fundus images via deep learning. Nature Biomedical Eng. 4, 18–27 (2020)
- [39] Moosavi-Dezfooli, S.M., Fawzi, A., Frossard, P.: Deepfool: a simple and accurate method to fool deep neural networks. arXiv preprint arXiv:1511.04599v3 (2016)
- [40] Moosavi-Dezfooli, S.M., Fawzi, A., Uesato, J., Frossard, P.: Robustness via curvature regularization, and vice versa. CVPR (2019)
- [41] Moosavi-Dezfooli, S.M., Fawzi, A., Uesato, J., Frossard, P.: Robustness via curvature regularization, and vice versa. In: Proceedings of the IEEE Conference on Computer Vision and Pattern Recognition. pp. 9078–9086 (2019)
- [42] Netzer, Y., Wang, T., Coates, A., Bissacco, A., Wu, B., Ng, A.Y.: Reading digits in natural images with unsupervised feature learning. In: NIPS Workshop on Deep Learning and Unsupervised Feature Learning (2011)
- [43] Nilsback, M.E., Zisserman, A.: A visual vocabulary for flower classification. In: IEEE Conference on Computer Vision and Pattern Recognition. vol. 2, pp. 1447–1454 (2006)
- [44] Nilsback, M.E., Zisserman, A.: Delving deeper into the whorl of flower segmentation. Image Vision Comput. 28(6), 1049–1062 (Jun 2010). https://doi.org/10.1016/j.imavis.2009.10.001, http://dx.doi.org/10.1016/j.imavis.2009.10.001
- [45] Oh, S.J., Benenson, R., Khoreva, A., Akata, Z., Fritz, M., Schiele, B.: Exploiting saliency for object segmentation from image level labels. CoRR abs/1701.08261 (2017), http://arxiv.org/abs/1701.08261
- [46] Papernot, N., McDaniel, P., Goodfellow, I.J., Jha, S., Celik, Z.B., Swami, A.: Practical black-box attacks against machine learning. ACM (2017)
- [47] Petsiuk, V., Das, A., Saenko, K.: Rise: Randomized input sampling for explanation of black-box models. In: BMVC (2018)
- [48] Qin, C., Martens, J., Gowal, S., Krishnan, D., Fawzi, A., De, S., Stanforth, R., Kohli, P., et al.: Adversarial robustness through local linearization. arXiv preprint arXiv:1907.02610 (2019)
- [49] Ribeiro, M.T., Singh, S., Guestrin, C.: Why should i trust you?: Explaining the predictions of any classifier. In: ACM SIGKDD (2016)
- [50] Ross, A.S., Doshi-Velez, F.: Improving the adversarial robustness and interpretability of deep neural networks by regularizing their input gradients. AAAI (2018)
- [51] Santurkar, S., Ilyas, A., Tsipras, D., Engstrom, L., Tran, B., Madry, A.: Image synthesis with a single (robust) classifier. In: NeurIPS (2019)
- [52] Schroff, Florian an Kalenichenko, D., Philbin, J.: Facenet: A unified embedding for face recognition and clustering. CVPR (2015)
- [53] Selvaraju, R.R., Das, A., Vedantam, R., Cogswell, M., Parikh, D., Batra, D.: Grad-cam: Visual explanations from deep networks via gradient-based localization (2016)
- [54] Shrikumar, A., Greenside, P., Kundaje, A.: Learning important features through propagating activation differences. pp. 3145–3153 (2017)
- [55] Shrikumar, A., Greenside, P., Shcherbina, A., Kundaje, A.: Not just a black box: Learning important features through propagating activation differences. arXiv preprint arXiv:1605.01713 (2016)
- [56] Simonyan, K., Vedaldi, A., Zisserman, A.: Deep inside convolutional networks: Visualising image classification models and saliency maps. arXiv preprint arXiv:1312.6034 (2013)
- [57] Simonyan, K., Zisserman, A.: Very deep convolutional networks for large-scale image recognition. arXiv preprint arXiv:1409.1556 (2014)
- [58] Sinha, A., Singh, M., Kumari, N., Krishnamurthy, B., Machiraju, H., Balasubramanian, V.: Harnessing the vulnerability of latent layers in adversarially trained models. arXiv preprint arXiv:1905.05186 (2019)
- [59] Smilkov, D., Thorat, N., Kim, B., Viégas, F., Wattenberg, M.: Smoothgrad: removing noise by adding noise. Workshop on Visualization for Deep Learning, ICML (2017)
- [60] Springenberg, J.T., Dosovitskiy, A., Brox, T., Riedmiller, M.: Striving for simplicity: The all convolutional net. ICLR workshop (2015)
- [61] Stallkamp, J., Schlipsing, M., Salmen, J., Igel, C.: The German Traffic Sign Recognition Benchmark: A multi-class classification competition. In: IEEE International Joint Conference on Neural Networks. pp. 1453–1460 (2011)
- [62] Sundararajan, M., Taly, A., Yan, Q.: Axiomatic attribution for deep networks. ICML (2017)
- [63] Szegedy, C., Zaremba, W., Sutskever, I., Bruna, J., Erhan, D., Goodfellow, I.J., Fergus, R.: Intriguing properties of neural networks. ICLR (2014)
- [64] Taly, A., Joseph, A., Sood, A., Webster, D., Coz, D.D., Wu, D., Rahimy, E., Corrado, G., Smith, J., Krause, J., Blumer, K., Peng, L., Shumski, M., Hammel, N., Sayres, R.A., Barb, S., Rastegar, Z.: Using a deep learning algorithm and integrated gradient explanation to assist grading for diabetic retinopathy. Ophthalmology (2019)
- [65] Tsipras, D., Santurkar, S., Engstrom, L., Turner, A., Madry, A.: Robustness may be at odds with accuracy. In: ICLR (2019)
- [66] Uesato, J., O’Donoghue, B., Kohli, P., van den Oord, A.: Adversarial risk and the dangers of evaluating against weak attacks. ICML (2018)
- [67] Vasconcelos, M., Vasconcelos, N., Carneiro, G.: Weakly supervised top-down image segmentation. In: 2006 IEEE Computer Society Conference on Computer Vision and Pattern Recognition (CVPR’06). vol. 1, pp. 1001–1006 (June 2006). https://doi.org/10.1109/CVPR.2006.333
- [68] Vezhnevets, A., Buhmann, J.M.: Towards weakly supervised semantic segmentation by means of multiple instance and multitask learning. In: 2010 IEEE Computer Society Conference on Computer Vision and Pattern Recognition. pp. 3249–3256 (June 2010). https://doi.org/10.1109/CVPR.2010.5540060
- [69] Wah, C., Branson, S., Welinder, P., Perona, P., Belongie, S.: The Caltech-UCSD Birds-200-2011 Dataset. Tech. Rep. CNS-TR-2011-001, California Institute of Technology (2011)
- [70] Xu, K., Liu, S., Zhao, P., Chen, P.Y., Zhang, H., Fan, Q., Erdogmus, D., Wang, Y., Lin, X.: Structured adversarial attack: Towards general implementation and better interpretability. ICLR (2019)
- [71] Yeh, C.K., Kim, J.S., Yen, I.E., Ravikumar, P.: Representer point selection for explaining deep neural networks. NIPS (2018)
- [72] Yuan, X., He, P., Zhu, Q., Li, X.: Adversarial examples: Attacks and defenses for deep learning. IEEE transactions on neural networks and learning systems (2019)
- [73] Zagoruyko, S., Komodakis, N.: Wide residual networks. CoRR abs/1605.07146 (2016), http://arxiv.org/abs/1605.07146
- [74] Zeiler, M.D., Fergus, R.: Visualizing and understanding convolutional networks. In: ECCV (2014)
- [75] Zhang, H., Wang, J.: Defense against adversarial attacks using feature scattering-based adversarial training. In: NeurIPS (2019)
- [76] Zhang, H., Yu, Y., Jiao, J., Xing, E.P., Ghaoui, L.E., Jordan, M.I.: Theoretically principled trade-off between robustness and accuracy. arXiv preprint arXiv:1901.08573 (2019)
- [77] Zhang, J., Lin, Z., Brandt, J., Shen, X., Sclaroff, S.: Top-down neural attention by excitation backprop. ECCV (2016)
- [78] Zhang, L., Song, M., Liu, Z., Liu, X., Bu, J., Chen, C.: Probabilistic graphlet cut: Exploiting spatial structure cue for weakly supervised image segmentation. In: 2013 IEEE Conference on Computer Vision and Pattern Recognition. pp. 1908–1915 (June 2013). https://doi.org/10.1109/CVPR.2013.249
- [79] Zhang, Q., Zhu, S.C.: Visual interpretability for deep learning: a survey. arXiv preprint arXiv:1802.00614 (2018)
- [80] Zhang, X., Wang, N., Shen, H., Ji, S., Luo, X., Wang, T.: Interpretable deep learning under fire. arXiv preprint arXiv:1812.00891 (2018)
- [81] Zhou, B., Khosla, A., Lapedriza, A., Oliva, A., Torralba, A.: Learning deep features for discriminative localization. In: CVPR (2016)
Appendix
Appendix 0.A Attributional Robustness: Additional Details and Results
In this section, we provide details of the datasets as mentioned in the main paper (Section 4.1), as well as some additional results on attributional robustness.
We qualitatively show in Figure 10 that attribution maps generated via ART are robust to attribution manipulation unlike Natural model. We also report the Top- Intersection and Kendall’s Correlation between original and perturbed saliency maps for ART and Natural models. We use target attribution attack as mentioned in [15] to perturb the attributions while keeping the predictions same. For images in Figure 10, the model predictions are correct and the attribution maps are computed using Integrated Gradient [62]. We observe that attributions of the Natural model are visually and quantitatively fragile as attributions are easily manipulated to resemble target attribution map that is present in the rightmost column of the figure. However, it can seen from the figure that ART models show high robustness to attribution manipulations.
![[Uncaptioned image]](/html/1911.13073/assets/images/img_attr_block4.png)
|
||
![[Uncaptioned image]](/html/1911.13073/assets/images/img_attr_block3.png)
|
|
|
![[Uncaptioned image]](/html/1911.13073/assets/images/img_attr_block2.png)
|
|
|
![[Uncaptioned image]](/html/1911.13073/assets/images/img_attr_block_1.png)
|
0.A.1 Choice of optimization objective and its variants
Our choice for the loss function was based on the empirical analysis as reported in table 5 on CIFAR-10. We empirically observed that instead of directly minimizing distance between and in Equation 4 of main paper, cosine distance led to better robustness. We believe this is because cosine avoids scale mismatch issues in and magnitudes. The triplet loss is only introduced to improve performance on attributional robustness objective. For negative sample selection, we choose as second most likely class, which represents most uncertainty, following standard principles of hard negative mining in triplet loss [24, 52]. For other choices of , we observed a performance drop.
| Optimization Objective | Attributional Robustness | Test Accuracy | Adversarial Accuracy | |||
| IN | K | |||||
| Equation 2 | 74.78 | 71.40 | 91.34 | 15.15 | ||
| Equation 4 : distance | 68.41 | 69.75 | 91.66 | 16.64 | ||
| Equation 4 : Cosine distance | 91.25 | 89.28 | 89.21 | 35.95 | ||
|
90.75 | 83.32 | 89.94 | 37.93 | ||
| Equation 5 : ART (ours) | 92.90 | 91.76 | 89.84 | 37.50 | ||
0.A.2 Cosine distance in loss
Following our discussion in Sec of the main paper, we now elaborate on the relation of cosine distance in a unit -norm surface of vectors with Euclidean distance. We show below that squared Euclidean distance is proportional to the cosine distance for unit norm space of vectors. Euclidean distance is a valid distance function and follows the triangle inequality which we use in Eqn for obtaining the upper bound on attributional robustness as a function of the distance between an image and its attribution map.
Given two vectors and , with unit norm i.e. and , cosine distance between them is related to their Euclidean distance as follows:
| (10) | ||||
0.A.3 Dataset and Implementation Details
Below, we describe the datasets and hyper-parameters used for experiments, which we could not include in the main paper owing to space constraints.
0.A.3.1 SVHN
Data and Model: SVHN dataset [42] consists of images of digits obtained from house numbers in Google Street View images, with digits for training and digits for testing over classes. We perform experiments on SVHN using WideResNet-40-2 [73] architecture for training on reported approaches.
Hyperparameters for Training:
Natural: We use SGD optimizer with an initial learning rate of , momentum of , weight decay of and batch size of . We train it for epochs with a learning rate schedule decay of at , and at epoch.
PGD-7: We use the training configuration as in [37] to perform -step adversarial training with and step size .
ART: We use the same training configuration as mentioned for Natural model, and . We calculate using , step size and number of steps .
0.A.3.2 CIFAR-10
Data and Model: CIFAR-10 dataset [32] consists of training images for classes with resolution of . We normalize the images with its mean and standard deviation for training. We train a WideResNet28-10 [73] model for all the experiments on this dataset.
Hyperparameters for Training:
Natural: We use SGD optimizer with an initial learning rate of , momentum of , weight decay of and batch size of . We train it for epochs with a learning rate schedule decay of at , and at epoch.
PGD-10: We use the training configuration as mentioned in [37] to perform -step adversarial training with and step size .
ART: We use the same training configuration as mentioned for Natural model with and . We calculate using , step size and number of steps .
0.A.3.3 GTSRB
Data and Model: German Traffic Signal Recognition Benchmark [61] consists of classes of traffic signals with training images, validation images and test images. We resize the images to and normalize the images with its mean and standard deviation for training. To balance the number of images for each class, we use data augmentation techniques consisting of rotation, translation, and projection transforms to extend the training set to images per class as in [13]. We train WideResNet28-10 [73] model for carrying out experiments related to this dataset.
Hyperparameters for Training:
Natural: We use SGD optimizer with an initial learning rate of , momentum of , weight decay of and batch size of . We train it for epochs with a learning rate schedule decay of at , and at epoch.
PGD-7: We use the training configuration same as [13] to perform -step adversarial training with and step size .
IG Norm and IG-Sum Norm [13]: We report the accuracy as mentioned in the paper [13].
ART: We use the same training configuration as mentioned for Natural model with and . We calculate using , step size and number of steps .
0.A.3.4 Flower
Data and Model: Flower dataset [43] has categories with images for each class. We resize the images to and normalize it with its mean and standard deviation for training. The training set consists of images with images per class. The test set compromises of images with images per class. We use standard data augmentation techniques of rotation, translation, and projection transforms to extend the training data so that each class contains training examples as proposed in [13]. We use WideResNet28-10 [73] model for the reported approaches.
Hyperparameters for Training:
Natural: We use SGD optimizer with an initial learning rate of , momentum of , weight decay of and batch size of . We train it for 68 epochs with a learning rate schedule decay of at , and at epoch.
PGD-7[36]: We use the training configuration as mentioned in [37] to perform -step adversarial training with and step size .
IG Norm and IG-Sum Norm [13] : We report the accuracy as mentioned in the paper [13].
ART: We use the same training configuration as mentioned for Natural model with and . We calculate using , step size and number of steps .
0.A.3.5 Attack Methodology and Evaluation
For evaluation, we perform the Top-K variant of Iterative Feautre Importance Attack (IFIA) proposed by [19]. Feature importance function is taken as Integrated Gradients [62], and dissimilarity function is Kendall Correlation. The hyperparameters used are the same as in [13] i.e. for CIFAR-10, SVHN and GTSRB datasets, in top-k is , is , number of steps is and step-size is . For the Flowers dataset, is , is , number of steps is and step-size is . We also show the comparison by varying on CIFAR-10 dataset in Section 0.A.4. Evaluation is also similar to [13] using Top-k intersection and Kendall correlation measure and we report both numbers as percentage values. For Top-k intersection, is for CIFAR-10, SVHN and GTSRB datasets, and for Flowers dataset.
0.A.4 Additional Analysis on CIFAR-10
Attributional Robustness:
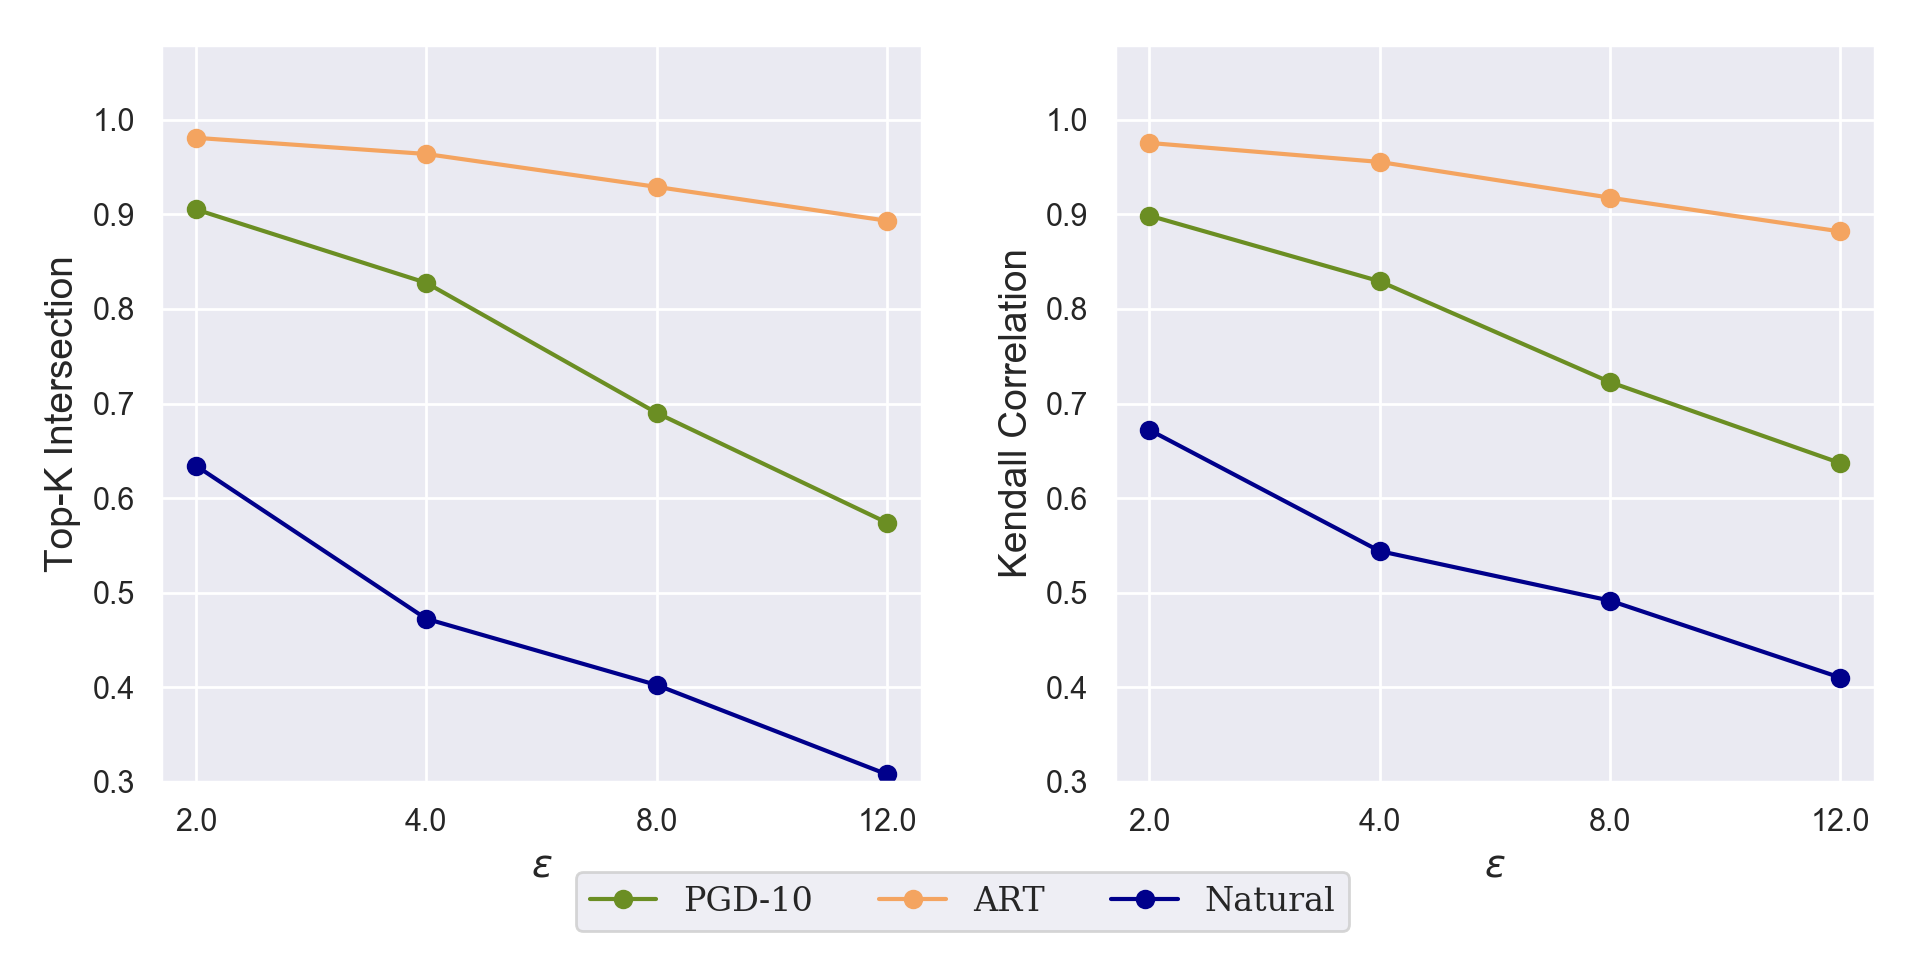
In Fig 11, we show the variance box plot of Kendall Correlation and Top-k Intersection with for Natural, ART and PGD-10 [36] models on CIFAR-10. ART has higher attributional robustness with the least variance as compared to other approaches across samples randomly selected from the test dataset. We also measure the attributional robustness of models on varying to the standard values of , , and in the attack methodology as explained in Section 0.A.3.5. Figure 12 shows the Top-k Intersection and Kendall correlation measure for the same. We can see that ART outperforms PGD-10 and Natural model over all choices of .
Appendix 0.B Weakly Supervised Localization: More Details and Results
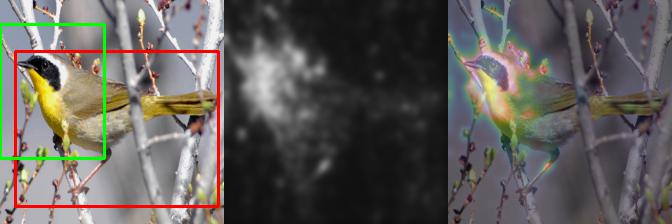
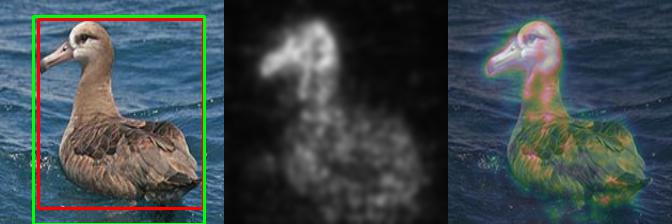
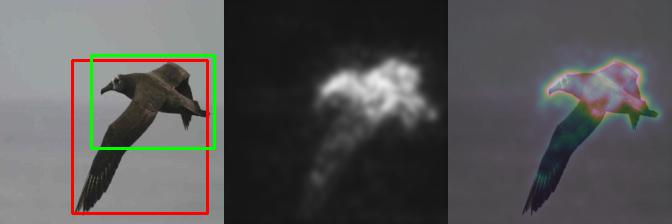
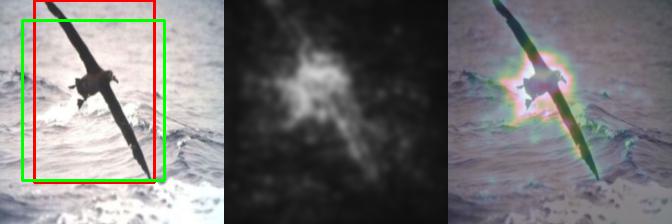
In this section, we provide more details of the dataset used for the results presented in the main paper on weakly supervised localization (Section 4.2), as well as more qualitative examples for these experiments.
0.B.1 Dataset and Implementation Details
We begin by describing the dataset used in experiments for weakly supervised localization, which we could not include in the main paper owing to space constraints.
Dataset and Model: CUB-200 [69] is an image dataset of 200 different bird species (mostly North American) with images in total. The information as a bounding box around each bird is also available. We finetune a ResNet-50 [22] model pre-trained on ImageNet for the reported approaches as in [14].
Hyper-parameters for training
Natural: We use SGD optimizer with an initial learning rate of , momentum of and weight decay of . We train the model for epochs with batch size and learning rate decay of at every epochs.
PGD-7 [36]: We use same hyper-parameters as natural training with and for calculating adversarial examples.
ART: We use SGD optimizer with an initial learning rate of 0.01, momentum of and weight decay of . We decay the learning rate by at every epoch till epochs and train with a batch size of . While calculating loss, we took mean over channels of images and gradients. Values of other hyper-parameters are , , , and .
0.B.2 Qualitative Analysis
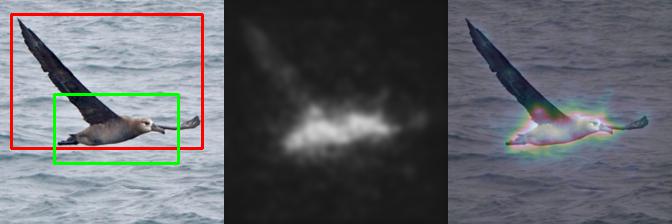
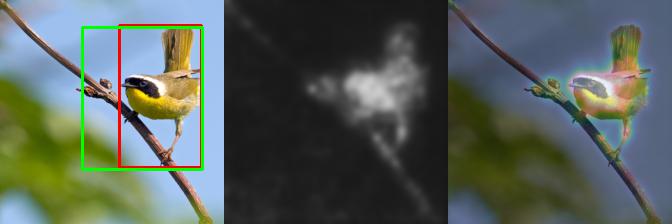
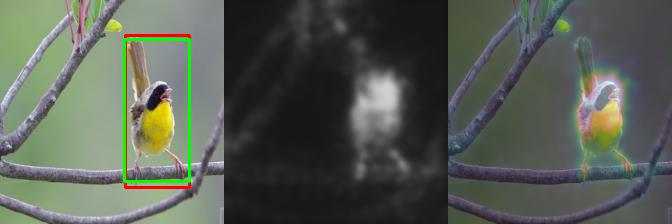
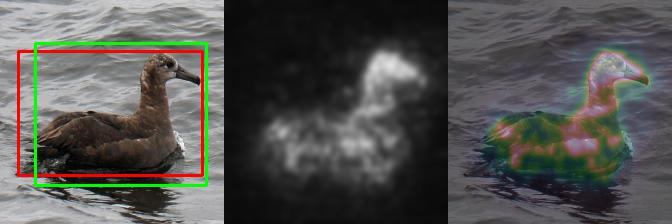
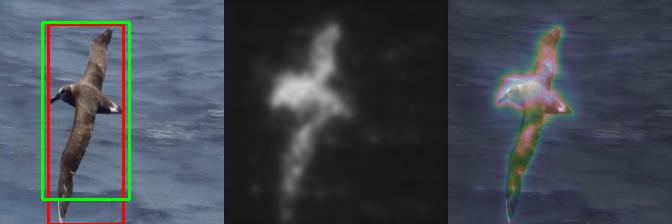
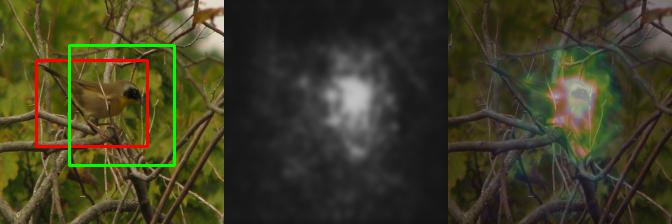
Figure 13 shows the estimated bounding box and heatmap derived from gradient based attribution [56] on randomly sampled images for ResNet50 model trained via our approach. We observe that the estimated bounding box sometimes does not capture the complete object in cases where birds have extended wings, or the bird is in an occluded area with branches and twigs. Although, we observe qualitatively that this issue also exists for other models [14].
| Training Approach |
|
Clean Test Accuracy | ||||
| Natural | PGD-10 | ART | ||||
| Natural | 0.00 | 80.35 | 49.09 | 95.26 | ||
| PGD-10 | 86.44 | 44.07 | 71.34 | 87.32 | ||
| ART | 88.45 | 72.72 | 37.58 | 89.84 | ||
Appendix 0.C Adversarial Robustness
In this section, we provide additional results on adversarial robustness on the CIFAR-10 dataset.
Adversarial Robustness on and PGD Perturbations with Varying
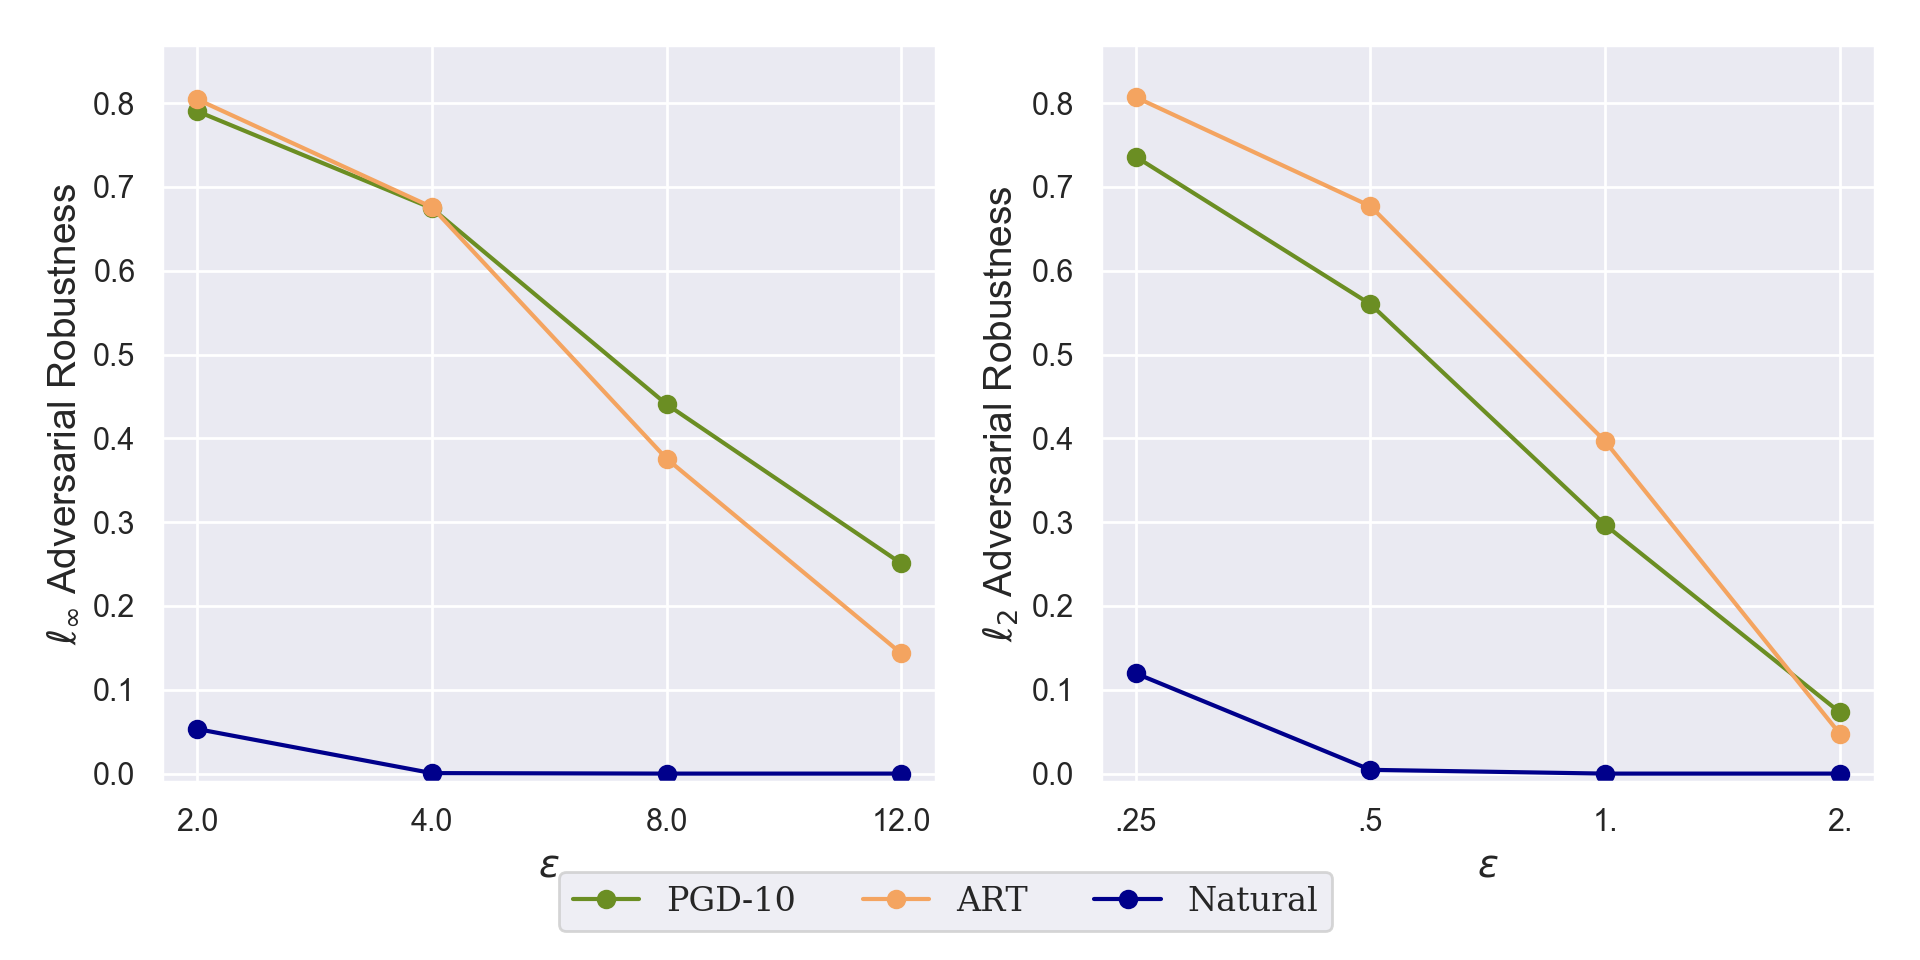
To analyze the adversarial robustness of ART model, we report and compare accuracy of the ART model and the PGD-10 adversarially trained model over and PGD perturbations for different values of on CIFAR-10. In Figure 14, we can observe that ART adversarial robustness for perturbations is similar to PGD-10 for less than and better for various values of perturbations.
Transfer-based black-box attacks
We analyse the adversarial robustness of ART models on transfer-based black box attacks. Specifically, we compute the adversarial perturbations on the test set of CIFAR-10 for different baseline models and evaluate its adversarial accuracy on ART. We see that the transfer of adversarial perturbation from ART is much better than PGD-10 on Natural model. ART also shows higher robustness than PGD-10 for transfer attack from Natural model as reported in table 6.
Comparison with other training techniques for adversarial robustness:
We consider JARN[11] and CURE[41], which are recently proposed training techniques for adversarial robustness that are different from adversarial training [36]. We compare the adversarial robustness of these techniques with ART on CIFAR-10 dataset using a PGD-20 adversarial perturbation with . JARN, CURE and ART show adversarial accuracy of , and respectively and test accuracy of , and respectively.
Using to Compute Perturbations
With the motive to combine the benefits from attributional and adversarial robust models, we augment the loss function of our approach with adversarial loss [36]. We observe that the model achieves test accuracy of and adversarial accuracy of on PGD-40 attack with as compared to the PGD-10 model which has test accuracy and adversarial accuracy. The attributional robustness measure of Top-k intersection and kendall correlation using Integrated Gradients is and which is less than the attributional robustness of ART model but is better than PGD-10 model.
![[Uncaptioned image]](/html/1911.13073/assets/images/target_img.png)
![[Uncaptioned image]](/html/1911.13073/assets/images/target_attr.png)