Measurement of small reflectivity anisotropy in the nematic state and its non-equilibrium dynamics
Abstract
Electronic nematicity has attracted a great deal of interest in high- superconductivity. However, measurement of the small optical anisotropy is usually hindered by the geometric anisotropy due to the finite angle of incidence. We present experimental method to investigate nematic anisotropy and its non-equilibrium dynamics. Obtained nematic anisotropy of Ba(Fe0.955Co0.045)2As2 single crystal clearly feature the broken four-fold symmetry along orientations of Fe-Fe bonding. Numerical simulations demonstrate that our method is highly reliable in conventional experimental condition. Finally, our time-resolved experiment of nematic anisotropy confirms that ultrafast photo-excitation suppresses the nematic order.
Optical anisotropy appears in various materials bearing lattice, electronic, or magnetic anisotropies. Birefringent materials of large optical anisotropy have been extensively investigated and employed in various optical techniques such as second-harmonic-generations, photo-elastic modulations, and liquid-crystal displays. Even small anisotropy can often play an important role for other physical properties of interest [1, 2, 3].
Recently electronic nematicity, breaking rotational symmetry of lattice, has attracted a great deal of attention with regard to the relation with high- superconductivity. The nematic phase precedes the superconductivity in numerous correlated electronic systems such as iron-pnictide [4], cuprate [5, 6], heavy Fermion materials [7, 8], and topological superconductors [9]. In Fe-based superconductors, the nematic order in under-doped materials is accompanied with a structural phase transition and exhibits clear electronic anisotropy as confirmed in various experiments such as strain-dependent transport measurement [4], angle-resolved photo-emission spectroscopy [10], and optical spectroscopy [11]. In optimal- and over-doped materials, the structure transition is fully suppressed. However, the electronic anisotropy still remains strongly fluctuating and a nematic quantum critical point is supposed to exist near the optimal doping, suggesting that the nematic fluctuations may play an important role for the superconductivity [4]. As doping further increases, a new type of nematic order appears in heavily hole-doped materials. That is, the orientation of electronic nematicity is rotated by 45 degrees without any signature of corresponding lattice symmetry breaking. It has been suggested that the change of the nemetic orientation is accompanied with crossover of the superconducting gap symmetry from a nodeless one to a nodal one [12, 13]. Therefore, investigation of even small electronic nematicity is important to understand the nematic fluctuations and the superconductivity in Fe-based materials.
Study on a small nematic response requires a challenging signal-to-noise ratio for spectroscopic investigations such as angle-resolved photo-emission spectroscopy. Optical polarimetry experiments using photo-elastic modulator (PEM) with a lock-in technique provide notably high signal-to-noise ratio [3, 1, 2]. However, measurement of a small optical anisotropy is usually obscured by a geometric anisotropy, which differentiates reflection or transmission coefficients for s- and p-polarized electromagnetic waves. Fresnel equations state that the geometric anisotropy could be considerable at a non-zero angle of incidence even in optically isotropic materials. For transparent materials, the transmission measurements at the perfect normal incidence can be free from the geometric effect. However, the normal incidence to avoid the geometric aniostropy is not feasible for the reflection measurement, inevitable for non-transparent materials. As a result, spectroscopic investigations of the anisotropy of non-transparent materials have been limited or requires only specific experimental conditions such as precise sample-rotation alignments [3].
In this study, we present a new experimental method to investigate the reflectivity anisotropy and its non-equilibrium dynamics. Our method does not require any specific experimental conditions such as precise alignment of the sample rotation angle and the principal axes of the anisotropy are easily characterized. This makes our method appropriate for studying electronic nematicity and its fluctuations in correlated electron systems such as cuprate, pnictide, and heavy Fermion superconductors. As a demonstration of our method, we display experimental results on iron pnictide Ba(Fe0.955Co0.045)2As2 single crystals grown from self-flux. Our results clearly shows that the obtained reflectivity anisotropy is along the Fe-Fe bonding directions regardless of orientation of the plane of incidence, which usually hinders accurate characterization of a small optical anisotropy. Our numerical simulation using WVASE from Woollam Co. confirms that our method is highly reliable even for a small anisotropy as small as order at the angle of incidence in the range up to 15∘. Finally, we perform time-resolved reflectivity anisotropy measurements, confirming that ultrafast pumping with 1.55 eV photon suppresses the reflectivity anisotropy originating from the nematic order.
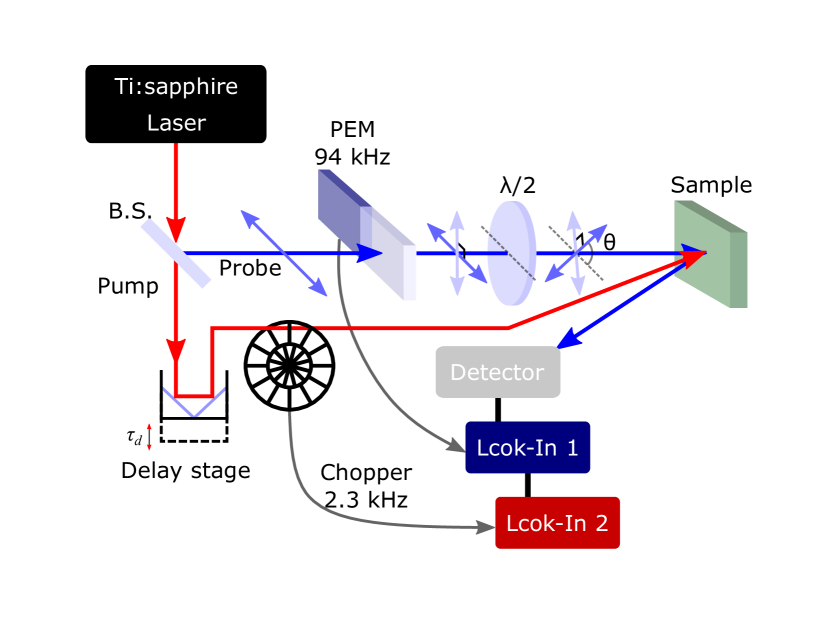
We use a standard Ti:sapphire regenerative amplifier which generates pulses of 36 fs pulse duration at full-width-half-maximum (FWHM) and of 1.55 eV photon energy with 250 kHz repetition rate. The generated pulse is split into pump and probe branches, and then they are focused on a sample surface with 100 m and 50 m in diameter at FWHM for pump and probe, respectively. For polarimetric experiment, we employ a photo-elastic modulator (PEM) providing a sinusoidal modulation of the phase retardation of the probe beam at a frequency kHz. The reflectivity anisotropy, that is, the modulation of reflectivity due to the polarization change is obtained as a 2 signal through the first lock-in amplifier. Transient change in the reflectivity anisotropy after pumping is measured through the second lock-in amplifier referring to an optical chopper at the pump branch. The pump polarization is set to be parallel to its plane of incidence. Delay time between pump and probe beams is varied by a delay stage at the pump branch. The experimental setup is schematically displayed in Fig. 1. Note that our optical setup is basically same as the one by Tros et al. [1] except that we measure the reflectivity anisotropy of a crystalline sample instead of the transmittance of a liquid sample.

The Jones calculus on our experiment shows that the 2 lock-in signal is a sinusoidal function of the probe polarization angle with respect to the orientation of the crystal anisotropy as follows:
| (1) |
where is the angle of incidence, is the probe polarization angle incident to the sample when it is not modulated by PEM, and is the orientation of a crystal axis as shown in Fig. 2(a). is a Bassel function of the first kind and is the modulated phase angle by PEM. The values of and are indicated with respect to the plane of incidence at the sample surface. is the complex reflectivity coefficient of the sample where and indicate polarizations of the incident and the reflected electric fields, respectively. For example, indicate the complex reflectivity coefficient when the incident polarization is parallel to the crystal axis and the reflected polarization is parallel to the crystal axis . Note that is a function of and , but does not depend on . If is small enough to be considered as a normal incidence case, and are negligibly small compared to and [14], and Eq. (Measurement of small reflectivity anisotropy in the nematic state and its non-equilibrium dynamics) can be approximated to
| (2) |
In case of half-wave modulation, and .
Figure 2 displays experimental data of measured on Ba(Fe0.955Co0.045)2As2 single crystals, which shows the nematic phase transition at K. The crystal becomes orthorhombic in the nematic state such that the principal axes of [100] and [010] are parallel to the Fe-Fe bonding directions. We determined the crystallographic orientation by Laue-XRD measurements and prepared two samples on a Cu-plate with different crystal orientations of and . Both samples were cleaved before the experiment. In the normal state at 294 K, (open circles) exhibits the same sinusoidal dependence in both cases of in Fig. 2(b) and in Fig. 2(c). We note that this polarization dependence in the sample without in-plane anisotropy originates from the geometric effect in the measurement at non-zero angle of incidence. In the nematic state at 50K, on the other hand, (open triangles) features a phase-shift from the normal state response for in Fig. 2(b) while the amplitude is enhanced without a phase-shift for in Fig. 2(c). This implies that different functions of and due to the nematic order is added up to the normal state signal. These data show that the geometric anisotropy due to the non-zero angle of incidence has a comparable amplitude to the nematic anisotropy.
To remove the geometric anisotropy, we subtract the normal state signal at 294 K (open circles) from the reflectivity anisotropy at 50 K (open triangles):
| (3) |
Obtained nematic anisotropies (open squares) clearly features a cosine function of , as displayed in Fig. 2(b) for and Fig. 2(c) for , which agrees with Eq. (2).

Numerical simulation of the reflectivity anisotropy confirms that the experimental approach according to Eq. (3) can successfully represent the nematic anisotropy as displayed in Fig. 3(a). For the simulation on the normal state, we employed a virtual refractive index of , and at the photon energy of 1.55 eV. The value of is from the experimental results on BaFe2As2 single crystal measured at room temperature by spectroscopic Ellipsometer, and the value of is extracted from published data [15]. For the nematic state, we increased (decreased) the real part and decreased (increased) the imaginary part of () by a relative ratio such that , which is consistent to the change observed in the nematic state [15]. Reflectivity of s-polarization and p-polarization for were calculated using WVASE (Woollam Co.). Reflectivity and its anisotropy at arbitrary polarization were calculated as below:
| (4) |
| (5) |
| (6) |
As displayed in Fig. 3(a), our experimental result (open square) of by Eq. (3) is well reproduced by the numerical simulation (open circle) of Eq. (6) with variation of the refractive index for the nematic state. Furthermore, they match well with the true reflectivity anisotropy of the material for the case of the normal incidence (symbol ), where the geometric anisotropy is absent.
To demonstrate the reliability of Eq. (3), we performed the simulation for and for up to . As displayed in Fig. 3(b), is proportional to . The angle of incidence does not affect the result within the order of of the absolute reflectivity anisotropy ratio as displayed in Figs. 3(b) and (c).
We note that our method can be extended to materials of small nematicity even when the high temperature isotropic phase is not accessible. In a nematic state, nematic twin domains are easily found in a single piece of a sample. Because the geometric anisotropy is expected to be similar in the two twin domains, we can eliminate the geometric effect from the difference of the reflectivity measured on the two different domains. For the given case of the crystal orientation of , the twin domain should have . Therefore, the reflectivity anisotropy can be obtained as follows:
| (7) |
One can measure on the twin domains by simply translating the sample surface, which should be appropriate in most of samples in a nematic state. Such a measurement could be performed also on a single domain sample as well by rotating the sample if the crystal angle could be precisely controlled. Figure 3(a) shows that the result from this method also agrees nicely with the true reflectivity anisotropy for the normal incidence case.
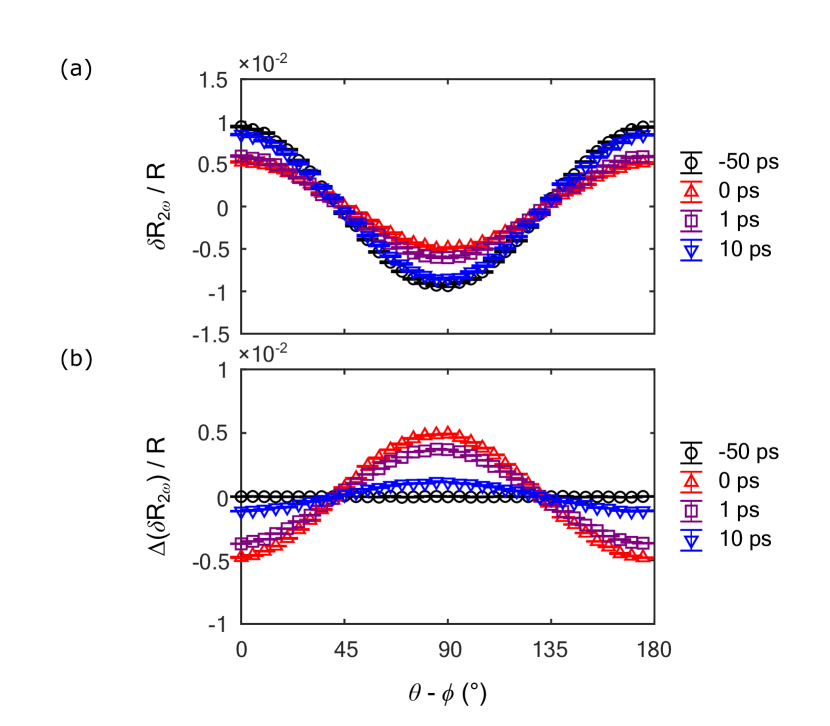
Finally we measure transient reflectivity anisotropy of Ba(Fe0.955Co0.045)2As2 single crystal at 50 K upon pumping with 800 nm photons. Our results clearly show that the reflectivity anisotropy due to the nematic order is suppressed by ultrafast photo-excitation as displayed in Fig. 4(a). The nematic responses of Fe-based superconductors have been observed in pump-probe experiments even in the tetragonal structure. However, because the pumping with linearly polarized photons inherently possesses an anisotropic nature, the observed nematicity in the pump-probe experiment can be questioned whether it is the intrinsic nematicity. We found that the change of the reflectivity anisotropy upon pumping does not depend on the polarization of the pump pulses. Our simultaneous observation of and demonstrates that the nematic order is suppressed by the photo-excitation without an pump-induced anisotropy and, therefore, assures that previous time-resolved studies on the nematicity indeed reflects the intrinsic nematic properties of the iron pnictides [16, 17].
In summary, we present experimental method to study the optical anisotropy by reflection experiment. As a demonstration, we measure the nematic anisotropy of Ba(Fe0.955Co0.045)2As2 single crystal. Numerical simulations confirm that the experimentally observed data are highly reliable. Successive time-resolved experiment on the nematic anisotropy assures that the ultrafast photo-excitation simply suppresses the nematic anisotropy of the iron pnictides.
Funding. Institute for Basic Science (IBS) in Korea (IBS-R009-D1); National Research Foundation of Korea (NRF) (NRF-2017M3D1A1040828, 2017R1A4A1015323, and 2019R1F1A1062847).
Acknowledgment. The authors thank J. S. Lee (GIST) for valuable discussions.
Disclosures. The authors declare no conflicts of interest.
References
- Tros and Woutersen [2015] M. Tros and S. Woutersen, Polarization-modulation setup for ultrafast infrared anisotropy experiments to study liquid dynamics, Opt. Lett. 40, 2607 (2015).
- Oppermann et al. [2019] M. Oppermann, B. Bauer, T. Rossi, F. Zinna, J. Helbing, J. Lacour, and M. Chergui, Ultrafast broadband circular dichroism in the deep ultraviolet, Optica 6, 56 (2019).
- Weightman et al. [2005] P. Weightman, D. S. Martin, R. J. Cole, and T. Farrell, Reflection anisotropy spectroscopy, Reports on Progress in Physics 68, 1251 (2005).
- Kuo et al. [2016] H.-H. Kuo, J.-H. Chu, J. C. Palmstrom, S. A. Kivelson, and I. R. Fisher, Ubiquitous signatures of nematic quantum criticality in optimally doped -based superconductors, Science 352, 958 (2016).
- Daou et al. [2010] R. Daou, J. Chang, D. LeBoeuf, O. Cyr-Choinière, F. Laliberté, N. Doiron-Leyraud, B. J. Ramshaw, R. Liang, D. A. Bonn, W. N. Hardy, and L. Taillefer, Broken rotational symmetry in the pseudogap phase of a high- superconductor, Nature 463, 519 (2010).
- Sato et al. [2017] Y. Sato, S. Kasahara, H. Murayama, Y. Kasahara, E.-G. Moon, T. Nishizaki, T. Loew, J. Porras, B. Keimer, T. Shibauchi, and Y. Matsuda, Thermodynamic evidence for a nematic phase transition at the onset of the pseudogap in , Nature Physics 13, 1074 (2017).
- Okazaki et al. [2011] R. Okazaki, T. Shibauchi, H. J. Shi, Y. Haga, T. D. Matsuda, E. Yamamoto, Y. Onuki, H. Ikeda, and Y. Matsuda, Rotational symmetry breaking in the hidden-order phase of , Science 331, 439 (2011).
- Riggs et al. [2015] S. C. Riggs, M. C. Shapiro, A. V. Maharaj, S. Raghu, E. D. Bauer, R. E. Baumbach, P. Giraldo-Gallo, M. Wartenbe, and I. R. Fisher, Evidence for a nematic component to the hidden-order parameter in from differential elastoresistance measurements, Nature Communications 6, 6425 (2015).
- Sun et al. [2019] Y. Sun, S. Kittaka, T. Sakakibara, K. Machida, J. Wang, J. Wen, X. Xing, Z. Shi, and T. Tamegai, Quasiparticle evidence for the nematic state above in , Phys. Rev. Lett. 123, 027002 (2019).
- Yi et al. [2011] M. Yi, D. Lu, J.-H. Chu, J. G. Analytis, A. P. Sorini, A. F. Kemper, B. Moritz, S.-K. Mo, R. G. Moore, M. Hashimoto, W.-S. Lee, Z. Hussain, T. P. Devereaux, I. R. Fisher, and Z.-X. Shen, Symmetry-breaking orbital anisotropy observed for detwinned above the spin density wave transition, Proceedings of the National Academy of Sciences 108, 6878 (2011).
- Nakajima et al. [2012] M. Nakajima, S. Ishida, Y. Tomioka, K. Kihou, C. H. Lee, A. Iyo, T. Ito, T. Kakeshita, H. Eisaki, and S. Uchida, Effect of Co doping on the in-plane anisotropy in the optical spectrum of underdoped , Phys. Rev. Lett. 109, 217003 (2012).
- Liu et al. [2019] X. Liu, R. Tao, M. Ren, W. Chen, Q. Yao, T. Wolf, Y. Yan, T. Zhang, and D. Feng, Evidence of nematic order and nodal superconducting gap along [110] direction in , Nature Communications 10, 1039 (2019).
- Ishida et al. [2019] K. Ishida, M. Tsujii, S. Hosoi, Y. Mizukami, S. Ishida, A. Iyo, H. Eisaki, T. Wolf, K. Grube, H. v. Löhneysen, R. M. Fernandes, and T. Shibauchi, Emergent XY electronic nematicity in iron-based superconductors, arXiv:1812.05267v2 (2019).
- Graham and Lee [2011] J. W. Graham and J. K. Lee, Reflection and transmission at isotropic-biaxial interface, in 30th URSI General Assembly and Scientific Symposium, Istanbul, Turky (2011).
- Moon et al. [2013] S. J. Moon, A. A. Schafgans, M. A. Tanatar, R. Prozorov, A. Thaler, P. C. Canfield, A. S. Sefat, D. Mandrus, and D. N. Basov, Interlayer coherence and superconducting condensate in the -axis response of optimally doped high- superconductor using infrared spectroscopy, Phys. Rev. Lett. 110, 097003 (2013).
- Patz et al. [2014] A. Patz, T. Li, S. Ran, R. M. Fernandes, J. Schmalian, S. L. Bud’ko, P. C. Canfield, I. E. Perakis, and J. Wang, Ultrafast observation of critical nematic fluctuations and giant magnetoelastic coupling in iron pnictides, Nature Communications 5, 3229 (2014).
- Shimojima et al. [2019] T. Shimojima, Y. Suzuki, A. Nakamura, N. Mitsuishi, S. Kasahara, T. Shibauchi, Y. Matsuda, Y. Ishida, S. Shin, and K. Ishizaka, Ultrafast nematic-orbital excitation in FeSe, Nature Communications 10, 1946 (2019).