Discovery of a Powerful erg AGN outburst in the Distant Galaxy Cluster SPT-CLJ0528-5300
Abstract
We present 103 ks of Chandra observations of the galaxy cluster SPT-CLJ0528-5300 (SPT0528, ). This cluster harbors the most radio-loud ( erg s-1 Hz-1) central AGN of any cluster in the South Pole Telescope (SPT) SZ survey with available X-ray data. We find evidence of AGN-inflated cavities in the X-ray emission, which are consistent with the orientation of the jet direction revealed by ATCA radio data. The combined probability that two such depressions – each at significance, oriented apart and aligned with the jet axis – would occur by chance is 0.1%. At erg, the outburst in SPT0528 is among the most energetic known in the universe, and certainly the most powerful known at 0.25. This work demonstrates that such powerful outbursts can be detected even in shallow X-ray exposures out to relatively high redshifts (), providing an avenue for studying the evolution of extreme AGN feedback. The ratio of the cavity power ( erg s-1) to the cooling luminosity ( erg s-1) for SPT0528 is among the highest measured to date. If, in the future, additional systems are discovered at similar redshifts with equally high ratios, it would imply that the feedback/cooling cycle was not as gentle at high redshifts as in the low-redshift universe.
1 Introduction
Early X-ray studies of the intracluster medium (ICM) in galaxy clusters revealed central cooling times that were often much less than the age of the Universe (e.g. Cowie, & Binney, 1977; Fabian, & Nulsen, 1977; White et al., 1991; Edge et al., 1992). Theory predicted that “cooling flows” should result in massive reservoirs of cold gas deposited onto the central galaxies, along with high star formation rates (see review by Fabian, 1994). However, multi-wavelength investigations into these “downstream” observables of cooling flows found them to be an order of magnitude lower than predicted (e.g. Johnstone et al., 1987; McNamara, & O’Connell, 1989; Allen, 1995; Crawford et al., 1999; Rafferty et al., 2006; O’Dea et al., 2008; Donahue et al., 2015; McDonald et al., 2018). A proposed solution to this long-standing issue came in the form of feedback from active galactic nuclei (AGN), where the energy output from an accreting supermassive black hole (SMBH) in the central galaxy prevents excessive cooling of the ICM out of the hot, X-ray emitting phase (Boehringer et al., 1993; Churazov et al., 2000, 2001; McNamara, & Nulsen, 2007, 2012; Fabian, 2012). This heating by the AGN, which is probed by measuring the sizes of bubbles inflated in the hot ICM by radio jets, has been found to correlate strongly with several cooling properties of the ICM, implying a tightly-regulated feedback loop (e.g. Bîrzan et al., 2004; Dunn, & Fabian, 2004; Rafferty et al., 2006; Cavagnolo et al., 2010; Ma et al., 2011; Hlavacek-Larrondo et al., 2012, 2013; McDonald et al., 2013; Main et al., 2017; Bîrzan et al., 2017).
Recently, surveys taking advantage of the redshift-independent Sunyaev-Zel’dovich (SZ) effect, such as by the South Pole Telescope (SPT; Carlstrom et al., 2011), have enabled studies of the evolution of AGN feedback over cosmic time, revealing no significant evolution in the cooling properties of clusters (McDonald et al., 2013, 2017) or in the heating properties of AGN (e.g. Hlavacek-Larrondo et al., 2012, 2015) out to . In particular, Hlavacek-Larrondo et al. (2015) studied AGN feedback in SPT clusters in a redshift range , and find that the mechanical feedback by AGN in brightest cluster galaxies (BCGs) has, on average, remained unchanged for over half the age of the Universe. However, Bîrzan et al. (2017) find some evidence of evolution in the radio-luminosity function of SZ-selected clusters (see also Main et al., 2017; Gupta et al., 2019), showing that high luminosity radio sources have a higher occurrence rate at higher redshifts. This could indicate a transition from high-excitation radio galaxy accretion modes to low-excitation accretion modes at intermediate redshifts which is possibly driven by enhanced galaxy merger rates at higher redshifts that trigger AGN activity (e.g. Lotz et al., 2013; Brodwin et al., 2013). Thus, understanding the extreme outbursts often associated with high radio luminosity is crucial for understanding the co-evolution of radio sources with their host galaxies and cluster environments.
Here we investigate the effects of AGN feedback in the SZ-selected galaxy cluster SPT-CLJ0528-5300, at a redshift of and mass of (Bleem et al., 2015). In 2 we summarize the data used in this paper. In 3 we report our detection of large X-ray cavities and argue for their credibility in 4. We discuss the implications of this discovery in 5 before summarizing our results in 6. We assume a CDM cosmology with km s-1 Mpc-1, and . All errors are 1 unless noted otherwise.
2 Cluster Selection & Data Analysis
The galaxy cluster SPT-CLJ0528-5300 (hereafter, SPT0528) was selected via the SZ effect as part of the 2500 deg2 SPT-SZ survey (Bleem et al., 2015). The SZ effect is a particularly useful mechanism enabling the detection of distant galaxy clusters independent of redshift (e.g. Staniszewski et al., 2009; Reichardt et al., 2013; Hasselfield et al., 2013; Planck Collaboration et al., 2014). The SPT-SZ catalog111https://pole.uchicago.edu/public/data/sptsz-clusters/ found 516 clusters, with a median sample redshift of 0.55 (Bleem et al., 2015).
We search the fiducial SPT-SZ catalog for galaxy clusters hosting radio-loud sources, whose energy outputs are predominantly in the form of outflows that do mechanical work on their environments. To this end, we cross-match the SPT-SZ catalog with the Sydney University Molonglo Sky Survey (SUMSS) source catalog (Mauch et al., 2003), which imaged 8100 deg2 of the radio sky below at 843 MHz. We find a total of 112 out of 677 clusters with an associated SUMSS radio source within . Comparing the source densities of the two catalogs, this is an excess over random by a factor of . The observed 0.8 GHz flux of each source is k-corrected and converted to a 1.4 GHz rest-frame radio power assuming , where is a typical power-law spectral index for a radio galaxy (Condon et al., 2002).
Among the most powerful radio sources in this SPT+SUMSS sample are SPT0528, SPT-CLJ0351-4109 () and SPT-CLJ0449-4901 (), all with erg s-1 Hz-1. Of these three, SPT0528 hosts the most luminous unblended radio source with available X-ray data. We focus now on SPT0528, leaving the other two radio-bright clusters for future follow-up.
2.1 Chandra
Observations of SPT0528, totaling 124 ks of exposure time, were taken with the ACIS-I instrument onboard Chandra (Observation IDs: 9341, 10862, 11747, 11874, 11996, 12092, 13126) as part of an ongoing follow-up campaign (e.g., McDonald et al., 2013). These data were reduced and analyzed in a standard fashion similar to Andersson et al. (2011) and McDonald et al. (2013), using the Chandra Interactive Analysis of Observations (CIAO) v4.8.1 software with CALDB v4.7.0. We applied the latest gain and charge-transfer inefficiency corrections, as well as improved background screening as the observations were taken in the VFAINT telemetry mode. Periods of high background were excluded, resulting in a total “clean” exposure of ks. Modeling of the global ICM properties was previously done in McDonald et al. (2013) and we reuse their analysis pipeline here for our deeper observations.
2.2 ATCA
SPT0528 was also observed with the higher resolution Australia Telescope Compact Array (ATCA) in two separate observing runs on 01/06/2015 (1–3 GHz, 63 mins) and 08/21/2016 (4.5–6.5 and 8.0–10.0 GHz, 25 mins), resulting in beams of , , and 3 respectively. The data were reduced with the 05/21/2015 release of the Miriad software package (Sault et al., 1995). The phase calibrator J0524-5658 was used to create the radio maps, with some multi-faceting, but no self-calibration was necessary. The rms values for the images are 40, 30 and 55 Jy at 1–3, 4.5–6.5, and 5.5–9.0 GHz, respectively. The resulting images have a dynamic range of , ensuring sensitivity to extended emission.
3 Detection of Large X-ray Cavities
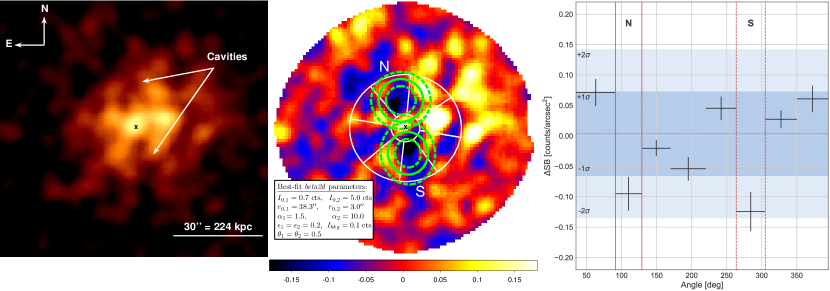
Figure 1 shows the stacked, cleaned 0.5–4 keV Chandra counts image of SPT0528. The large-scale ICM centroid () is consistent with the BCG position (; Song et al., 2012). The ICM 75 kpc (10) to the north and south of the ICM centroid, outlined by the green ellipsoidal regions in Figure 1, is depressed relative to the surrounding emission, possibly indicating the presence of buoyantly-rising bubbles inflated by the central AGN. We fit the counts image with a double-beta model (beta2d) with constant background using CIAO’s Sherpa package, linking the centroid positions, ellipticities (), and position angles () of the two components and allowing all the parameters to vary. The best-fit parameters and model-subtracted residual image are shown in Figure 1. The residual surface brightness of the southern and northern depressions represent 1.8 and 1.4 significant fluctuations from the expected surface brightness based on the statistics of eight similar-area azimuthal bins at a common distance from the cluster center.
Assuming these cavities are real, it is possible to estimate the power of the AGN outburst that created them via the work that they do in expanding by a volume against their surroundings at pressure (e.g. Bîrzan et al., 2004; Dunn et al., 2005). We calculate the cavity power, , as follows:
| (1) |
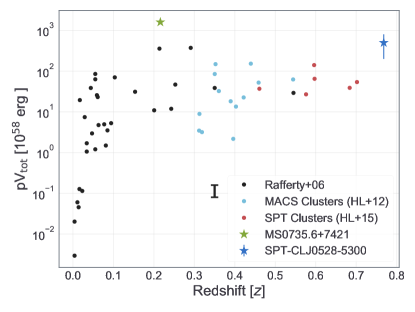
where is the total enthalpy of a cavity of prolate geometry, with semi-major (minor) axis filled with relativistic fluid, and is the age of the cavity, assuming a non-relativistic plasma. We calculate the best-fit central (r kpc) electron density and temperature values cm-3 and keV and estimate a sound speed km s-1, and pressure erg cm-3 for the ICM in the vicinity of the cavities. The sizes of the cavities outlined in Figure 1 were estimated by eye from smoothing the images at various scales, with a resulting 30–40% size uncertainty reflecting the spread of all the estimates. The northern cavity has dimensions kpc (), and is kpc () away from the ICM centroid. The southern cavity has dimensions kpc (), kpc (), and is kpc () away from the ICM centroid. Using these highly-uncertain cavity size and distance measurements, we calculate a total cavity enthalpy of erg, leading to a cavity power of erg s-1. At erg, the energy associated with these cavities is among the highest measured of any system.
4 Supporting Evidence for a erg Mechanical Outburst
While the statistical significance of the large cavities shown in Figure 1 is marginal, there are other lines of evidence that support the picture of a recent 1061 erg outburst in the core of SPT0528 and, indirectly, increase the likelihood of these large cavities being real.
4.1 Jet Direction & Morphology
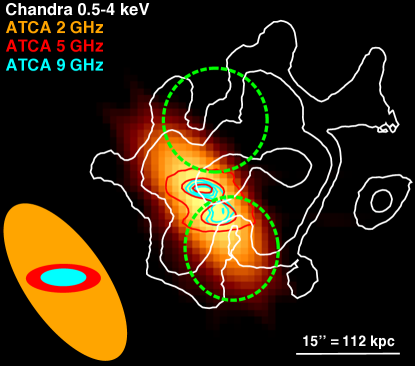
The most convincing evidence in support of this cavity system comes from the simultaneous consideration of our high angular resolution X-ray and radio observations. Figure 2 presents ATCA radio data taken at 2, 5, and 9 GHz, with Chandra contours overlaid. The position of the radio source is consistent with that of the ICM center and BCG. At 2 GHz, the radio source is weakly resolved, while the 5 and 9 GHz contours show that the source is clearly elongated in the NE-SW direction with a possible jet component.
The position angle (PA) of the potential jet component is , while the PA of the cavities’ axes is . These PAs are fully consistent within the uncertainties, suggesting that the X-ray emitting gas has been evacuated by the expanding radio lobes. Furthermore, the two cavities are oriented degrees apart with respect to the ICM centroid. To quantify our confidence in the overall detection of these cavities, we take the product of the following independent probabilities:
-
•
a value being from the mean in only one direction (i.e. strictly a depression): 8.1%
-
•
finding 2 such values in an 8-element array: 25%
-
•
the number of pairs in an 8-element array that are each four positions apart, divided by the total number of combinations: = 28.6%
-
•
the jet axis aligning with any arbitrary cavity axis, given an uncertainty of : = 16.7%
Thus, the combined probability of chance alignment between the cavity axis and the jet axis, and of two depressions separated by 180∘ is 0.1%.
4.2 X-ray Surface Brightness of the Cavities
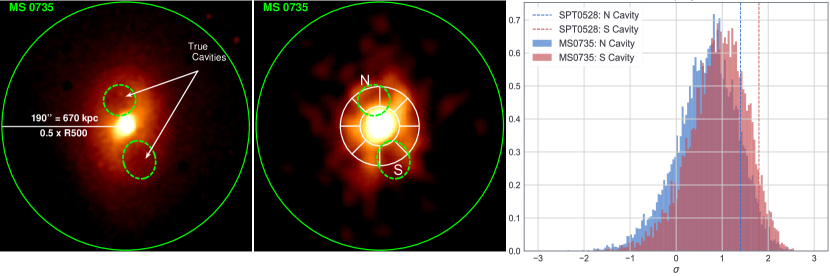
To investigate whether the detection significance of the cavities in SPT0528 is appropriate for a erg outburst, given the depth of these data, we consider a similar system with exquisitely deep data and downsample it to the same depth of our observations. Currently cited as the most energetic AGN outburst in the literature, MS0735.6+7421 (hereafter MS0735), at a redshift of , has a total enthalpy of erg and has been observed for Ms with Chandra (Rafferty et al., 2006; McNamara et al., 2009). We simulate what MS0735 would look like with Chandra at the same redshift () and depth (1400 counts) as our 0.5–4 keV SPT0528 observations, by reducing the MS0735 count rate, increasing the background (noise), and resampling the image to account for the different angular diameter distance.
This downsampling procedure was repeated 10,000 times, with the results shown in Figure 3. The full observations of MS0735 are shown in the left panel, while a single, characteristic downsampled image is shown in the middle panel. The full-depth image shows the obvious presence of cavities in the raw data, outlined by the dashed green ellipsoidal regions, which are still recovered a large fraction of the time (at an average significance of and ) in the significantly shallower downsampled images. In comparison, the southern and northern cavities in SPT0528 are even more convincing, at 1.8 and 1.4 below their expected surface brightness, respectively. The bootstrapping procedure above demonstrates that cavities as large as those in MS0735, the most energetic outburst we know of, could be detected with Chandra at the same observing depth and redshift of SPT0528 at the same level, inspiring more confidence that those in SPT0528 are real.
4.3 Scaling of Cavity and Radio Jet Powers
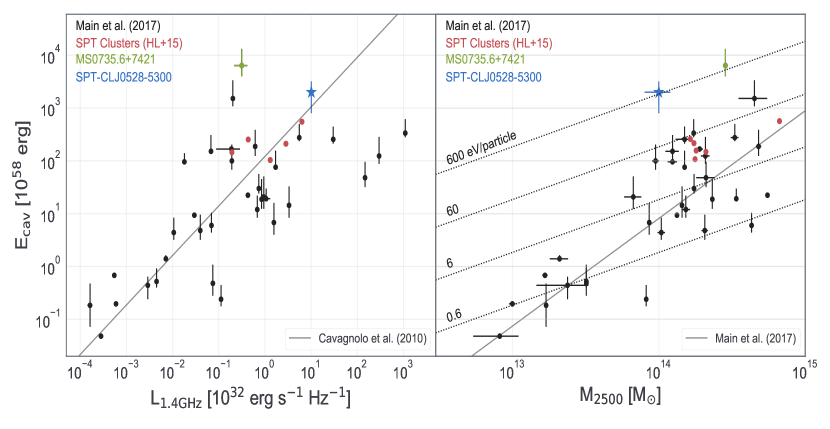
A number of studies have established a correlation between total radio luminosity and AGN outburst powers as probed by X-ray cavities (e.g. Bîrzan et al., 2008; Cavagnolo et al., 2010; O’Sullivan et al., 2011). Such a trend is to be expected as the bubbles are inflated by the radio jets. Figure 4 shows this relationship between radio power and cavity enthalpy, along with a relationship between cavity enthalpy and the host cluster mass (Hlavacek-Larrondo et al., 2012, 2015; Main et al., 2017). These relations have large scatter for high power systems, so we do not incorporate them into our overall detection probability. Nevertheless, SPT0528 was specifically chosen for follow-up as one of the most radio-loud systems in the SPT-SZ survey (see 2), and we expect the cavity power to be correspondingly large. The extreme total cavity enthalpy of erg we measure is consistent with expectations given a radio luminosity of erg s-1 Hz-1, based on ATCA and SUMSS radio observations. Diagonal dotted lines in Figure 4 show the average energy gained per particle (assuming a gas fraction of 10%) if the outburst energy coupled completely and isotropically to the hot gas. These lines demonstrate the similarity in energy density between the outbursts in MS0735 and SPT0528, and the significant effect this energy could have on the surrounding ICM.
5 Implications for AGN Feedback at High Redshifts
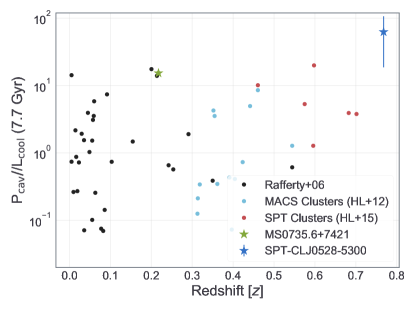
To determine the impact of the powerful outburst in SPT0528, we calculate a cooling luminosity, . For consistency with the literature, this is the integrated luminosity within the radius where the cooling time of the ICM falls below 7.7 Gyr, or effectively, where kpc (e.g. O’Dea et al., 2008; McDonald et al., 2013; Hlavacek-Larrondo et al., 2012). For SPT0528, we measure erg s-1 (McDonald et al., 2013). This measurement yields a ratio of , on the upper end of the typical range of other systems with cavities (see Figure 5). Since , in galaxy clusters has not shown significant evolution, implying well-regulated feedback loops. If, in the future, additional clusters exhibiting such high ratios are found at high redshift, it would have important implications for the inferred redshift evolution of AGN feedback.
Given that collecting sufficient X-ray counts becomes more expensive with higher redshifts, it is observationally unfeasible to systematically search for evolution in the typical mechanical powers of AGN in clusters, since we can only detect the most extreme outbursts even at modest redshift (Figure 5). However, we can search for evolution in the upper envelope of jet powers, by searching for the most extreme outbursts at each redshift. If, for example, we find that clusters at have significantly more AGN with cavity enthalpies ergs, it implies that feedback was more bursty than it is today. Such a conclusion would provide strong constraints for feedback models, leading to improvements in cosmological simulations.
6 Summary
We report the detection of a pair of extended X-ray cavities in the SZ-selected galaxy cluster SPT0528. While these cavities are marginally significant in the X-ray observations alone ( and ), their plausibility is strengthened by additional lines of complementary evidence. First and foremost, the radio structure of this source gives us a jet direction aligned along the cavity axes, which has a 16.7% probability of occurring by chance, making it the likely inflation mechanism. In addition, the two cavities are separated by about the X-ray centroid, which should only occur randomly 0.5% of the time. Combining these probabilities yields a 0.1% chance that these brightness depressions are random fluctuations, equating to a Gaussian significance of 3.3. Further, SPT0528 was initially selected as being among the most radio-loud in the SPT-SZ survey, so a powerful outburst is expected, and is indeed consistent with what is predicted from scaling relations with radio power and mass. Given all of this evidence, SPT0528 appears to be an extraordinary system, and with a power of erg s-1 and total enthalpy of erg it is the most energetic mechanical outburst observed yet.
References
- Allen (1995) Allen, S. W. 1995, MNRAS, 276, 947
- Andersson et al. (2011) Andersson, K., Benson, B. A., Ade, P. A. R., et al. 2011, ApJ, 738, 48
- Benson et al. (2013) Benson, B. A., de Haan, T., Dudley, J. P., et al. 2013, ApJ, 763, 147
- Bleem et al. (2015) Bleem, L. E., Stalder, B., de Haan, T., et al. 2015, ApJS, 216, 27
- Boehringer et al. (1993) Boehringer, H., Voges, W., Fabian, A. C., et al. 1993, MNRAS, 264, L25
- Brodwin et al. (2013) Brodwin, M., Stanford, S. A., Gonzalez, A. H., et al. 2013, ApJ, 779, 138
- Bîrzan et al. (2004) Bîrzan, L., Rafferty, D. A., McNamara, B. R., et al. 2004, ApJ, 607, 800
- Bîrzan et al. (2008) Bîrzan, L., McNamara, B. R., Nulsen, P. E. J., et al. 2008, ApJ, 686, 859
- Bîrzan et al. (2017) Bîrzan, L., Rafferty, D. A., Brüggen, M., et al. 2017, MNRAS, 471, 1766
- Carlstrom et al. (2011) Carlstrom, J. E., Ade, P. A. R., Aird, K. A., et al. 2011, PASP, 123, 568
- Cavagnolo et al. (2010) Cavagnolo, K. W., McNamara, B. R., Nulsen, P. E. J., et al. 2010, ApJ, 720, 1066
- Churazov et al. (2000) Churazov, E., Forman, W., Jones, C., et al. 2000, A&A, 356, 788
- Churazov et al. (2001) Churazov, E., Brüggen, M., Kaiser, C. R., et al. 2001, ApJ, 554, 261
- Condon et al. (2002) Condon, J. J., Cotton, W. D., & Broderick, J. J. 2002, AJ, 124, 675
- Cowie, & Binney (1977) Cowie, L. L., & Binney, J. 1977, ApJ, 215, 723
- Crawford et al. (1999) Crawford, C. S., Allen, S. W., Ebeling, H., et al. 1999, MNRAS, 306, 857
- Donahue et al. (2015) Donahue, M., Connor, T., Fogarty, K., et al. 2015, ApJ, 805, 177
- Dunn et al. (2005) Dunn, R. J. H., Fabian, A. C., & Taylor, G. B. 2005, MNRAS, 364, 1343
- Dunn, & Fabian (2004) Dunn, R. J. H., & Fabian, A. C. 2004, MNRAS, 355, 862
- Edge et al. (1992) Edge, A. C., Stewart, G. C., & Fabian, A. C. 1992, MNRAS, 258, 177
- Fabian, & Nulsen (1977) Fabian, A. C., & Nulsen, P. E. J. 1977, MNRAS, 180, 479
- Fabian (1994) Fabian, A. C. 1994, ARA&A, 32, 277
- Fabian (2012) Fabian, A. C. 2012, ARA&A, 50, 455
- Gupta et al. (2019) Gupta, N., Pannella, M., Mohr, J. J., et al. 2019, arXiv e-prints, arXiv:1906.11388
- Hasselfield et al. (2013) Hasselfield, M., Hilton, M., Marriage, T. A., et al. 2013, J. Cosmology Astropart. Phys, 2013, 008
- Hlavacek-Larrondo et al. (2012) Hlavacek-Larrondo, J., Fabian, A. C., Edge, A. C., et al. 2012, MNRAS, 421, 1360
- Hlavacek-Larrondo et al. (2015) Hlavacek-Larrondo, J., McDonald, M., Benson, B. A., et al. 2015, ApJ, 805, 35
- Hlavacek-Larrondo et al. (2013) Hlavacek-Larrondo, J., Allen, S. W., Taylor, G. B., et al. 2013, ApJ, 777, 163
- Johnstone et al. (1987) Johnstone, R. M., Fabian, A. C., & Nulsen, P. E. J. 1987, MNRAS, 224, 75
- Lotz et al. (2013) Lotz, J. M., Papovich, C., Faber, S. M., et al. 2013, ApJ, 773, 154
- Ma et al. (2011) Ma, C.-J., McNamara, B. R., Nulsen, P. E. J., et al. 2011, ApJ, 740, 51
- Main et al. (2017) Main, R. A., McNamara, B. R., Nulsen, P. E. J., et al. 2017, MNRAS, 464, 4360
- Mauch et al. (2003) Mauch, T., Murphy, T., Buttery, H. J., et al. 2003, MNRAS, 342, 1117
- McDonald et al. (2013) McDonald, M., Benson, B. A., Vikhlinin, A., et al. 2013, ApJ, 774, 23
- McDonald et al. (2017) McDonald, M., Allen, S. W., Bayliss, M., et al. 2017, ApJ, 843, 28
- McDonald et al. (2018) McDonald, M., Gaspari, M., McNamara, B. R., et al. 2018, ApJ, 858, 45
- McNamara, & Nulsen (2012) McNamara, B. R., & Nulsen, P. E. J. 2012, New Journal of Physics, 14, 055023
- McNamara et al. (2009) McNamara, B. R., Kazemzadeh, F., Rafferty, D. A., et al. 2009, ApJ, 698, 594
- McNamara, & Nulsen (2007) McNamara, B. R., & Nulsen, P. E. J. 2007, ARA&A, 45, 117
- McNamara, & O’Connell (1989) McNamara, B. R., & O’Connell, R. W. 1989, AJ, 98, 2018
- O’Dea et al. (2008) O’Dea, C. P., Baum, S. A., Privon, G., et al. 2008, ApJ, 681, 1035
- O’Sullivan et al. (2011) O’Sullivan, E., Giacintucci, S., David, L. P., et al. 2011, ApJ, 735, 11
- Planck Collaboration et al. (2014) Planck Collaboration, Ade, P. A. R., Aghanim, N., et al. 2014, A&A, 571, A29
- Rafferty et al. (2006) Rafferty, D. A., McNamara, B. R., Nulsen, P. E. J., et al. 2006, ApJ, 652, 216
- Reichardt et al. (2013) Reichardt, C. L., Stalder, B., Bleem, L. E., et al. 2013, ApJ, 763, 127
- Sault et al. (1995) Sault, R. J., Teuben, P. J., & Wright, M. C. H. 1995, Astronomical Data Analysis Software and Systems IV, 433
- Semler et al. (2012) Semler, D. R., Šuhada, R., Aird, K. A., et al. 2012, ApJ, 761, 183
- Song et al. (2012) Song, J., Zenteno, A., Stalder, B., et al. 2012, ApJ, 761, 22
- Staniszewski et al. (2009) Staniszewski, Z., Ade, P. A. R., Aird, K. A., et al. 2009, ApJ, 701, 32
- White et al. (1991) White, D. A., Fabian, A. C., Johnstone, R. M., et al. 1991, MNRAS, 252, 72