Modified Lomax Model: A heavy-tailed distribution for fitting large-scale real-world complex networks
Abstract
Real-world networks are generally claimed to be scale-free, meaning that the degree distributions follow the classical power-law, at least asymptotically. Yet, closer observation shows that the classical power-law distribution is often inadequate to meet the data characteristics due to the existence of a clearly identifiable non-linearity in the entire degree distribution in the log-log scale. The present paper proposes a new variant of the popular heavy-tailed Lomax distribution which we named as the Modified Lomax (MLM) distribution that can efficiently capture the crucial aspect of heavy-tailed behavior of the entire degree distribution of real-world complex networks. The proposed MLM model, derived from a hierarchical family of Lomax distributions, can efficiently fit the entire degree distribution of real-world networks without removing lower degree nodes as opposed to the classical power-law based fitting. The MLM distribution belongs to the maximum domain of attraction of the Frechet distribution and is right tail equivalent to Pareto distribution. Various statistical properties including characteristics of the maximum likelihood estimates and asymptotic distributions have also been derived for the proposed MLM model. Finally, the effectiveness of the proposed MLM model is demonstrated through rigorous experiments over fifty real-world complex networks from diverse applied domains.
keywords:
Complex networks; Degree distribution; Lomax distribution; Heavy-tailed distribution; Power-law; Statistical properties.1 Introduction
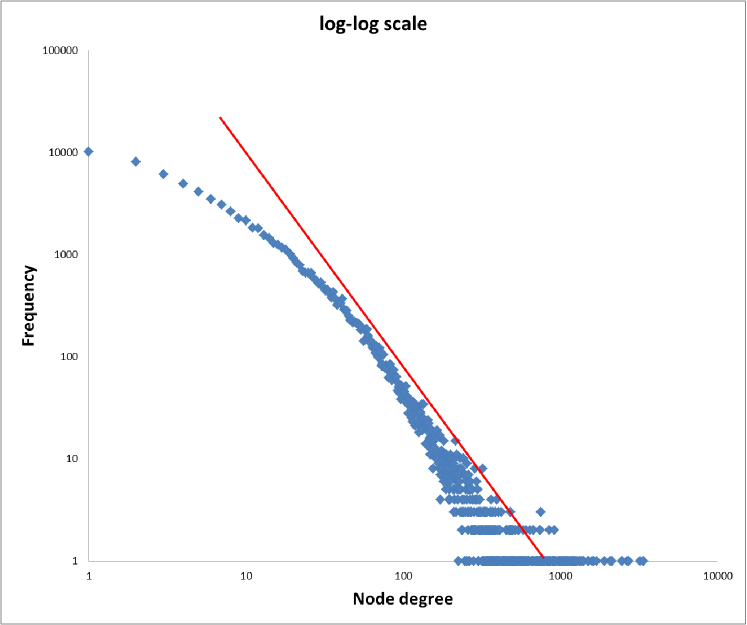
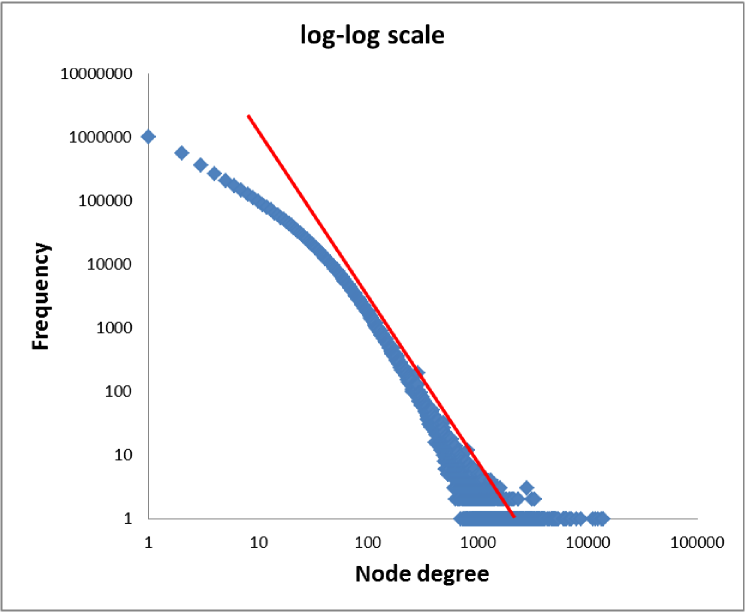
The modeling and structural aspects of large scale real-world complex networks, including social, information, collaboration, communication, etc. have been well studied during the past decade [1, 2, 3, 4, 5] by many researchers. The World Wide Web, Twitter, Orkut, Youtube, DBLP, Wiki talk, Facebook, LinkedIn are examples of such large scale real-world complex networks. These networks are characterized by several important structural, emergent properties like degree distribution, correlation coefficient, average nearest neighbor, average path length, clustering coefficient, community structure, etc. Recently, the modeling and statistical aspects of such emergent structural properties, therefore, remain an important research area in the study of large scale real-world complex networks [6, 4, 7, 8, 9]. In this regard, the node degree distribution has been well studied and viewed as an important structural characteristic of real-world networks [10]. In 1999, Barabasi and Albert [11, 12] modeled the node degree distribution of the World Wide Web (WWW) using a power-law. Since then, many researchers have also favored the use of heavy tailed power-law in modeling the node degree distribution of real-world networks such as collaboration networks, communication networks, social networks, biological networks, etc [13, 14]. Mathematically, a quantity follows a power-law if it is drawn from a probability distribution where, the parameter is a positive constant and is known as exponent or scaling parameter of the distribution. Thus it is common to encounter the claim that most of the real-world networks are scale-free, meaning that the degree distributions follow single power-law. Despite this, a closer observation, while fitting, shows that the classical power-law distribution is often inadequate to meet the data characteristics adequately because of the existence of an identifiable non-linearity (bend) when the entire degree distribution is considered in log-log scale as shown in Figures 1(a) and 1(b) (elaborated later).
This feature (non-linearity) of the entire degree distribution, depending on when and where it is considered or ignored, possibly constitute the reason why the universality vis-a-vis scarcity of scale-free networks has remained controversial ever since its inception [15, 16]. The debate has continued to crop up time and again throughout the last twenty-one years [17, 18, 13, 14] and in very recent times too whence it has been claimed through an empirical and extensive study that the power-law distribution does not fit well in most cases and thereby produces a significant fitting error, followed by counter-claims [19].
This apart, researchers have also argued differently in favor of scale-free structure while suggesting some softer statistical criteria for scale-freeness [20, 21, 22]. Especially significant in this context is the following quote [22]: ”The fact that heavy-tailed distributions occur in complex systems is certainly important (because it implies that extreme events occur more frequently than would otherwise be the case)… However, a statistically sound power-law is no evidence of universality without a concrete underlying theory to support it. Moreover, knowledge of whether or not a distribution is heavy-tailed is far more important than whether it can be fit using a power-law”.
Several other heavy-tailed distributions such as lognormal, Pareto lognormal (PLN), double Pareto lognormal (DPLN), etc. also have been proposed in modeling the degree distribution of real-world networks instead of power-law [18, 23]. Recent research also recognized the deviations from a pure power-law distribution over various network data sets and recommended some other distributions for better modeling the heavy-tailed node degree distribution [21, 24, 25]. Thus, identifying the reasons for deviation of single power-law while fitting and looking for the alternative models which can efficiently capture the crucial aspect of heavy-tailed and long-tailed behaviour of the entire degree distribution of real-worlld complex networks continue to remain a challenging task of current research in the field of complexity science even as it steadily gravitates toward data science [20, 21, 22].
Motivation: Networks are a powerful way to represent and study the structure of real-world complex systems. Across various applied domains of networks, it is common to encounter the claim that most of the real-world networks are scale-free, meaning that the degree distributions follow single power-law, though the universality of scale-free networks remains controversial as already discussed above.
Now consider an example where Figures 1(a) and 1(b) that depict the plot of entire degree distribution in the log-log scale of the Twitter and LiveJournal social networks. The horizontal axis represents the unique degree value (), and the vertical axis represents the corresponding frequency. In these networks, a node represents a single user, and an edge represents a follower of that user. From these figures, it is clear that the pattern of the degree distribution of these networks does not match with the straight-line representation in the log-log scale through a single power-law. Usually, while fitting the node degree distribution, the single power-law is applied only for values of degree higher than some minimum (say, ) and the exponent is estimated from the data using MLE accordingly. Thus power-law distribution provides better fitting or in other words better inclined to the right tail of the data unless otherwise, some “unimportant” (i.e., lower degree) nodes are left out. Analytically, we can say that this inadequacy of fitting a single power-law occurs because of nonlinear behavior of the degree distribution curve in the log-log scale. This motivates the researchers to use other heavy-tailed probability models with non-negative exponent for better modeling the entire degree distribution of real-world networks. To capture these nonlinearities in the degree distribution of the real-world complex networks in a log-log scale, previous studies used various heavy-tailed probability distributions [21, 18, 24]. In this current research, we study the behavior of the entire degree distributions with a new variant of Lomax distribution that has wide applications in the field of actuarial science, reliability modeling, economics and computer science [26, 27, 28, 29]. The Lomax distribution is essentially a Pareto Type-II distribution that has been shifted so that its support begins at zero [27, 26]. Some extension and generalization of the Lomax distribution has been carried out for analyzing reliability and survival data sets in the past [27, 30, 31]. Recent research also focused on a new generalization of Pareto distribution with application to the breaking stress data [32]. This paper proposes a modified Lomax (MLM) distribution to be derived from a hierarchical family of Lomax distributions where the non-negative shape parameter is assumed to be expressible as a nonlinear function of the data.
Our contribution: The major contribution here is to develop a modified Lomax (MLM) distribution from a hierarchical family of Lomax distributions for efficient modeling of the entire degree distribution of real-world complex networks [27, 26]. The reasons for introducing MLM distribution is to provide greater flexibility and better fitting to the entire node degree distribution of complex networks compared to other popularly used heavy-tailed distributions. In other words, the proposed MLM model can be used for effective modeling the degree distribution of complex networks, coming from different disciplines, in the whole range of the data without discarding some of the lower degree nodes. Moreover, some statistical properties including extreme value and asymptotic behavior of the proposed MLM distribution have been studied in this context. We also provide mathematical arguments to explain the behavior of the likelihood surface for this nonlinear variant of the Lomax distribution, i.e., MLM distribution. A sufficient condition for the existence of the global maximum for the likelihood estimates is given using the notion of the coefficient of variations (CV) and discuss the parameter estimation procedures of the proposed MLM distribution. In order to justify the effectiveness of the proposed MLM distribution, we have compared it with the other common power-law-type distributions, viz. power-law, Pareto, lognormal, exponential, power-law with exponential cutoff and Poisson [23, 13, 17]. The goodness-of-fit of the observed degree distribution is evaluated and compared using a few statistical measures, viz. bootstrap Chi-square, KL-divergence (KLD), mean absolute error (MAE) and root mean square error (RMSE). Several real-world complex networks from diverse fields have been used for experimental evaluation. Empirical results confirm the effectiveness of the proposed MLM distribution compared to other common distributions.
The remainder of the paper is organized as follows. Section 2 provides the details of the hierarchical family of Lomax distributions. We propose and interpret proposed modified Lomax (MLM) distribution in Section 3. Section 4 discusses the statistical properties, including extreme value and asymptotic behaviors of the proposed MLM distribution. Section 5 is devoted to the experimental results with a detailed analysis of the results over several real-world complex networks. Finally, Section 6 concludes the paper with a brief discussion.
2 Model
In this section, we first introduce a new family of heavy-tailed Lomax (HLM) distributions. Further, we propose a relevant model from this newly introduced family to model the real-world heavy-tailed network data sets in the whole range.
2.1 Genesis
Lomax distribution has been used as an alternative to exponential, power-law, gamma and weibull distribution for modeling heavy tailed data sets [33, 34, 35, 36]. The cumulative distribution function (CDF) and the probability density function (PDF) of the Lomax model are defined as follows:
Definition 1.
A random variable follows Lomax distribution with parameters and if the CDF is of the form:
where is the shape parameter (real) and is the scale parameter (real). The corresponding PDF is defined as follows:
| (1) |
Below we introduce a new family of heavy tailed Lomax distributions which is right tail-equivalent to a power-law distribution.
Definition 2.
A continuous random variable follows a family of heavy-tailed Lomax (HLM) distributions if and only if it has the following CDF:
| (2) |
and if , where is a real, continuous, positive function which is differentiable on and satisfies the following conditions:
-
1.
The function is strictly positive and have finite limit at infinity, i.e.,
-
2.
-
3.
It can be easily verified that the CDF in (2) satisfying conditions (1), (2) and (3) is a genuine CDF which can also be expressed as follows:
The PDF of this new family of heavy-tailed Lomax distribution is of the form:
There can be a wide variety of choices of satisfying . It is noted that the simplest choice of and corresponds to the Lomax distribution. We further represent this newly introduced family of Lomax distributions as a hierarchical family in accordance with Pareto distribution [37].
Definition 3.
(HLM Type-I family of distributions) Supposed that a random variable folows HLM family of distributions as defined in (2). Then with a scale parameter , the CDF of HLM Type-I family of distributions takes the following form:
By taking , we obtain the classical Pareto Type-I distribution.
Definition 4.
(HLM Type-II family of distribution) Supposed that a random variable folows HLM family of distributions as defined in (2). Then with a location parameter and a scale parameter , the CDF of HLM Type-II family of distributions takes the following form:
By taking , we obtain the Pareto Type-II distribution. Also, in addition corresponds to the Lomax distribution.
Definition 5.
(HLM Type-III family of distribution) Supposed that a random variable folows HLM family of distributions as defined in (2). Then with a location parameter , scale parameters and a shape parameter , the CDF of HLM Type-III family of distributions takes the following form:
By taking , we obtain the Pareto Type-III distribution.
Obviously, the choice of function is subjective and any function satisfying conditions (1), (2) and (3) will give some known (unknown) heavy-tail Lomax distributions.
3 Modified Lomax (MLM) Model
The Lomax distribution does not provide great flexibility in modeling heavy-tailed data sets in the whole range similar to the power-law distribution. Due to this, the trend of parameter(s) induction to the baseline Lomax distribution has received increased attention in the recent years. Several generalized classes of distributions by adding additional parameters such as shape and or scale and or location in the distribution are available such as exponentiated Lomax (EL) [38], Beta-Lomax (BL) [39], exponential Lomax (ELomax) [40], Gamma-Lomax (GL) [41] and Gumbel-Lomax (GuLx) model [42].
This paper provides a new modified version of the Lomax distribution called modified Lomax (MLM) distribution. MLM distribution is shown to be an asymmetric distribution, which provides great fit in modeling large-scale heavy-tailed data sets. The proposed MLM model is derived from the HLM family of distributions (in particular, HLM Type-II model) that can efficiently model the entire degree distribution of real-world networks. In other words, the proposed MLM model can be used for effective modeling the degree distribution of real-worlld complex networks in the whole range without discarding lower degree nodes. We define a relevant model from the newly introduced HLM Type-II family with the location parameter and we choose a flexible function that depends on two shape parameters and satisfying . The rational behind adding an additional shape parameter in the HLM Type-II family of distribution will make the statistical model more flexible, simple and have physical interpretation. This idea of generalization should suffice the practical needs of working with the non linear exponent to address the structural issue (degree distribution) of real-world complex networks.
Now we choose a nonlinear function that adds a nonlinear exponents while fitting heavy-tailed HLM Type-II model in the degree distributions is as follows:
The chosen approaches to from below if as and approaches to from above for as . Note that, the function as defined above includes the constant function (in this case ) as special cases by setting . The derivative of is given by
Now, we define a relevant model with the above choice of in the HLM Type-II model with and name it as Modified Lomax Model to be denoted by . This modification to the Lomax distribution provides more flexibility in the data modeling since the non-negative shape parameter are assumed to be expressed as a nonlinear function of the empirical data. Thus the proposed MLM model with parameters could be useful for modeling the heavy-tailed degree distribution of real-world complex network data sets in the whole range.
Definition 6.
(Modified Lomax Distribution) A continuous random variable follows distribution with and as the shape parameters and as the scale parameter if the CDF takes the following form:
| (3) |
and if . The corresponding PDF is given by,
| (4) |
and if .
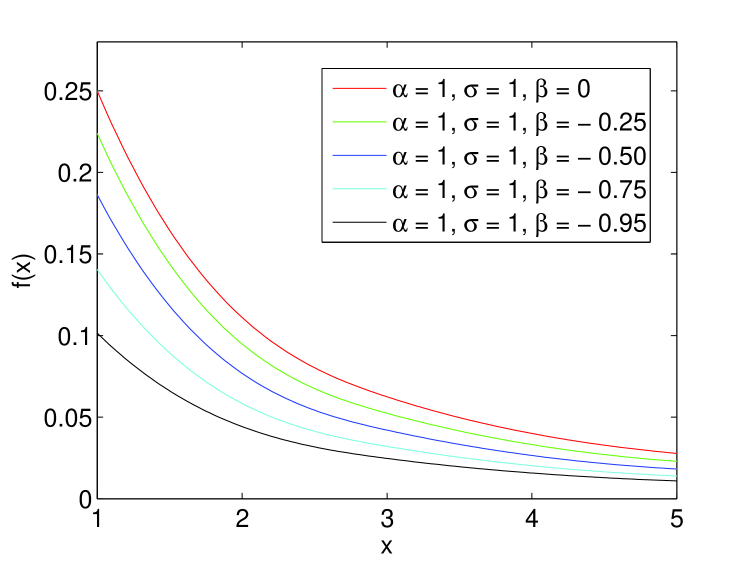
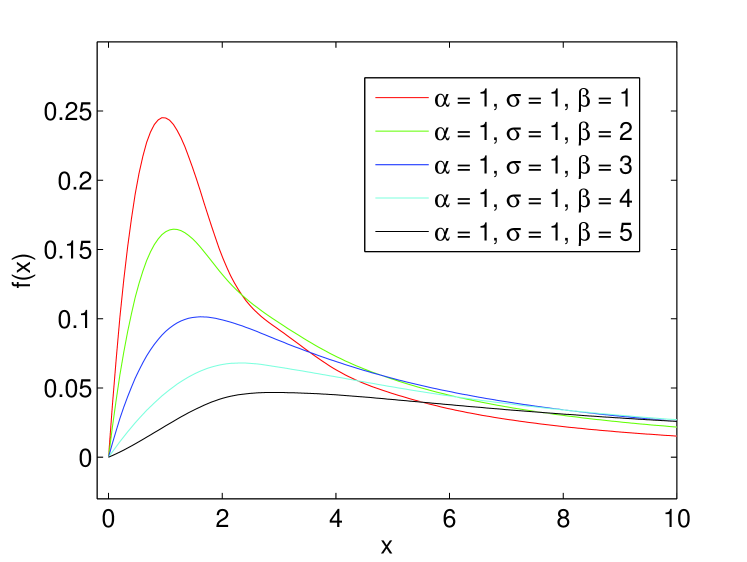
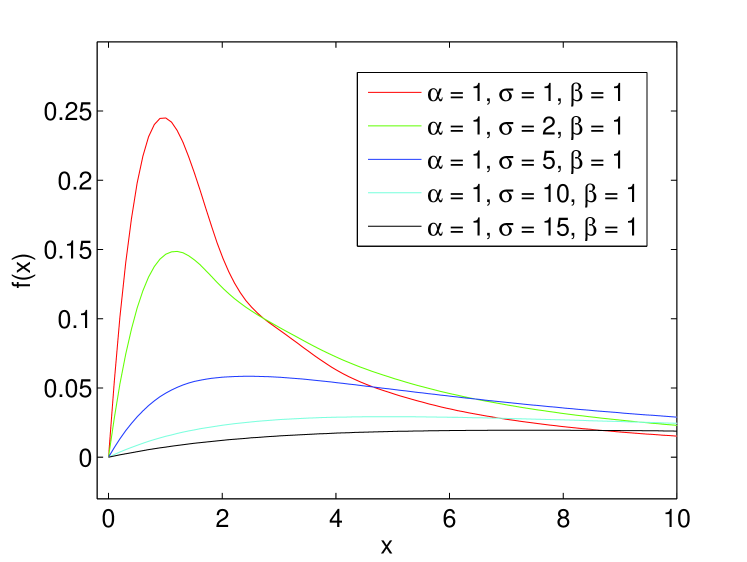
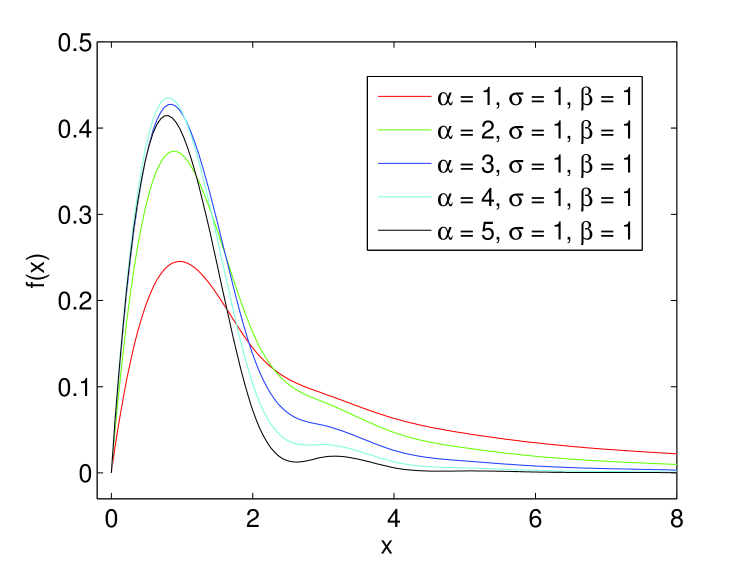
This MLM model includes Lomax distribution as particular case. In addition, it belongs to the new family of HLM Type-II distribution satisfying the condition: . Due to the addition of an additional parameter in the exponents of the Lomax distribution generates various shapes (unimodal and bimodal) and provides greater flexibility (nonlinearity and heavy-tail) as shown in Figure 2. We study the monotonicity for the PDF of the proposed MLM model in Theorem 1 below.
Theorem 1.
Let be the random variable follows distribution, then the PDF as in (4) is a decreasing function for .
Proof.
4 Statistical Properties of the MLM distribution
4.1 Characterization and existence of the likelihood
Initially we characterize the maximum likelihood estimates (MLEs) of the parameters and of a Lomax distribution. Subsequently, we derived a sufficient condition for the existence of MLEs of the MLM distribution using coefficient of variation (CV). Given a set of samples of size , the log-likelihood function for the Lomax distribution, after dividing it by the sample size , is given by
| (6) |
Differentiating (6) w.r.t. and , respectively, we have:
| (7) |
| (8) |
Equating to zero the derivative of w.r.t. in (7), we obtain as follows:
| (9) |
Differentiating (9) w.r.t. we have,
| (10) |
It is important to note that there is no closed form solution to the likelihood based on (7) and (8), and a suitable numerical algorithm (for example, Newton-Raphson method) can be employed to obtain the maximum likelihood estimates (MLEs) of the and . Different estimation procedures of the MLEs have been discussed in previous literature, for example see [43]. But for small or medium-sized samples, anomalous behavior of the likelihood surface can be encountered when sampling from the Lomax distribution. In this paper, we characterize the profile log-likelihood function in terms of the coefficient of variation (CV), defined as follows:
Definition 7.
The CV is the ratio of the standard deviation to the mean ,
where and .
By using standard notation, the profile log-likelihood function based on equation 6, is given by
| (11) |
Differentiating (11) w.r.t. , we have the following:
| (12) |
Below we present the following lemmas which will be useful to find the sufficient condition for the existence for the global maximum of the profile log-likelihood function (11).
Lemma 1.
The following limit holds:
-
1.
-
2.
-
3.
Proof.
The proof is elementary and can easily be done using series expansions. ∎
Lemma 2.
The following limit holds:
-
1.
-
2.
where is the sample mean;
-
3.
Proof.
A sufficient condition for monotonic increasing (decreasing) for the profile log-likelihood function is presented in Theorem (2) below, for sufficiently large . Also, we present a sufficient condition for the existence of global maximum corresponding to the likelihood function for the Lomax distribution to be at a finite point in Corollary (1).
Theorem 2.
Let follows distribution with . A sufficient condition for to be monotonically decreasing function is CV for , and if CV, it is monotonically increasing.
Proof.
Using (9) and (10) in Eqn. (12), we can write as:
| (13) |
Using the limits of Lemma (1) in Eqn. (13), we have
| (14) |
Finally, we note that when the R.H.S of Eqn.(14) is strictly greater than 0. Alternatively, the likelihood function is monotonic decreasing when , or, equivalently, CV In a similar way, we can show that if CV, then the is monotonic increasing function for sufficiently large . ∎
Remark 1.
Corollary 1.
Given a set of samples of numbers with CV, the profile likelihood function for the distribution has a global maximum at a finite point.
Proof.
Remark 2.
Corollary 1 shows that the likelihood function for the Lomax distribution has a global maximum for the samples with CV at a finite point. The calculation of CV is completely based on available empirical data and easy to compute. The existence of MLE based on CV for the MLM distribution will also holds as because MLM model reduce to Lomax distribution when . This can be empirically validated in section 55.3 and will be useful useful from practitioner’s point of view.
4.2 MLE of parameters
In this section, the maximum likelihood estimates are derived for parameters of MLM distribution. Let be a sample of size from MLM() distribution. Then the log-likelihood function for the vector of parameters is given by
| (17) |
The maximum likelihood estimate for the parameters ,, and are given by ,, and , are obtained by maximizing the likelihood function in Equation (17). The first-order partial derivatives of (1) with respect to , , and are
| (18) |
| (19) |
| (20) |
where .
The MLEs of the three parameters of the MLM() distributions are obtained by setting these above equations to zero and solving them simultaneously. Closed forms of the solutions are not available for the equations (18), (19) and (20). So, iterative methods will be applied to solve these equations numerically.
4.3 Asymptotic distribution
Fisher information matrix, a measure of the information content of the data relative to the parameters to be estimated, plays an important role in parameter estimation. The Fisher information matrix can be obtained by taking the expected values of the second-order and mixed partial derivatives of w.r.t. , , and . Since, the analytical expression is hard to compute. Thus, it can be approximated by numerically investing the the matrix. The asymptotic matrix can be given as follows:
The second and mixed partial derivatives of the log likelihood function are obtained as follows:
| (21) |
| (22) |
| (23) |
| (24) |
| (25) |
| (26) |
The variance-covariance matrix is approximated by where . The asymptotic distribution of MLEs for , , and can be written as
Then the approximate confidence intervals for , , and are given by , , and , where and is the upper 100 k-th percentile of the standard normal distribution.
4.4 Extreme value properties
Here we study some of the interesting extreme value theoretic properties. The concept of regular variation is an important notion of extreme value theory. Below we show the extreme value results for the MLM distribution that can characterize the asymptotic behavior of extremes along with well grounded statistical theory.
Definition 8.
(Maximum domain of attraction) A function is said to be regularly varying at infinity, if for every
Then we say that is a function with regularly varying tails with as the tail index and belongs to the maximum domain of attraction (MDA) of the Frechet distribution with index .
Theorem 3.
The CDF (Eqn. 3) of the distribution is a function with regularly varying tails and it belongs to MDA of the Frechet distribution with index .
Proof.
| (27) |
Now, we have (using expansions of and ):
| (28) |
Using Eqn. (27) and (28) together, we get
| (29) |
Similarly for , Eqn. (29) becomes
| (30) |
Now,
Thus, . ∎
Now we study the tail-equivalent and heavy-tailed behaviour of the proposed MLM distribution as follows:
Definition 9.
(Tail-equivalent) Two distributions and are said to be tail-equivalent if
Theorem 4.
The distribution, defined in Eqn. (3), is right tail-equivalent to the power-law distribution.
Proof.
Let be the CDF of the power-law distribution, i.e.,
and is the CDF of MLM distribution as given in Eqn.(3). Then,
∎
Definition 10.
(Heavy-tailed distribution) A distribution function is heavy-tailed if
Theorem 5.
The distributions, defined in Eqn. (3), are heavy-tailed distributions.
Proof.
since for any and for sufficiently large . ∎
There are two other important class of distributions [44] viz. the class of dominated-variation distributions and and the class of long-tailed distributions that are used in the risk theory and queueing theory. The proposed MLM distributions also follows these two properties.
Definition 11.
A distribution belong to the class of dominated-variation distributions if
Theorem 6.
If , then distribution, defined in Eqn. (3), belongs to the class of dominated-variation distributions.
Proof.
where . ∎
Definition 12.
A distribution is said to belong to the class of long-tailed distributions if has right unbounded support and, for any fixed ,
Theorem 7.
The distribution, defined in Eqn. (3), belongs to the class of long-tailed distributions.
Proof.
∎
We have shown that the proposed MLM distributions are heavy-tailed and also possess the additional regularity property of subexponentiality [45] as given below. Essentially this corresponds to good tail behaviour under the operation of convolution.
Definition 13.
(Subexponential distribution) We say that a distribution is subexponential if
where denotes the convolution operation.
Theorem 8.
The distribution, defined in Eqn. (3), is subexponential.
Proof.
Definition 14.
(Von-Mises type function) A distribution function is called a Von-Mises type function if
where denotes the right extremity of the distribution function [44].
Theorem 9.
The distribution, defined in Eqn. (3), satisfies the Von-Mises condition.
Proof.
∎
5 Experimental Analysis
5.1 Description of data sets
We present here the results of fitting modified Lomax (MLM) distribution over 50 real-worlld complex networks [47, 48] coming from broad variety of different disciplines such as Social Networks, Collaboration Networks, Communication Networks, Citation Networks, Temporal Networks, Web Graphs, Product co-purchasing Networks, Biological Networks, Brain Networks, etc. Please go through the supplementary materials for more details about the data sets under consideration. Some statistical measures of the data sets and the detailed experimentation of the performances of the proposed MLM distribution compared to the other common power-law related distribution such as Lomax, Pareto, Log-normal, power-law cutoff, Exponential and Poisson are discussed in the following sub sections.
5.2 Performance measures
Here we use some evaluation measures which justify that the degree distribution of a real-world complex network can plausibly been drawn from the proposed MLM distribution. As here the actual distribution is discrete, we can quantify the goodness-of-fit test (i.e., how closely a hypothesized distribution resembles the actual distribution) by calculating the Chi-square statistic value based on bootstrap resampling by generating 50000 synthetic data sets. The Chi-square test will return a value which quantifies the probability that our data were drawn from the hypothesized distribution. If the value is small (less than the significance level), we can reject the null hypothesis that the data come from the MLM distribution. We have also computed few other statistical measures such as KL-divergence, RMSE and MAE for quantifying the goodness-of-fit of the proposed MLM distribution model in comparison to the other standard distribution functions related to other heavy-tailed distributions.
5.3 Analysis of results
Data No. of No. of Stat. Prop. Estimated Bootstrap sets nodes edges parameters chi-square value Social ego-Twitter(In) 81,306 1,768,149 57.965 21.747 2.6654 1.9922 -0.3591 30.543 0.9920 Networks ego-Gplus(In) 107,614 13,673,453 1404.8 283.42 4.9568 0.7108 -0.4983 23.077 0.9963 soc-Slashdot 70,068 358,647 35.069 10.237 3.426 0.8663 -0.6228 1.0461 0.9955 soc-Delicious(In) 536,108 1,365,961 39.826 10.673 3.7312 1.3630 -0.6819 5.3709 0.9960 soc-Digg(In) 770,799 5,907,132 166.61 46.584 3.5765 0.7931 -0.6928 5.5163 0.9890 soc-Academia 200,169 1,398,063 48.297 14.259 3.3871 2.7429 -0.3737 36.644 0.6087 LiveJournal(In) 4,847,571 68,993,773 44.969 15.368 2.926 2.6892 -0.7272 51.933 0.8983 Dogster-Friendship 426,821 8,546,581 284.06 40.033 7.095 1.5634 0.3108 14.057 0.9500 Higgs-Twitter(In) 456,626 14,855,842 350.91 54.786 6.4051 1.6797 -0.0347 36.204 0.9870 Artist-Facebook 50,615 819,307 63.427 32.366 1.9596 2.0117 -0.1445 39.337 0.9812 Athletes-Facebook 13,866 86,859 17.978 12.438 1.4453 3.1229 0.1406 21.180 0.9640 Citation cit-HepTh(In) 27,770 352,807 43.139 15.220 2.8342 1.8410 -0.3093 16.416 0.8730 Networks cit-HepPh(In) 34,546 421,578 27.286 14.933 1.8271 2.5553 -0.3622 34.349 0.9900 cit-Patents(In) 3,774,768 16,518,948 6.9125 5.0687 1.3637 4.4822 -0.2534 21.689 0.8080 cit-Citeseer(In) 227,320 814,134 9.8260 5.4322 1.8088 2.2630 -0.2788 7.4150 0.6350 Collaboration ca-CondMat 23,133 93,497 10.671 8.0189 1.3308 3.1068 0.3615 10.5353 0.9896 Networks ca-AstroPh 18,772 198,110 30.568 21.103 1.4484 16.434 37.276 0.0101 0.9990 ca-GrQc 5,242 14,496 7.9186 5.5284 1.4322 2.2624 3.5861 0.6765 0.7849 ca-HepPh 12,008 118,521 46.654 19.696 2.3687 0.9798 2.8780 0.6791 0.8163 ca-HepTh 9,877 25,998 6.1867 5.2618 1.1757 2.9417 5.2791 0.4825 0.9332 Web Google(In) 875,713 5,105,039 43.320 7.1444 6.0634 1.1999 -0.6399 2.0429 0.9780 Graphs BerkStan(In) 685,230 7,600,595 300.08 12.316 24.364 1.4129 1.8449 0.7592 0.6250 Wikipedia2009(In) 1,864,433 4,507,315 12.846 4.8903 2.6268 1.3988 -0.6291 1.9658 0.9891 WikipediaLinkFr(In) 4,906,478 113,122,279 1864.4 48.608 38.356 1.0988 -0.7123 9.8888 0.9152 Hudong(In) 1,984,484 14,869,483 199.28 16.467 12.101 1.1567 10.921 0.0013 0.9883 Biological Yeast-PPIN 2,361 7,182 8.0800 6.0838 1.3281 10.535 -0.4527 175.29 0.9930 Networks Diseasome 3,926 7,823 9.1009 5.5334 1.6447 10.9688 -0.9493 134.52 0.8090 Bio-Mouse-Gene 45,101 14,506,199 856.67 643.27 1.3317 6.3e-08 -1.2e-02 2.1e+00 0.9898 Bio-Dmela 7,393 25569 10.782 6.9170 1.5587 14.979 -0.5053 498.27 0.9806 Bio-WormNet-v3 16,347 762,822 138.17 93.328 1.4805 5.6496 -0.9801 704.71 0.9938 Product amazon0601(In) 403,394 3,387,388 15.279 8.3989 1.8191 3.8261 -.7137 19.522 0.6010 co-purchasing amazon0505(In) 410,236 3,356,828 15.313 8.1826 1.8714 3.8367 -0.8006 19.984 0.6880 networks amazon0312(In) 400,727 3,200,444 15.073 7.9865 1.8873 3.7631 -0.8179 18.747 0.5890 Temporal sx-mathoverflow(In) 24,818 506,550 31.476 10.424 3.0195 1.4452 2.4236 0.8241 0.9846 Networks sx-stackoverflow(In) 2,601,977 63,497,050 186.00 27.647 6.7278 1.0218 -0.8224 4.4865 0.9490 sx-superuser(In) 194,085 1,443,339 23.782 5.8239 4.0836 1.7401 2.1405 0.7284 0.9780 sx-askubuntu (In) 159,316 964,437 18.404 4.3856 4.1966 2.1923 2.2069 0.7665 0.9300 Communication Email-Enron 36,692 183,831 36.100 10.021 3.6027 1.2417 -0.1275 2.9045 0.9641 Networks Wiki-Talk(In) 2,394,385 5,021,410 12.259 2.1195 5.7844 1.5167 -0.2846 0.0016 0.9900 Rec-Libimseti(In) 220,970 17,359,346 413.71 102.85 4.0227 2.5008 -0.8496 331.18 0.9670 Ground-truth Wiki-Topcats 1,791,489 28,511,807 283.78 15.915 17.831 1.1811 0.1998 2.6412 0.8310 Networks com-Friendster 65,608,366 1,806,067,135 137.81 55.056 2.5031 4.5863 -0.9188 590.01 0.9000 com-LiveJournal 3,997,962 34,681,189 42.957 17.349 2.4759 2.8206 -0.6020 65.638 0.7980 com-Orkut 3,072,441 117,185,083 154.78 76.281 2.0291 3.7049 0.1292 167.93 0.9890 com-Youtube 1,134,890 2,987,624 50.754 5.2650 9.6398 1.6113 8.3355 0.0094 0.8410 Brain Human25890-session1 177,584 15,669,036 319.01 176.47 1.8078 1.6098 -0.2076 168.75 0.8710 Networks Human25890-session2 723,881 158,147,409 667.91 436.94 1.5286 14.423 -0.3466 18886.3 0.9980 Human25864-session2 692,957 133,727,516 554.48 385.96 1.4366 16.250 -0.3379 19217.8 0.9660 Human25913-session2 726,197 183,978,766 446.92 258.99 1.7256 7.1013 -0.4681 5779.8 0.9290 Human25886-session1 780,185 158,184,747 558.41 405.50 1.3771 21.591 -0.3119 26975.9 0.9768
Table 1 represents some of the statistical measures corresponding to the network data and also provides the statistical evidences of the proposed fitting over the node degree distribution in the whole range using MLM distribution. CV is also calculated corresponding to each of the degree distribution data and it gives us the sufficient condition for the existence of the global maximum at finite point of the distribution. From Table 1 it is clear that that the value of CV is greater than 1 in all the network data sets under consideration. Thus it confirms that the maximum likelihood estimates for the parameters of the proposed MLM distribution attain at the finite points which has been theoretically described in Section 44.1. To estimate the parameters of the MLM distribution numerically, we have used ”optim” function along with the quasi-Newton L-BFGS-B algorithm in R statistical software by taking the initial parameters value . The estimated values of the parameters for all the data sets satisfied the condition, i.e., as clearly seen in Table 1, for the complete characterization of the proposed MLM distribution. Empirically it is observed that in almost all the cases the estimated value of the parameter attains the higher values as compared to the estimated value of . On the other hand, the estimated value of the parameter lies between lies between and except a few which can be clearly seen from Table 1.
Furthermore, we leverage one of the popular statistical method viz. bootstrapping chi-square test to evaluate the goodness-of-fit test of the proposed MLM distribution. From Table 1, it is clear that the proposed MLM distribution produces higher p values (i.e. closure to 1) in almost all the data sets which suggest that the null hypothesis i.e. the data drawn from MLM distribution cannot be ruled out at the level of significance. This indicates that the observed degree distribution is plausibly drawn from the MLM distribution. Thus from Table 1 it can be concluded that the proposed MLM distribution is effective in modeling the entire degree distribution of real-worlld complex networks without ignoring some of the lower degree nodes as oppose to the procedure of fitting power law distribution. In addition, we also used some other statical measures viz. KLD, RMSE and MAE in order to compare the performance of the proposed MLM distribution with the each of the other common power-law related distributions as given in the following Tables 2 and 3.
Data MLM Lomax Power-law Pareto sets RMSE KLD MAE RMSE KLD MAE RMSE KLD MAE RMSE KLD MAE Social ego-Twitter(In) 16.800 0.00819 1.3498 29.366 0.01354 2.4701 204.35 0.1831 10.847 354.25 0.2857 15.603 Networks ego-Gplus(In) 1.6115 0.05601 0.1825 10.491 0.06444 0.3033 53.064 0.2299 0.9221 86.955 0.3113 1.1847 soc-Slashdot 31.527 0.01365 2.3951 32.065 0.014102 2.4658 247.87 0.1007 10.074 247.84 0.1007 10.073 soc-Delicious(In) 79.809 0.00839 3.7730 91.993 0.01326 4.8060 349.66 0.2021 14.867 471.02 0.1349 17.874 soc-Digg(In) 13.634 0.02182 0.8440 24.841 0.02391 1.0269 208.01 0.1601 4.2185 212.87 0.1601 4.2312 soc-Academia 16.323 0.00351 0.5705 48.951 0.01019 1.6178 229.54 0.2027 6.3889 440.15 0.274 10.464 LiveJournal(In) 243.99 6.13e-04 5.4026 1764.9 0.02111 54.400 5025.2 0.1614 127.98 8100.9 0.1785 164.18 Dogster-Friendship 32.203 0.01328 0.8502 36.449 0.01700 1.0755 358.27 0.2926 5.6815 549.57 0.4618 7.6734 Higgs-Twitter(In) 19.821 0.00785 0.4710 20.609 0.00793 0.4621 260.32 0.2492 4.8938 524.96 0.4806 7.6938 Artist-Facebook 11.708 0.01079 2.1381 12.923 0.01199 2.6173 100.49 0.1643 14.552 350.05 0.4010 26.467 Athletes-Facebook 4.4304 0.00879 1.3252 9.2379 0.00966 1.8260 100.16 0.2049 13.387 204.91 0.4164 23.839 Citation cit-HepTh(In) 3.2640 0.01354 0.5071 7.9393 0.01585 0.7585 73.531 0.1741 4.0821 122.79 0.2566 5.997 Networks cit-HepPh(In) 9.6810 0.00821 1.9016 21.303 0.01317 3.1135 128.55 0.1825 13.234 257.41 0.2689 21.445 cit-Patents(In) 445.80 1.61e-04 47.603 2577.5 0.00192 230.35 27.5K 0.2266 2049.5 34.8K 0.2366 2533.2 cit-Citeseer(In) 40.728 0.00228 3.3778 28.032 0.00278 3.3902 889.88 0.3308 49.467 1156.2 0.2916 62.026 Collaboration ca-CondMat 14.830 0.00479 4.1570 36.094 0.00814 7.3904 107.86 0.1025 26.092 469.12 0.3738 63.075 Networks ca-AstroPh 23.890 0.02756 5.9796 32.799 0.03457 7.4448 92.255 0.1753 15.158 251.03 0.3816 27.707 ca-GrQc 15.850 0.03055 7.2247 35.935 0.04013 12.286 124.24 0.2554 27.137 202.33 0.2741 44.221 ca-HepPh 13.944 0.06959 4.1919 19.607 0.07266 4.7763 75.071 0.1769 8.0906 144.39 0.2569 14.668 ca-HepTh 23.280 0.00896 10.851 61.797 0.01353 20.391 268.91 0.2346 66.108 437.19 0.2829 106.36 Web Google(In) 360.62 0.01368 13.845 337.68 0.01546 14.201 1809.1 0.124 45.023 1809.2 0.124 45.023 Graphs BerkStan(In) 71.819 0.03116 0.9478 105.20 0.0346 1.1962 615.03 0.1863 4.0722 615.01 0.1863 4.0721 Wikipedia2009(In) 86.510 0.00169 7.7498 103.94 0.00197 8.5289 4371.9 0.1352 164.58 4371.9 0.1352 164.58 WikipediaLinkFr(In) 124.98 0.01776 0.3174 146.14 0.03082 0.4465 248.09 0.1518 0.7857 397.39 0.1521 1.0815 Hudong(In) 8.0517 0.00433 0.2508 25.163 0.00525 0.4600 587.21 0.0868 4.6828 587.22 0.0868 4.6828 Biological Yeast-PPIN 4.3766 0.01487 2.6321 12.651 0.02389 5.4529 75.325 0.1999 19.013 77.455 0.1998 19.079 Networks Diseasome 8.8683 0.08000 2.7445 12.451 0.10202 3.4575 26.006 0.2248 5.3567 26.005 0.2248 5.3566 Bio-Mouse-Gene 7.6919 0.18941 2.2557 14.654 0.19473 2.3919 41.371 0.4566 3.9018 92.539 0.5373 4.7342 Bio-Dmela 16.173 0.01305 4.0968 10.579 0.01759 3.8219 143.71 0.1907 21.415 143.67 0.1907 21.414 Bio-WormNet-v3 14.054 0.04648 2.6066 13.018 0.09249 3.7468 46.259 0.2761 6.8867 101.89 0.3744 9.0163 Product amazon0601(In) 94.347 0.00374 8.1863 147.602 0.00695 10.928 1495.4 0.2708 70.281 2539.8 0.4022 114.59 co-purchasing amazon0505(In) 109.95 0.00412 9.1836 94.048 0.00499 8.7882 1572.9 0.2463 73.003 2494.5 0.3711 111.56 networks amazon0312(In) 100.89 0.00430 8.5465 92.525 0.00495 8.5742 1564.4 0.2425 71.875 2462.9 0.3686 109.21 Temporal sx-mathoverflow(In) 19.706 0.01879 2.4647 38.764 0.02621 3.7877 213.91 0.2131 13.600 213.82 0.2132 13.612 Networks sx-stackoverflow(In) 39.654 0.00336 0.8694 62.254 0.00345 1.0741 1877.5 0.2016 14.007 1884.7 0.2017 14.017 sx-superuser(In) 79.777 0.00654 4.5409 136.85 0.01045 6.8313 900.04 0.1808 33.837 900.33 0.1808 33.839 sx-askubuntu(In) 106.04 0.01100 6.2022 176.58 0.01707 9.3509 949.66 0.2091 39.419 949.73 0.2091 39.420 Communication Email-Enron 74.667 0.03523 5.2075 76.155 0.03531 5.2347 246.51 0.1779 14.886 245.25 0.1778 14.859 Networks Wiki-Talk(In) 670.47 0.00356 25.871 671.76 0.00357 25.898 9669.4 0.3376 293.63 9669.4 0.3376 293.63 Rec-Libimseti(In) 23.341 0.02163 0.4953 66.434 0.09978 1.7923 77.081 0.2198 2.1486 133.91 0.2096 2.7441 Ground-truth Wiki-Topcats 11.375 0.00190 0.1011 14.955 0.00201 0.1347 565.21 0.1377 2.6145 930.44 0.1612 3.8073 Networks com-Friendster 8266.8 0.00126 411.15 41.69K 0.06401 3385.2 71.5K 0.1498 4575.6 129K 0.1498 5591.7 com-LiveJournal 165.79 0.00084 6.9832 1741.3 0.02462 50.318 4102.9 0.1823 106.85 7116.4 0.2147 150.46 com-Orkut 197.89 0.00793 7.0113 207.43 0.01049 9.9761 2443.6 0.5498 80.712 4299.3 0.8033 101.64 com-Youtube 53.288 0.00122 0.6984 81.409 0.00175 1.0862 1380.5 0.1342 15.690 1380.5 0.1342 15.691 Brain Human25890-session1 17.309 0.01920 3.7439 19.545 0.02264 4.0023 305.41 0.3397 22.537 588.71 0.5598 30.333 Networks Human25890-session2 46.276 0.01024 5.8781 97.122 0.04774 15.303 794.95 0.4462 50.379 1623.8 0.6513 63.754 Human25864-session2 64.037 0.01321 9.8670 111.45 0.05335 20.876 1120.3 0.4967 68.172 1711.3 0.6419 78.736 Human25913-session2 112.661 0.01347 11.574 119.54 0.04719 20.971 904.76 0.2764 58.999 1892.4 0.4566 81.206 Human25886-session1 65.181 0.01471 12.051 116.78 0.05476 23.396 978.66 0.4664 69.517 1873.6 0.6805 86.597
Tables 2 and 3 depict the values of different statistical measures (viz. RMSE, MAE and KLD) which has been used for the measure of performances of the MLM distribution in comparison to the competitive distributions while modeling the data. RMSE and MAE are two different variants, carrying information about the differences between actual and predicted degree frequencies corresponding to a network. Higher similarity between actual and mapped distributions is achieved by generating smaller values of RMSE and MAE. From Tables 2 and 3, it is clear that the proposed MLM distribution provides smaller RMSE and MAE values compared to other competitive distributions in almost all the networks except a few where the power-law cutoff distribution outperforms the others. The worst performance observed for the poisson distribution in minimizing the RMSE and MAE values compared to the other competing distributions over all the real-worlld networks as clearly seen from Table 3. The Kullback-Leibler divergence (KLD), or relative entropy, is a quantity which measures the dissimilarity between two probability distributions. Thus the smaller value of KLD represents the higher similarity between the actual and the predicted distribution. From Tables 2 and 3 it is clear that the proposed MLM distribution generates smaller KLD values compared to other competitive distributions in almost all the networks except a few where power-law cutoff distribution outperforms the others. This indicates that the observed degree distribution satisfactorily matches the proposed MLM distribution in almost all the networks. Note that, in terms of KLD, the Poisson and Exponential distributions always perform worse than the others in all the networks as in the case RMSE and MAE. The performance of the proposed MLM distribution is always superior to the competitive in terms of KLD over almost all the networks. Thus overall, by considering RMSE, MAE and KLD values, the performance of the proposed MLM distribution for all the networks is found to be better than the other competing distributions which suggest that the observed distribution plausibly comes from the proposed MLM distribution.
Data Log-normal Poisson Power-law Exponential sets Cutoff RMSE KLD MAE RMSE KLD MAE RMSE KLD MAE RMSE KLD MAE Social ego-Twitter(In) 53.863 0.0169 2.9494 410.93 10.452 36.645 68.004 0.0397 4.1974 157.98 0.2733 11.567 Networks ego-Gplus(In) 10.155 0.0678 0.2523 95.967 25.317 3.0371 30.925 0.1475 0.6821 50.098 1.3131 1.8328 soc-Slashdot 237.63 0.1058 10.549 684.36 10.069 42.407 19.598 0.0075 1.3599 434.25 0.6381 22.275 soc-Delicious(In) 281.34 0.0579 10.781 957.82 6.8432 56.634 66.896 0.0185 4.2366 535.11 0.4626 25.304 soc-Digg(In) 69.438 0.0552 1.9087 323.59 21.541 15.134 65.713 0.0441 1.9042 204.50 0.8907 8.0015 soc-Academia 91.003 0.0169 2.0921 542.38 7.2349 22.153 62.376 0.0255 1.9845 198.11 0.1924 6.6739 LiveJournal(In) 3473.6 0.0355 70.64 13.61K 9.1120 481.38 808.79 0.0101 24.501 7017.9 0.3449 186.01 Dogster-Friendship 42.539 0.0272 1.1459 494.49 14.575 15.309 182.47 0.1862 4.1579 165.19 0.4765 5.4623 Higgs-Twitter(In) 41.955 0.0134 0.5995 448.91 16.309 14.753 118.23 0.0914 2.8051 134.68 0.3163 4.4689 Artist-Facebook 24.071 0.0154 3.026 323.46 12.537 53.920 56.801 0.0458 6.6452 88.351 0.1799 13.623 Athletes-Facebook 15.461 0.0127 2.5674 175.95 4.7428 35.815 25.099 0.0324 4.3180 28.388 0.0586 6.2610 Citation cit-HepTh(In) 22.59 0.0255 2.331 153.39 8.0679 13.774 25.42 0.0464 2.816 58.74 0.2778 4.5286 Networks cit-HepPh(In) 44.951 0.0189 4.4405 303.32 7.9234 46.775 36.887 0.0221 4.5287 107.32 0.1801 14.145 cit-Patents(In) 9612.7 0.0192 725.71 38.2K 1.6549 3657.1 2424.5 0.0061 271.89 13.2K 0.0659 1147.5 cit-Citeseer(In) 353.26 0.0299 21.921 1507.6 2.566 109.15 195.67 0.0131 13.877 629.02 0.1486 44.301 Collaboration ca-CondMat 42.665 0.0082 6.5746 378.65 2.7263 80.781 62.929 0.0287 13.362 64.985 0.0472 16.873 Networks ca-AstroPh 28.209 0.0312 6.8565 229.81 9.8703 55.51 50.604 0.0384 7.4579 68.185 0.1235 14.361 ca-GrQc 30.184 0.0515 12.148 193.94 2.3256 63.61 58.305 0.0659 18.259 69.169 0.1418 25.759 ca-HepPh 29.993 0.1011 6.8958 185.48 11.609 39.673 50.717 0.1128 8.2477 89.936 0.5187 17.589 ca-HepTh 55.618 0.0178 21.032 370.15 1.5051 133.68 89.425 0.0245 27.613 109.96 0.0551 43.882 Web Google(In) 1514.5 0.0878 40.067 4442.6 4.712 154.92 188.01 0.0157 9.6549 2589.4 0.4419 76.441 Graphs BerkStan(In) 185.04 0.1002 2.0198 993.01 7.0379 11.9628 322.63 0.1037 2.8203 595.53 0.7438 6.6185 Wikipedia2009(In) 2720.9 0.0798 116.43 8425.7 3.6475 398.72 781.87 0.0082 35.531 4727.1 0.3431 213.66 WikipediaLinkFr(In) 240.18 0.0543 0.5234 762.72 25.726 4.0278 121.31 0.0622 0.5006 534.61 1.0217 2.0471 Hudong(In) 746.47 0.1593 6.5493 1975.73 11.088 25.837 75.362 0.0063 0.8323 1494.8 1.1798 15.836 Biological Yeast-PPIN 29.928 0.0496 9.3869 109.62 2.5149 39.181 4.9595 0.0175 2.9178 45.462 0.1234 13.786 Networks Diseasome 23.282 0.1552 4.8906 55.985 3.0101 12.001 9.3332 0.0822 2.8587 31.709 0.2979 5.7013 Bio-Mouse-Gene 17.199 0.1878 2.5372 101.23 15.318 10.254 9.277 0.0943 1.6036 31.649 0.4882 3.6376 Bio-Dmela 46.271 0.0426 9.2857 206.44 3.6221 45.991 24.091 0.0162 5.0541 86.659 0.1724 18.048 Bio-WormNet-v3 17.726 0.0851 3.9352 104.46 18.563 21.927 6.7764 0.0419 2.2424 40.795 0.3082 7.0826 Product amazon0601(In) 286.61 0.0102 16.881 2064.6 2.7267 140.46 297.39 0.0382 22.199 308.32 0.0574 24.114 co-purchasing amazon0505(In) 358.59 0.0125 19.123 2172.5 3.0551 144.34 260.85 0.0342 20.136 390.13 0.0628 26.178 networks amazon0312(In) 338.03 0.0116 17.742 2131.9 2.6839 140.75 273.39 0.0352 20.381 383.82 0.0639 26.299 Temporal sx-mathoverflow(In) 41.934 0.0634 5.3161 281.78 8.0773 32.868 92.603 0.0861 7.9912 129.69 0.4636 15.172 Networks sx-stackoverflow(In) 341.96 0.0286 4.4267 2469.6 18.054 42.111 740.18 0.0685 7.2275 1324.4 0.6829 19.362 sx-superuser(In) 243.42 0.0616 13.199 1246.2 3.8103 68.010 354.72 0.0570 16.613 609.40 0.3891 34.655 sx-askubuntu(In) 212.91 0.0649 12.451 1228.7 2.6253 68.973 389.14 0.0719 20.113 555.44 0.3433 33.693 Communication Email-Enron 121.47 0.0873 8.445 426.39 6.8601 38.373 95.468 0.0689 7.664 230.41 0.5405 18.139 Networks Wiki-Talk(In) 7978.6 0.1902 246.26 21.9K 1.2506 646.54 672.32 0.0036 25.905 16.5K 0.4879 542.31 Rec-Libimseti(In) 87.472 0.0755 1.4021 281.18 30.222 8.0019 28.059 0.0359 0.6971 166.18 0.8547 3.9402 Ground-truth Wiki-Topcats 272.99 0.0464 1.5159 1477.2 8.7468 12.121 389.86 0.0629 2.2289 832.23 0.6767 5.8936 Networks com-Friendster 101K 0.0762 4022.8 280K 24.658 22.1K 17.8K 0.0052 1025.5 193K 0.7216 10.1K com-LiveJournal 2629.9 0.0299 51.656 10.9K 9.5778 401.89 497.89 0.0104 18.559 5230.3 0.2889 139.74 com-Orkut 452.92 0.0459 19.624 3118.1 11.839 135.17 261.75 0.0479 16.197 228.83 0.0599 14.496 com-Youtube 1422.2 0.1416 17.219 3838.9 3.4522 51.118 143.79 0.0045 2.2564 2515.4 0.6241 31.101 Brain Human25890-session1 27.703 0.0222 4.1822 472.32 16.412 52.714 65.972 0.0509 7.8146 92.649 0.2272 15.977 Networks Human25890-session2 78.483 0.0471 14.289 1326.6 16.151 112.92 83.707 0.0162 6.709 183.06 0.1701 26.302 Human25864-session2 83.489 0.0495 18.215 1433.3 17.298 143.91 106.20 0.0156 9.8828 212.96 0.1605 33.272 Human25913-session2 99.615 0.0292 15.796 1614.4 18.899 171.16 223.39 0.0219 15.122 440.58 0.3331 59.629 Human25886-session1 89.805 0.0568 20.819 1568.3 13.481 153.03 102.34 0.0154 11.296 207.52 0.1354 33.287
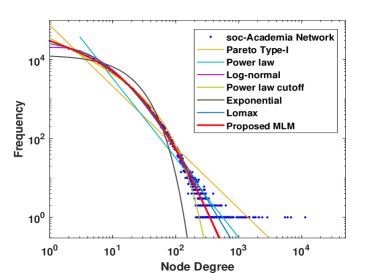
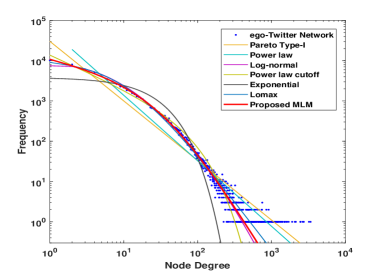
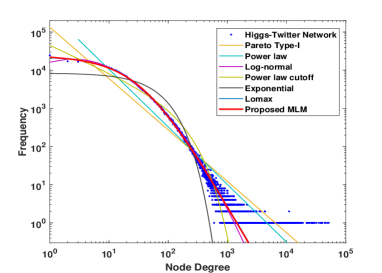
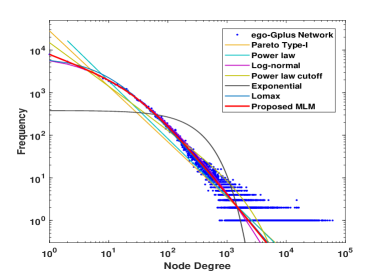
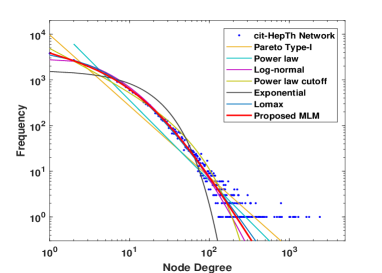
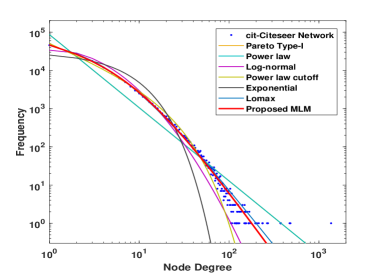
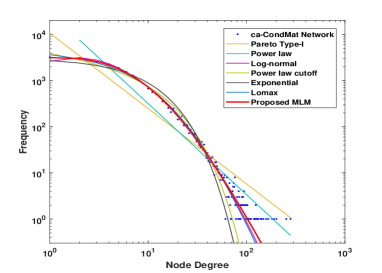
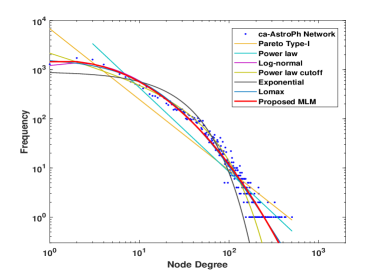
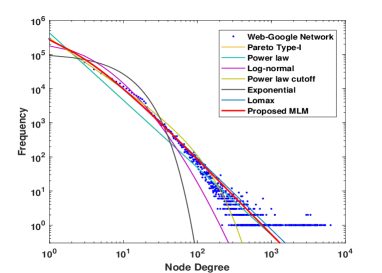
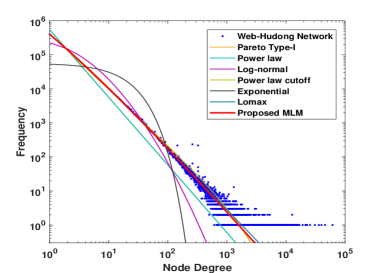
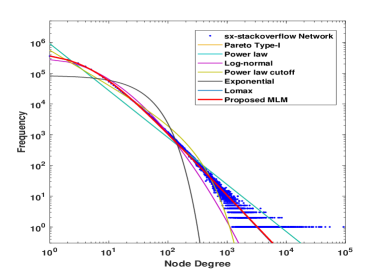
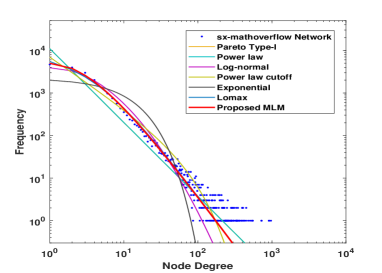
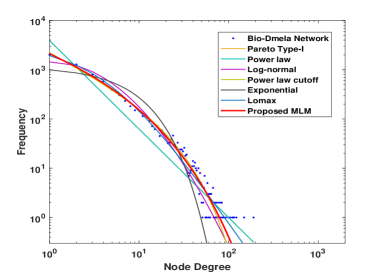
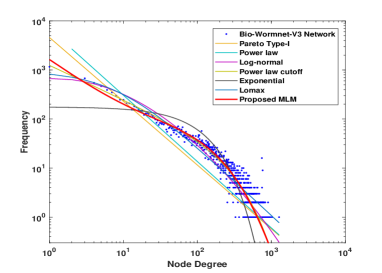
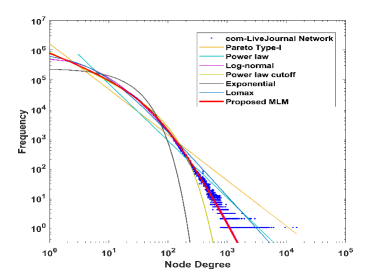
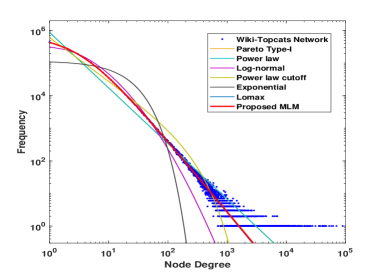
The effectiveness of the proposed MLM distribution can also be verified through the plotting of the fitted results of competitive distributions. For this purpose, the log-log plots of the of the original frequency distribution, the estimated frequency by MLM distribution and the frequency estimated by power-law, pareto, log-normal, power-law cutoff and exponential distributions are drawn for all the networks under consideration. Twenty four such examples have been provided in Figures 3-10. These are the soc-Academia network, ego-Twitter network, Higgs-Twitter network, ego-Gplus network, cit-HepTh network, cit-Citeseer network, ca-CondMat network, ca-AstroPh network, Web-Google network, web-Hudong network, sx-stackoverflow, sx-mathoverflow, Bio-Dmela network, Bio-Wormnet-V3 network, com-LiveJournal and- com-Wiki-Topcats network. Few more plotted results are also provided in the supplementary section. We have omitted the plot of the poisson distribution due to its poor performances over all the networks. It is visually clear From Figures 3-10 that the proposed MLM distribution provides better fit compared to the other competitive distributions in almost all of the networks since the proposed curve always passes through the middle of the scatter plot of the observed distribution. In a few cases the power-law cutoff and log-normal provide a better fit than the proposed distribution. It is visually clear from observing the social, biological, brain and citation networks that the entire node degree distribution can be better represented by the MLM distribution compared to other heavy tailed distributions. Thus the proposed MLM distribution, a modification of the Lomax distribution with non linear exponent in the shape parameter, can be used for effective and efficient modeling of the entire degree distribution of real-worlld networks without ignoring the lower degree nodes. The proposed MLM distribution provides more flexibility in the degree distribution modeling since the non-negative shape parameter are assumed to be expressed as a nonlinear function of the data. Empirical results also suggests the effectiveness of the proposed MLM distribution compared to others as depicted through Tables 1-3 and Figures 3-10.
6 Conclusion and Discussion
In this article, we have proposed a modified Lomax (MLM) distribution derived from a hierarchical family of Lomax distributions for flexible and efficient modeling of the entire node degree distribution of real-world complex networks. The proposed MLM distribution can be thought of as a generalization of the Lomax distribution with the nonlinear exponent in the shape parameter. We have theoretically established that the MLM distribution is heavy-tailed and right-tailed equivalent to the power-law distribution. Furthermore, we have shown a sufficient condition for the existence of the MLE for the parameters of MLM distribution using the notion of CV. The proposed MLM distribution can find MLE for the parameters at finite points when the value of CV. We also theoretically justified that the MLM distribution is a function with regularly varying tails which belongs to the Maximum domain of attraction of the Frechet distribution. We have further studied the asymptotic behaviors of the MLM distribution in this context.
The proposed MLM distribution captures the heavy-tailed and nonlinear behavior of the entire degree distributions of real-world networks in the original and the log-log scale more adroitly. It also enables us to accurately characterize the degree distribution pattern which may have a significant impact on analyzing real-world networks in terms of their social or biological aspects, as the case may be. We have applied the proposed MLM distribution in modeling the entire degree distribution over 50 different real-world empirical data sets taken from diverse fields. Empirical results suggest that as compared to the power-law distribution or any other well-known distribution, our proposed MLM distribution produces a lower fitting error in terms of three statistical tests, viz. RMSE, KL-divergence, and MAE. We also demonstrated the statistical significance of the estimated MLM distribution with the help of the bootstrap Chi-square value. This generalization of the Lomax distribution by adding an additional parameter in the base model results in flexible modeling to the entire degree distribution of a real-world network compared to other heavy-tailed distributions unlike power-law. The proposed fit distribution sometimes helps us in better characterization of the evolution process of large scale real-world networks instead of explicitly performing the empirical study at each time step. Thus, by simulating the parameters of a proposed fit MLM distribution, one can easily capture the spatial structure and dynamical pattern of a real-world network as the network evolves over time. The dynamic pattern analysis of such structural properties in real-world networks is one of the future scopes of research.
Acknowledgement
The authors gratefully acknowledge the financial assistance received from Indian Statistical Institute (I. S. I.) and Visvesvaraya PhD Scheme awarded by the Government of India.
References
- [1] R. Albert, A.-L. Barabási, Statistical mechanics of complex networks, Reviews of modern physics 74 (1) (2002) 47.
- [2] R. Albert, H. Jeong, A.-L. Barabási, Error and attack tolerance of complex networks, nature 406 (6794) (2000) 378–382.
- [3] M. E. Newman, The structure of scientific collaboration networks, Proceedings of the national academy of sciences 98 (2) (2001) 404–409.
- [4] M. E. Newman, The structure and function of complex networks, SIAM review 45 (2) (2003) 167–256.
- [5] A. Chacoma, G. Mato, M. N. Kuperman, Dynamical and topological aspects of consensus formation in complex networks, Physica A: Statistical Mechanics and its Applications 495 (2018) 152–161.
- [6] F. D. Zarandi, M. K. Rafsanjani, Community detection in complex networks using structural similarity, Physica A: Statistical Mechanics and its Applications 503 (2018) 882–891.
- [7] Y. Cui, X. Wang, J. Eustace, Detecting community structure via the maximal sub-graphs and belonging degrees in complex networks, Physica A: Statistical Mechanics and its Applications 416 (2014) 198–207.
- [8] T. Nie, Z. Guo, K. Zhao, Z.-M. Lu, The dynamic correlation between degree and betweenness of complex network under attack, Physica A: Statistical Mechanics and Its Applications 457 (2016) 129–137.
- [9] H. Shakibian, N. M. Charkari, Statistical similarity measures for link prediction in heterogeneous complex networks, Physica A: Statistical Mechanics and its Applications 501 (2018) 248–263.
- [10] L. Muchnik, S. Pei, L. C. Parra, S. D. Reis, J. S. Andrade Jr, S. Havlin, H. A. Makse, Origins of power-law degree distribution in the heterogeneity of human activity in social networks, Scientific reports 3 (1) (2013) 1–8.
- [11] A.-L. Barabási, R. Albert, Emergence of scaling in random networks, science 286 (5439) (1999) 509–512.
- [12] R. Albert, H. Jeong, A.-L. Barabási, Diameter of the world-wide web, nature 401 (6749) (1999) 130–131.
- [13] A. Clauset, C. R. Shalizi, M. E. Newman, Power-law distributions in empirical data, SIAM review 51 (4) (2009) 661–703.
- [14] A.-L. Barabasi, The origin of bursts and heavy tails in human dynamics, Nature 435 (7039) (2005) 207–211.
- [15] F. Liljeros, C. R. Edling, L. A. N. Amaral, H. E. Stanley, Y. Åberg, The web of human sexual contacts, Nature 411 (6840) (2001) 907–908.
- [16] J. H. Jones, M. S. Handcock, Sexual contacts and epidemic thresholds, Nature 423 (6940) (2003) 605–606.
- [17] M. E. Newman, Power laws, pareto distributions and zipf’s law, Contemporary physics 46 (5) (2005) 323–351.
- [18] M. Seshadri, S. Machiraju, A. Sridharan, J. Bolot, C. Faloutsos, J. Leskove, Mobile call graphs: beyond power-law and lognormal distributions, in: Proceedings of the 14th ACM SIGKDD international conference on Knowledge discovery and data mining, 2008, pp. 596–604.
- [19] A. D. Broido, A. Clauset, Scale-free networks are rare, Nature communications 10 (1) (2019) 1–10.
- [20] P. Holme, Rare and everywhere: Perspectives on scale-free networks, Nature communications 10 (1) (2019) 1–3.
- [21] I. Voitalov, P. van der Hoorn, R. van der Hofstad, D. Krioukov, Scale-free networks well done, Physical Review Research 1 (3) (2019) 033034.
- [22] M. P. Stumpf, M. A. Porter, Critical truths about power laws, Science 335 (6069) (2012) 665–666.
- [23] A. Sala, H. Zheng, B. Y. Zhao, S. Gaito, G. P. Rossi, Brief announcement: revisiting the power-law degree distribution for social graph analysis, in: Proceedings of the 29th ACM SIGACT-SIGOPS symposium on Principles of distributed computing, 2010, pp. 400–401.
- [24] S. Chattopadhyay, A. K. Das, K. Ghosh, Finding patterns in the degree distribution of real-world complex networks: Going beyond power law, Pattern Analysis and Applications (2019) 1–20.
- [25] S. Chattopadhyay, C. Murthy, S. K. Pal, Fitting truncated geometric distributions in large scale real world networks, Theoretical Computer Science 551 (2014) 22–38.
- [26] K. Lomax, Business failures: Another example of the analysis of failure data, Journal of the American Statistical Association 49 (268) (1954) 847–852.
- [27] M. Ahsanullah, Record values of the lomax distribution, Statistica Neerlandica 45 (1) (1991) 21–29.
- [28] A. S. Hassan, S. M. Assar, A. Shelbaia, Optimum step-stress accelerated life test plan for lomax distribution with an adaptive type-ii progressive hybrid censoring, Journal of Advances in Mathematics and Computer Science (2016) 1–19.
- [29] A. Childs, N. Balakrishnan, M. Moshref, Order statistics from non-identical right-truncated lomax random variables with applications, Statistical Papers 42 (2) (2001) 187–206.
- [30] S. Al-Awadhi, M. Ghitany, Statistical properties of poisson-lomax distribution and its application to repeated accidents data, Journal of Applied Statistical Science 10 (4) (2001) 365–372.
- [31] N. Balakrishnan, M. Ahsanullah, Relations for single and product moments of record values from lomax distribution, Sankhyā: The Indian Journal of Statistics, Series B (1994) 140–146.
- [32] K. Jayakumar, B. Krishnan, G. Hamedani, On a new generalization of pareto distribution and its applications, Communications in Statistics-Simulation and Computation 49 (5) (2020) 1264–1284.
- [33] A. B. Atkinson, A. J. Harrison, Distribution of personal wealth in Britain, Cambridge Univ Pr, 1978.
- [34] M. C. Bryson, Heavy-tailed distributions: properties and tests, Technometrics 16 (1) (1974) 61–68.
- [35] M. Chahkandi, M. Ganjali, On some lifetime distributions with decreasing failure rate, Computational Statistics & Data Analysis 53 (12) (2009) 4433–4440.
- [36] A. S. Hassan, A. S. Al-Ghamdi, Optimum step stress accelerated life testing for lomax distribution, Journal of Applied Sciences Research 5 (12) (2009) 2153–2164.
- [37] B. C. Arnold, Pareto distributions, Chapman and Hall/CRC, 2015.
- [38] I. B. Abdul-Moniem, Recurrence relations for moments of lower generalized order statistics from exponentiated lomax distribution and its characterization, Journal of Mathematical and Computational Science 2 (4) (2012) 999–1011.
- [39] M. Rajab, M. Aleem, T. Nawaz, M. Daniyal, On five parameter beta lomax distribution, Journal of Statistics 20 (1).
- [40] A. El-Bassiouny, N. Abdo, H. Shahen, Exponential lomax distribution, International Journal of Computer Applications 121 (13).
- [41] G. M. Cordeiro, E. M. Ortega, B. V. Popović, The gamma-lomax distribution, Journal of Statistical computation and Simulation 85 (2) (2015) 305–319.
- [42] M. Tahir, M. A. Hussain, G. M. Cordeiro, G. Hamedani, M. Mansoor, M. Zubair, The gumbel-lomax distribution: properties and applications, Journal of Statistical Theory and Applications 15 (1) (2016) 61–79.
- [43] D. E. Giles, H. Feng, R. T. Godwin, On the bias of the maximum likelihood estimator for the two-parameter lomax distribution, Communications in Statistics-Theory and Methods 42 (11) (2013) 1934–1950.
- [44] P. Embrechts, C. Klüppelberg, T. Mikosch, Modelling extremal events: for insurance and finance, Vol. 33, Springer Science & Business Media, 2013.
- [45] S. Foss, D. Korshunov, S. Zachary, et al., An introduction to heavy-tailed and subexponential distributions, Vol. 6, Springer, 2011.
- [46] C. Klüppelberg, Subexponential distributions and integrated tails, Journal of Applied Probability 25 (1) (1988) 132–141.
- [47] J. Leskovec, A. Krevl, SNAP Datasets: Stanford large network dataset collection, http://snap.stanford.edu/data (Jun. 2014).
- [48] R. Rossi, N. Ahmed, The network data repository with interactive graph analytics and visualization, in: Twenty-Ninth AAAI Conference on Artificial Intelligence, 2015.