Computational screening of magnetocaloric alloys
Abstract
An exciting development over the past few decades has been the use of high-throughput computational screening as a means of identifying promising candidate materials for a variety of structural or functional properties. Experimentally, it is often found that the highest-performing materials contain substantial atomic site disorder. These are frequently overlooked in high-throughput computational searches however, due to difficulties in dealing with materials that do not possess simple, well-defined crystallographic unit cells. Here we demonstrate that the screening of magnetocaloric materials with the help of the density functional theory-based magnetic deformation proxy can be extended to systems with atomic site disorder. This is accomplished by thermodynamic averaging of the magnetic deformation for ordered supercells across a solid solution. We show that the highly nonmonotonic magnetocaloric properties of the disordered solid solutions Mn(Co1-xFex)Ge and (Mn1-xNix)CoGe are successfully captured using this method.
I Introduction
Recent advances in computing and automated materials science frameworks Curtarolo et al. (2012); Jain et al. (2013); Saal et al. (2013); Hautier et al. (2011a); Hill et al. (2016); de Pablo et al. (2019) have enabled high-throughput in silico screening of crystalline solids aimed at identifying candidate materials for a variety of applications including structural materials Johannesson et al. (2002); Bligaard et al. (2003); Kirklin et al. (2016), battery electrodes Kirklin et al. (2013); Hautier et al. (2011a), thermoelectrics Yan et al. (2015), photovoltaics Yu and Zunger (2012); Fabini et al. (2019), and magnetocalorics Bocarsly et al. (2017), among many others. In these projects, automated density functional theory (DFT) calculations are performed on a large number of candidate structures and compositions that have either been pulled from the literature or generated using a set of rules. Properties of interest are predicted from the results of these first principles calculations, often making use of a proxy: a simple quantifiable parameter that serves as an indicator of the more complex physical phenomenon Brgoch et al. (2013); Rondinelli et al. (2015); Bocarsly et al. (2017). While this strategy has met with success and has expanded the breadth of materials systems under consideration for various applications, a major limitation is that these efforts have generally been limited to evaluating compounds with simple unit cells, and without atomic site disorder (alloying). Consequently, alloyed and solid-solution materials are excluded from these searches, despite experiments suggesting that the highest-performing materials for a variety of applications often come from these families.
The importance of screening compositionally disordered materials is especially apparent in the field of magnetocalorics, where many of the highest-performing materials rely on substantial unit cell disorder and nonstoichiometry for their remarkable properties, including (Mn,Fe)2-δ(P,Si) Tegus et al. (2002); Brück et al. (2004); Cam Thanh et al. (2008); Grebenkemper et al. (2018), La(Fe,Si)13Hx Fujieda et al. (2002); Shen et al. (2009), Gd5(Si,Ge)4 Pecharsky and Gschneidner, Jr. (1997); Choe et al. (2000), and a variety of substituted MnCoGe-based compounds Trung et al. (2010); Zhang et al. (2015a, b); Trung et al. (2010). In these materials, application of a magnetic field causes randomly oriented spins to align, reducing the entropy of the spin system. Alternating cycles of adiabatic and isothermal magnetization and demagnetization of a magnetocaloric can be used to drive a thermodynamic cycle and build an efficient magnetic heat pump Brown (1976). Such devices promise to provide an energy-efficient and environmentally-friendly alternative to conventional vapor-compression refrigeration and air conditioning Franco et al. (2012); Takeuchi and Sandeman (2015), which typically rely on hydrofluorochlorocarbons, which are now known to be associated with high global warming potential McLinden et al. (2017). The primary metric used to quantify the performance of a magnetocaloric is the entropy change experienced by the material upon isothermal application of a magnetic field at a temperature , . This parameter reaches its peak value near a magnetic transition temperature , where the spins are most susceptible to an external field. An effective magnetocaloric should therefore show a large peak at a useful temperature range.
For the high-performing magnetocaloric materials mentioned above, magnetic moments are strongly coupled to crystal structure, causing their magnetic transitions to couple to discontinuous changes in the crystal symmetry or lattice parameters. Such systems can show greatly enhanced (giant) magnetocaloric effects Pecharsky and Gschneidner, Jr. (1997) around their first-order magnetostructural phase transitions. In fact, magnetostructural coupling can lead to an enhanced magnetocaloric effect even without this type of first-order transition present Bocarsly et al. (2019); Dung et al. (2011); Franco et al. (2017); Davarpanah et al. (2019). We previously introduced a simple DFT-based proxy for magnetostructural coupling known as the magnetic deformation Bocarsly et al. (2017) — a stand-in for magnetostructural coupling — obtained through comparing the degree of lattice deformation between magnetic and nonmagnetic DFT structural optimizations. In systems where the inclusion of magnetism in the DFT calculation causes a large change in the optimized structure, we surmise that magnetostructural coupling must be strong. In a survey of reported magnetocalorics without substantial unit cell disorder, we found that correlates well with the experimental peak for transition metal-based compounds, both for materials with known first-order magnetostructural transitions and for those with no such transitions Bocarsly et al. (2017). Consequently, can be used to computationally screen magnetic compounds to identify promising magnetocalorics.
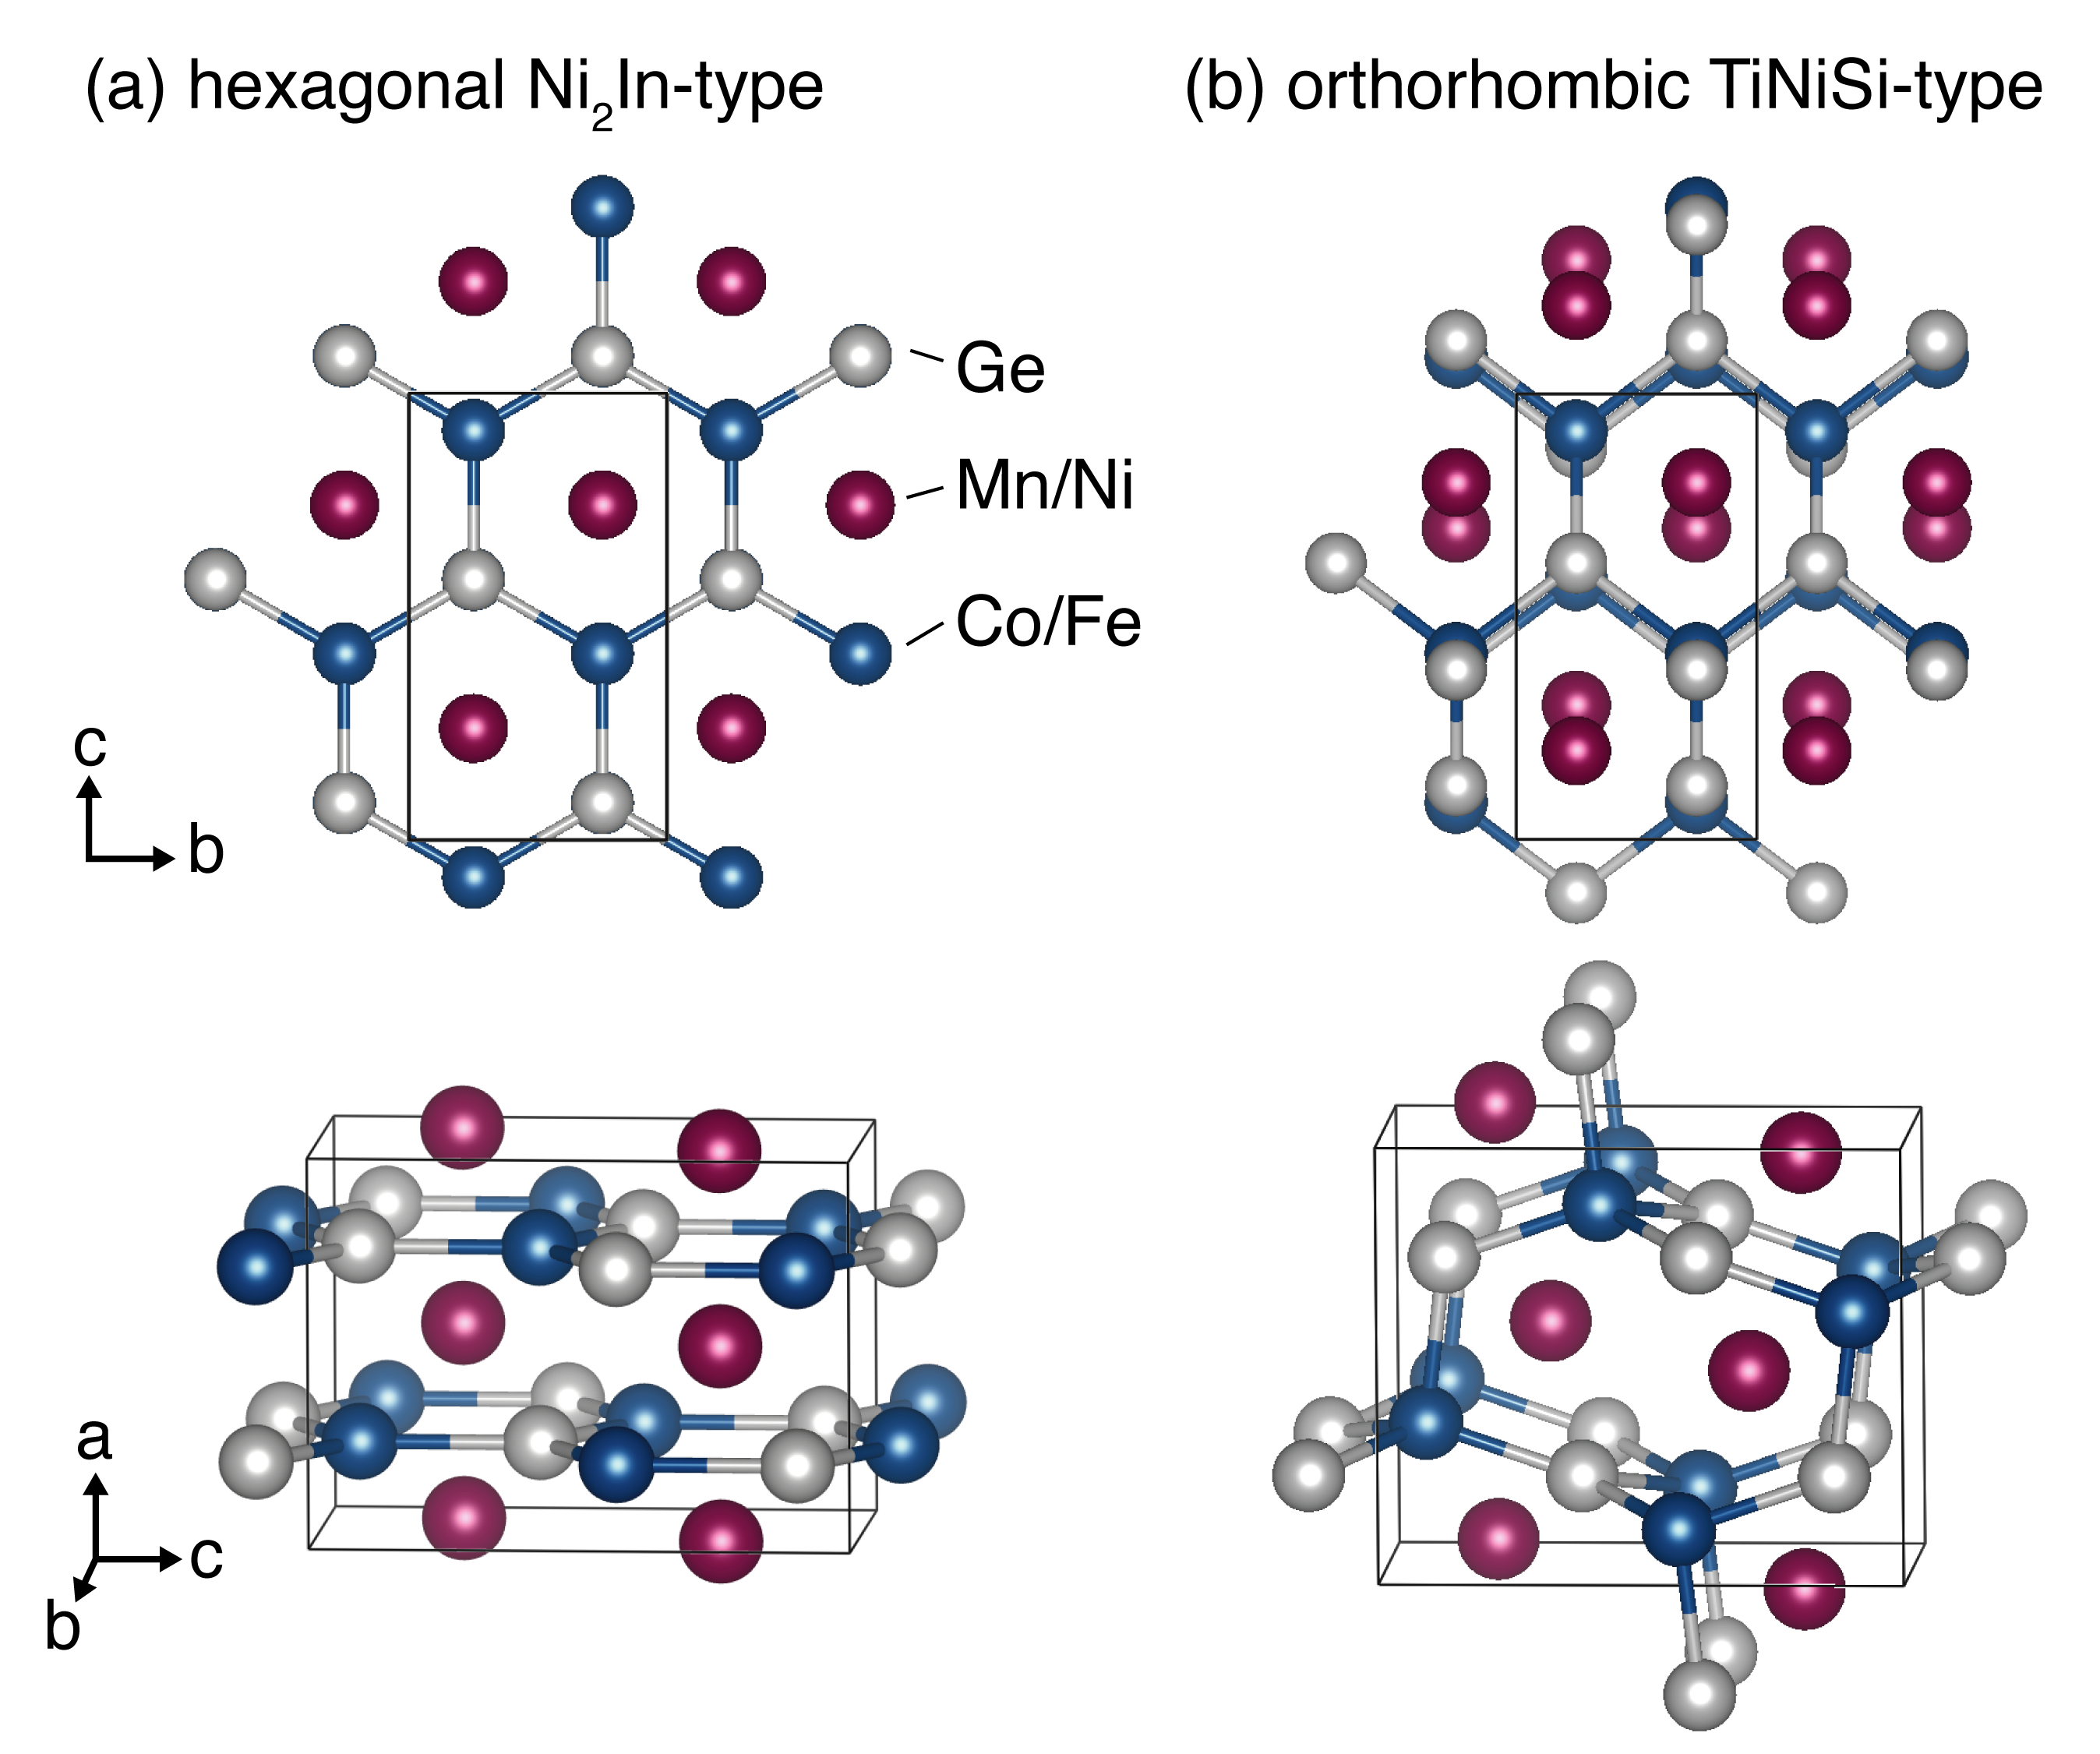
While the application of the magnetic deformation proxy was previously limited to DFT-friendly compounds with no consideration of atomic site disorder, here we introduce a method to allow for the calculation of in disordered solid solutions. In order to accomplish this, we consider the test case of MnCoGe-based alloys. MnCoGe, an orthorhombic compound with a TiNiSi-type structure, shows an intermediate peak of 6 J kg-1 K-1 for an applied field T Lin et al. (2006). This effect is in agreement with the calculated value of = 1.93% Bocarsly et al. (2017). However, it was reported in 2010 that inclusion of just two or three percent boron (e.g. MnCoGeB0.02) in the material leads to a giant magnetocaloric effect with peak of up to 47.3 J kg-1 K-1 Trung et al. (2010). This doped MnCoGe shows a coupled first-order magnetostructural transition, with a higher-symmetry hexagonal \ceNi2In paramagnetic phase [Fig. 1(a)] transforming to a magnetic phase with a mixture of TiNiSi [Fig. 1(b)] and \ceNi2In structures. The TiNiSi structure is described by a subgroup () of the spacegroup of the \ceNi2In structure (), and is formed by a displacive phase transition involving corrugation of the honeycomb Co-Ge lattice Landrum et al. (1998), as illustrated in Fig. 1. Similar effects to those of boron-doping can also be realized with a number of other atomic substitutions, with giant magnetocaloric effects seen at disordered compositions including MnCoGeC0.03 Trung et al. (2010), Mn0.9Ni0.1CoGe Zhang et al. (2015a), MnCoGe0.95Ga0.05 Zhang et al. (2015b), and Mn0.98CoGe Trung et al. (2010).
Here, we propose a method by which the magnetic deformation proxy can be used to screen compositionally disordered magnetic materials to identify promising magnetocaloric compositions. for a compositionally disordered material is calculated by taking a Boltzmann-weighted average of the individual values for enumerated ordered supercells of the disordered material. Using this technique, the qualitative magnetocaloric behavior of two solid solutions of MnCoGe are successfully reproduced: Mn(Co1-xFex)Ge Lin et al. (2006) and (Mn1-xNix)CoGe Zhang et al. (2015a). In the first system, substitution of Fe for Co has has been shown to cause a modest increase in peak at the intermediate composition = 0.2 Lin et al. (2006). In the second, substitution of Ni for Mn has been shown to lead to a much larger increase in , with a giant magnetocaloric effect observed at = 0.1 Zhang et al. (2015a). In both cases, we show that the highly nonmonotonic behavior of the solid solution is remarkably captured by the ensembled magnetic deformation calculations, with only minor deviations. We investigate the potential energy surfaces relevant to the DFT structural optimizations of individual supercell calculations for Mn(Co1-xFex)Ge and find that key cells experience double-well potentials with local minima at the hexagonal and orthorhombic structures of MnCoGe. This indicates that the ability of the structural optimization algorithm to traverse from one local minima to the other is an important consideration with regard to the results obtained from the magnetic deformation proxy calculations.
II Methods
II.1 Supercell enumeration
For the solid solution systems studied, all possible orderings of the supercells up to a specified multiple of the volume of the 12 atom MnCoGe primitive cell (, TiNiSi structure) were enumerated. For the Mn(Co1-xFex)Ge system, we chose two times the primitive cell volume, allowing for increments of 1/8 across the full composition range = 0 to = 1. For (Mn1-xNix)CoGe, supercells up to 3 times the primitive cell volume were considered from = 0 to 0.25, allowing for = 1/12 and = 1/6 compositions to be probed in addition to = 0, 1/8 and 1/4. The Clusters Approach to Statistical Mechanics (CASM) code Van der Ven et al. (2010); Thomas and Van der Ven (2013); Puchala and Van Der Ven (2013) was used to enumerate these symmetrically distinct configurations and determine the multiplicity of each configuration. These ordered supercells may vary in cell shape and are not, in general, simple 211 or 311 stackings of the primitive cell. However, all cells do start with unit cell parameters and atomic positions consistent with the MnCoGe symmetry, if the atom identity on the mixed site is ignored. Table 1 lists the compositions for which we apply this method along with the number of supercell configurations generated and the maximum supercell size for each composition.
For the Mn(Co1-xFex)Ge system, a parallel set of supercells was also enumerated with the same unit cell orderings but with the atom positions and unit cell parameters adjusted to correspond to the symmetry of the Ni2In-type hexagonal () structure. The necessary transformation is possible for every supercell of the TiNiSi structure because is a subgroup of and therefore the \ceNi2In structure type can always be expressed within a -compatible unit cell.
| MnCo1-xFexGe | Mn1-xNixCoGe | ||||
|---|---|---|---|---|---|
| count | count | ||||
| 0 | 1 | 1 | 0 | 1 | 1 |
| 0.125 | 7 | 2 | 0.0833 | 9 | 3 |
| 0.25 | 29 | 2 | 0.125 | 7 | 2 |
| 0.375 | 41 | 2 | 0.1667 | 71 | 3 |
| 0.5 | 58 | 2 | 0.25 | 184 | 3 |
| 0.625 | 41 | 2 | |||
| 0.75 | 29 | 2 | |||
| 0.875 | 7 | 2 | |||
| 1 | 1 | 1 | |||
II.2 Magnetic deformation
For each enumerated cell, the magnetic deformation was calculated following the procedure given in Ref. 14. The optimized structure for each configuration was acquired using density functional theory (DFT) with and without spin polarization. Calculations were performed using the Vienna ab initio simulation package (VASP) Kresse and Furthmüller (1996) using the generalized gradient approximation (GGA) exchange-correlation functional as parameterized by Perdew, Burke and Ernzerhof Perdew et al. (1996); Blöchl (1994). Spin-orbit coupling was not included. For each configuration, the spin-polarized relaxations were initialized with magnetic moments of 3.0 on each transition metal ion.
Meshes for DFT calculations were automatically generated with the number of -points set to 2500 divided by the number of atoms in the cell. Structural optimizations were performed using the conjugate gradient algorithm with an energy convergence criterion of 10-3 eV. The structural relaxations were run iteratively until the volume change between subsequent relaxations was less than 2%. Once this convergence parameter was met, a final electronic optimization was performed for each enumeration while keeping the structure fixed. The Python packages pymatgen and custodian Ong et al. (2013) were used to automate, monitor, and analyze the VASP calculations.
Based on the obtained optimized structures, the magnetic deformation is calculated as the degree of lattice deformation (%) Catti (1985); de la Flor et al. (2016) between the DFT optimized nonmagnetic and magnetic structures. This is obtained by finding the transformation matrix between the two relaxed structures: , where A and A are the lattice vectors of the nonmagnetic and magnetic relaxed unit cell, respectively. The Lagrangian finite strain tensor (which removes any rotational component of P) is then calculated as , and the magnetic deformation is obtained as the root-mean-squared eigenvalues of :
| (1) |
For the Mn(Co1-xFex)Ge system, in addition to the magnetic deformation calculated using only orthorhombic starting cells, a global was calculated for each cell based on the lowest energy nonmagnetic and the lowest energy magnetic structure obtained in either the run that started with the hexagonal structure or the run that started with the orthorhombic structure.
Although it is well-established that DFT often fails to localize 3 transition metal electrons enough to accurately model the moments in magnetic intermetallics, we chose not to include any Hubbard correction terms in order to keep the calculations as simple (and generalizable) as possible, and to maintain compatibility with our previous work Bocarsly et al. (2017) where it was found that performs well as a proxy for magnetocaloric effect across a diverse range of compounds without the use of . While we believe a GGA+ approach could allow for the more faithful reproduction of magnetic and structural ground states observed in experiment, this method increases computational cost and requires careful selection of terms for each individual transition metal element in the compound, making it difficult to generalize to a high-throughput search.
II.3 Modeling disorder
We consider the aggregate for a given composition labeled by to be determined by an ensemble of the ordered supercells. The aggregation may be done by a weighted average of the calculated for each ordering using the multiplicity as the weight:
| (2) |
A more complete picture, however, considers the calculated energy of each enumeration, considering that low energy states are more likely to be present in a true sample of a disordered alloy. To approximate this, we define the Boltzmann weight of a configuration with composition as
| (3) |
such that the Boltzmann-weighted average is
| (4) |
Here, is the spin-polarized energy of supercell , expressed per the maximum supercell size (i.e. in units of eV per 24 or 36 atoms). is the energy of the lowest-energy enumeration for the composition , and is the Boltzmann constant. The temperature was set to 300 K. In addition, we also tested setting the temperature to the preparation temperatures of the alloys (around 1000 K), and this did not dramatically change the presented results.
In addition to enumerating small supercells, we also tried calculations of on special quasirandom structures, a different method commonly used for DFT modeling of alloys Zunger et al. (1990); van de Walle et al. (2013). In this method, an alloy composition is modeled by a single large supercell (here, 48 atoms) with occupation of the atomic sites chosen so as to match the near-neighbor correlations of the true infinite disordered compound as well as possible. Unfortunately, this method was not as successful as the supercell enumeration method for the tasks investigated presently. For a discussion of these calculations, the reader is directed to the Supplemental Material.
II.4 Transition paths
In order to investigate the potential energy surfaces which control the DFT structural relaxations used to calculate , we performed transition path calculations on a few selected atomic supercells of Mn(Co0.75Fe0.25)Ge between their hexagonal and orthorhombic structures. Lattice parameters and atom positions of structures along the path are interpolated between the end members, which are the relaxed hexagonal () and orthorhombic () structures. The energies of structures along this path were calculated without structural relaxation.
III Results and Discussions

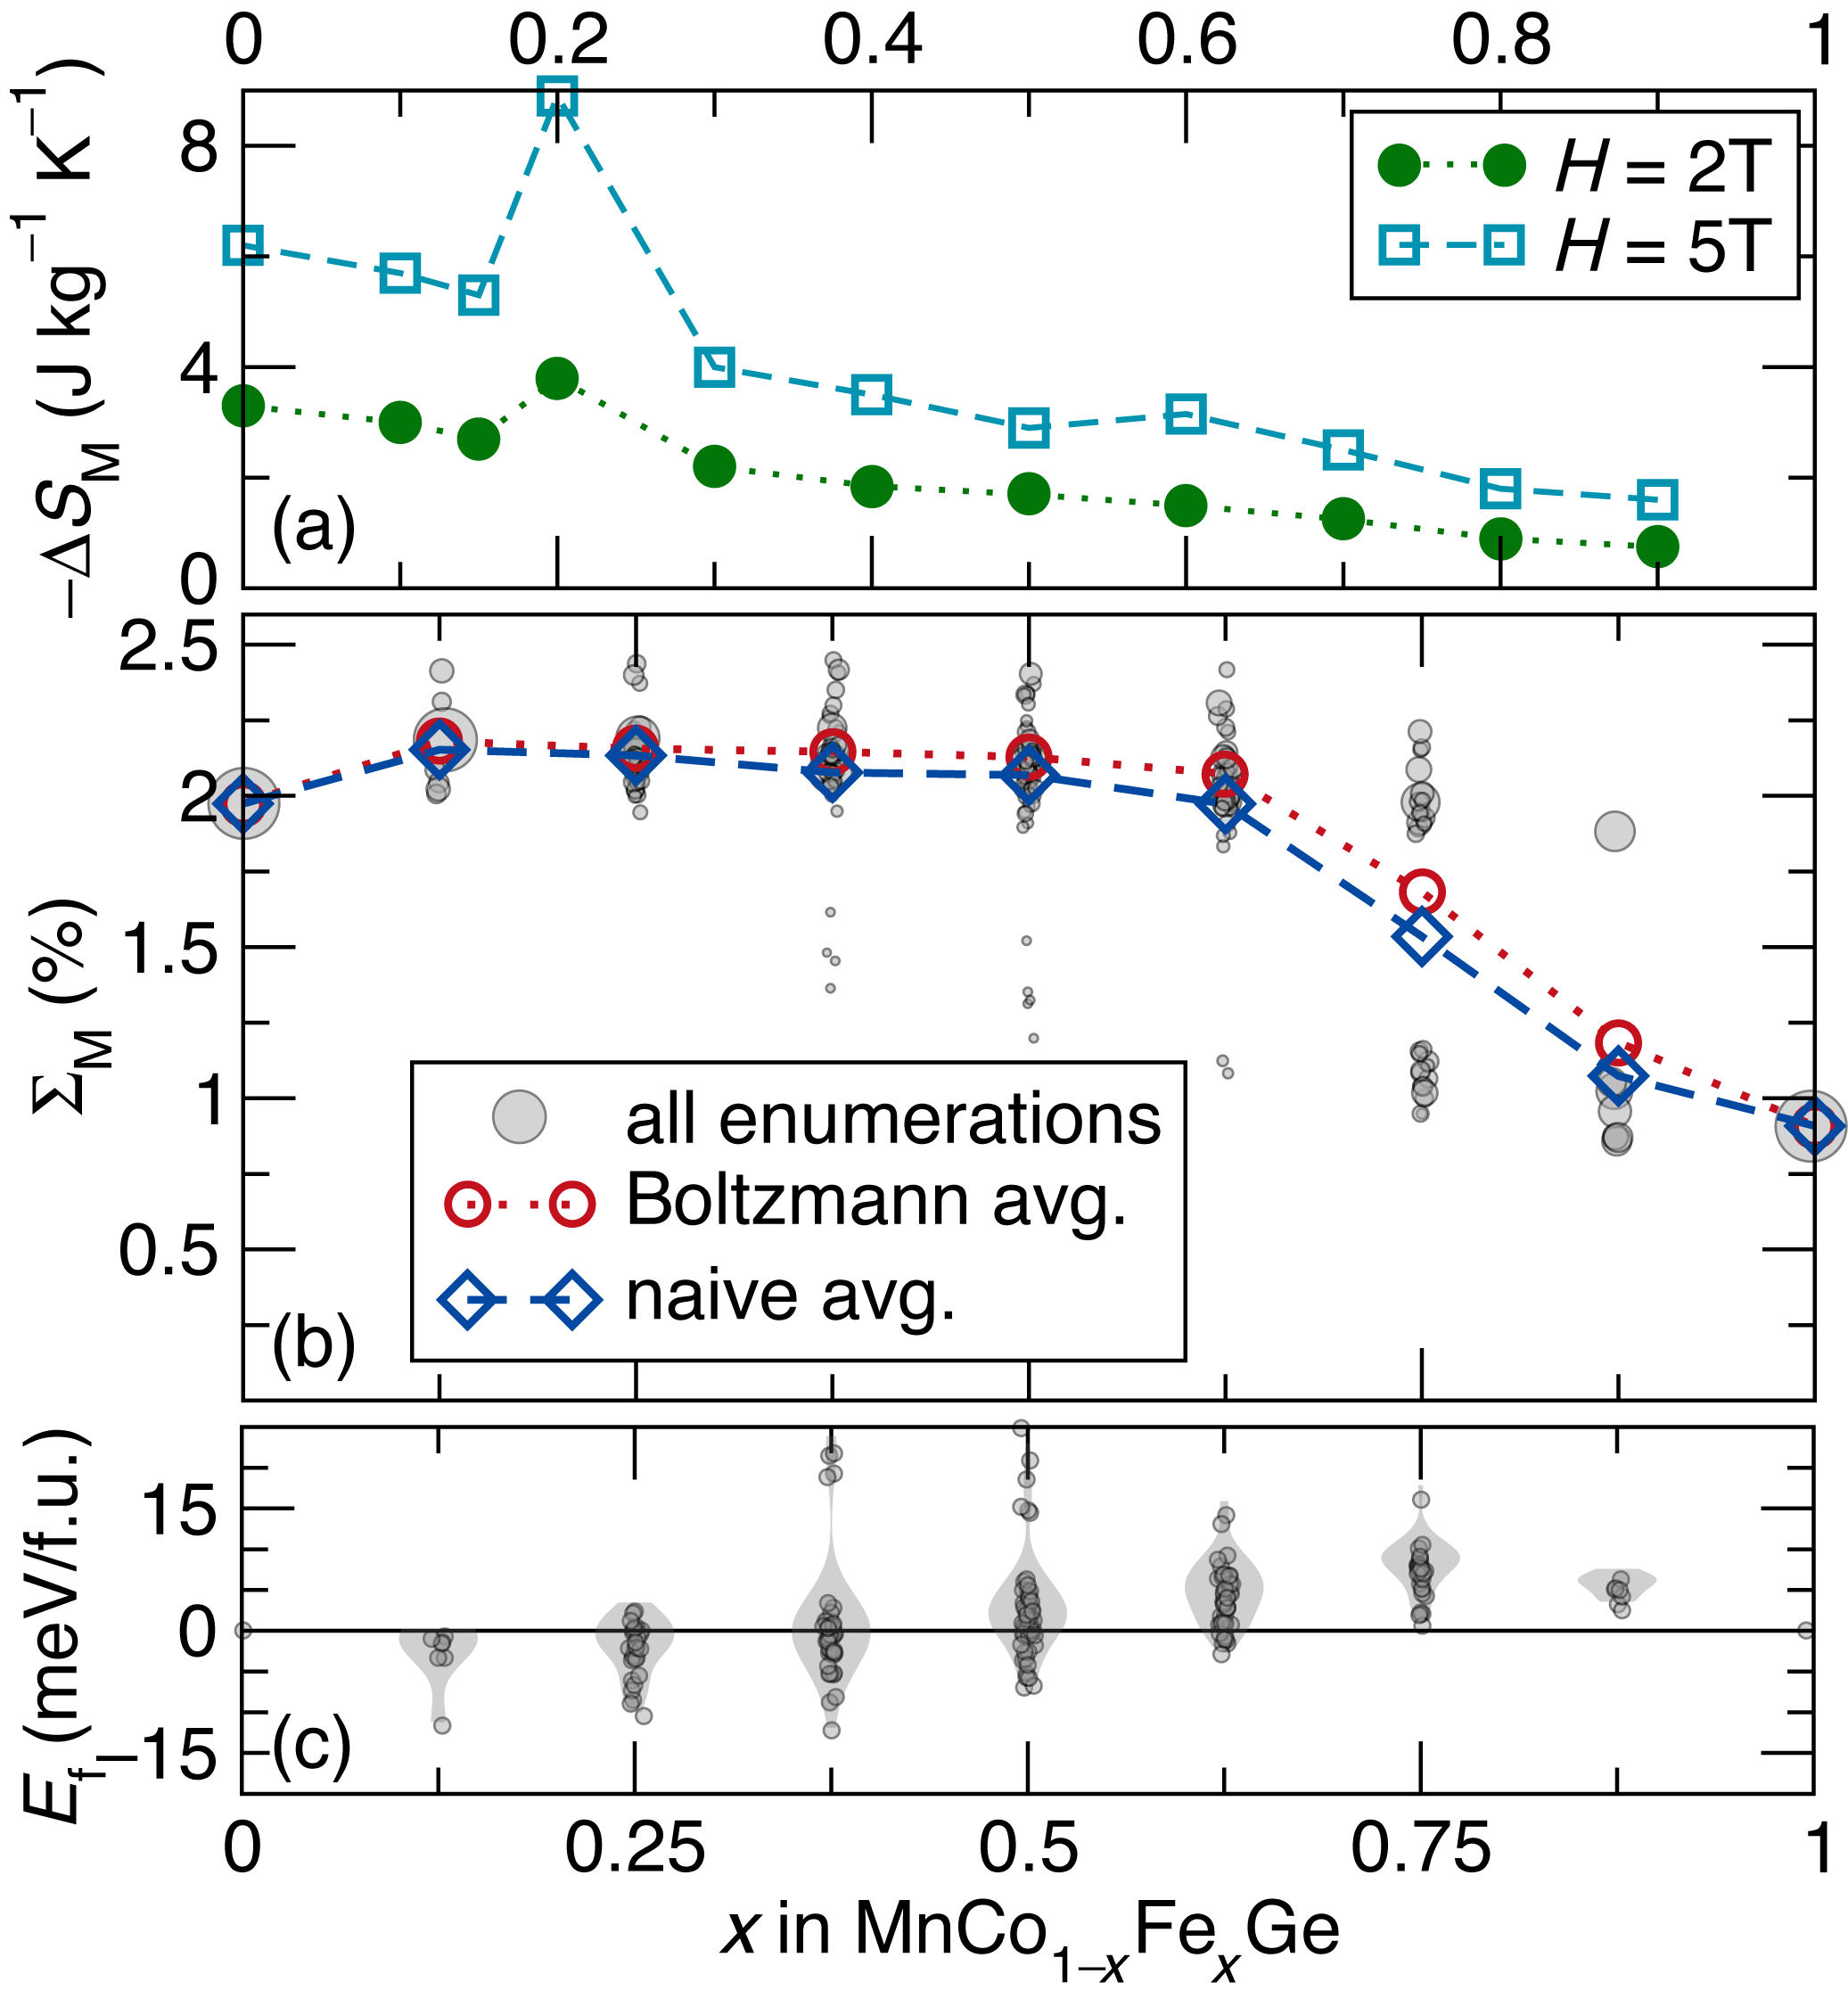
Experimental peak values and computed data for the Mn(Co1-xFex)Ge system are shown in Fig. 2. MnCoGe and MnFeGe are both ferromagnets, and the full solid solution between them can be prepared experimentally Lin et al. (2006). This solid solution features a transition from the orthorhombic structure of MnCoGe at 0.2 to the hexagonal structure of MnFeGe at 0.2 Lin et al. (2006). Across this series, peak decreases as increases, except for at the phase boundary ( = 0.2), where a peak in reaching 9 J kg-1K-1 for an applied field of 5 T is observed. Figure 2(c) shows the energies of the individually enumerated supercells relative to the energies of the corresponding mixture of MnCoGe and MnFeGe. Many orderings across the full compositional range show negative formation energies, consistent with the experimental observation that the solid solution forms and does not phase segregate. As seen in Fig. 2(b), the calculated values for individual ordered cells span a range of values, from about 0.75% to 2.25%. The simple average of these values somewhat follows the experimental trend of a general decrease in with increasing interrupted by a peak near the middle of the compositional range. However, the position and magnitude of the peak in are far off from the experimental results, and therefore the correspondence between computation and experiment is poor. On the other hand, the Boltzmann-weighted average gives an excellent qualitative match, with a maximum at = 0.25, the closest computed composition to the peak in the experimental data ( = 0.2). The peak in is broader than that seen in the data; however, the qualitative match is remarkable given the simplicity of the computational model and the many variables involved in the experimental preparation and measurement of a magnetocaloric material.
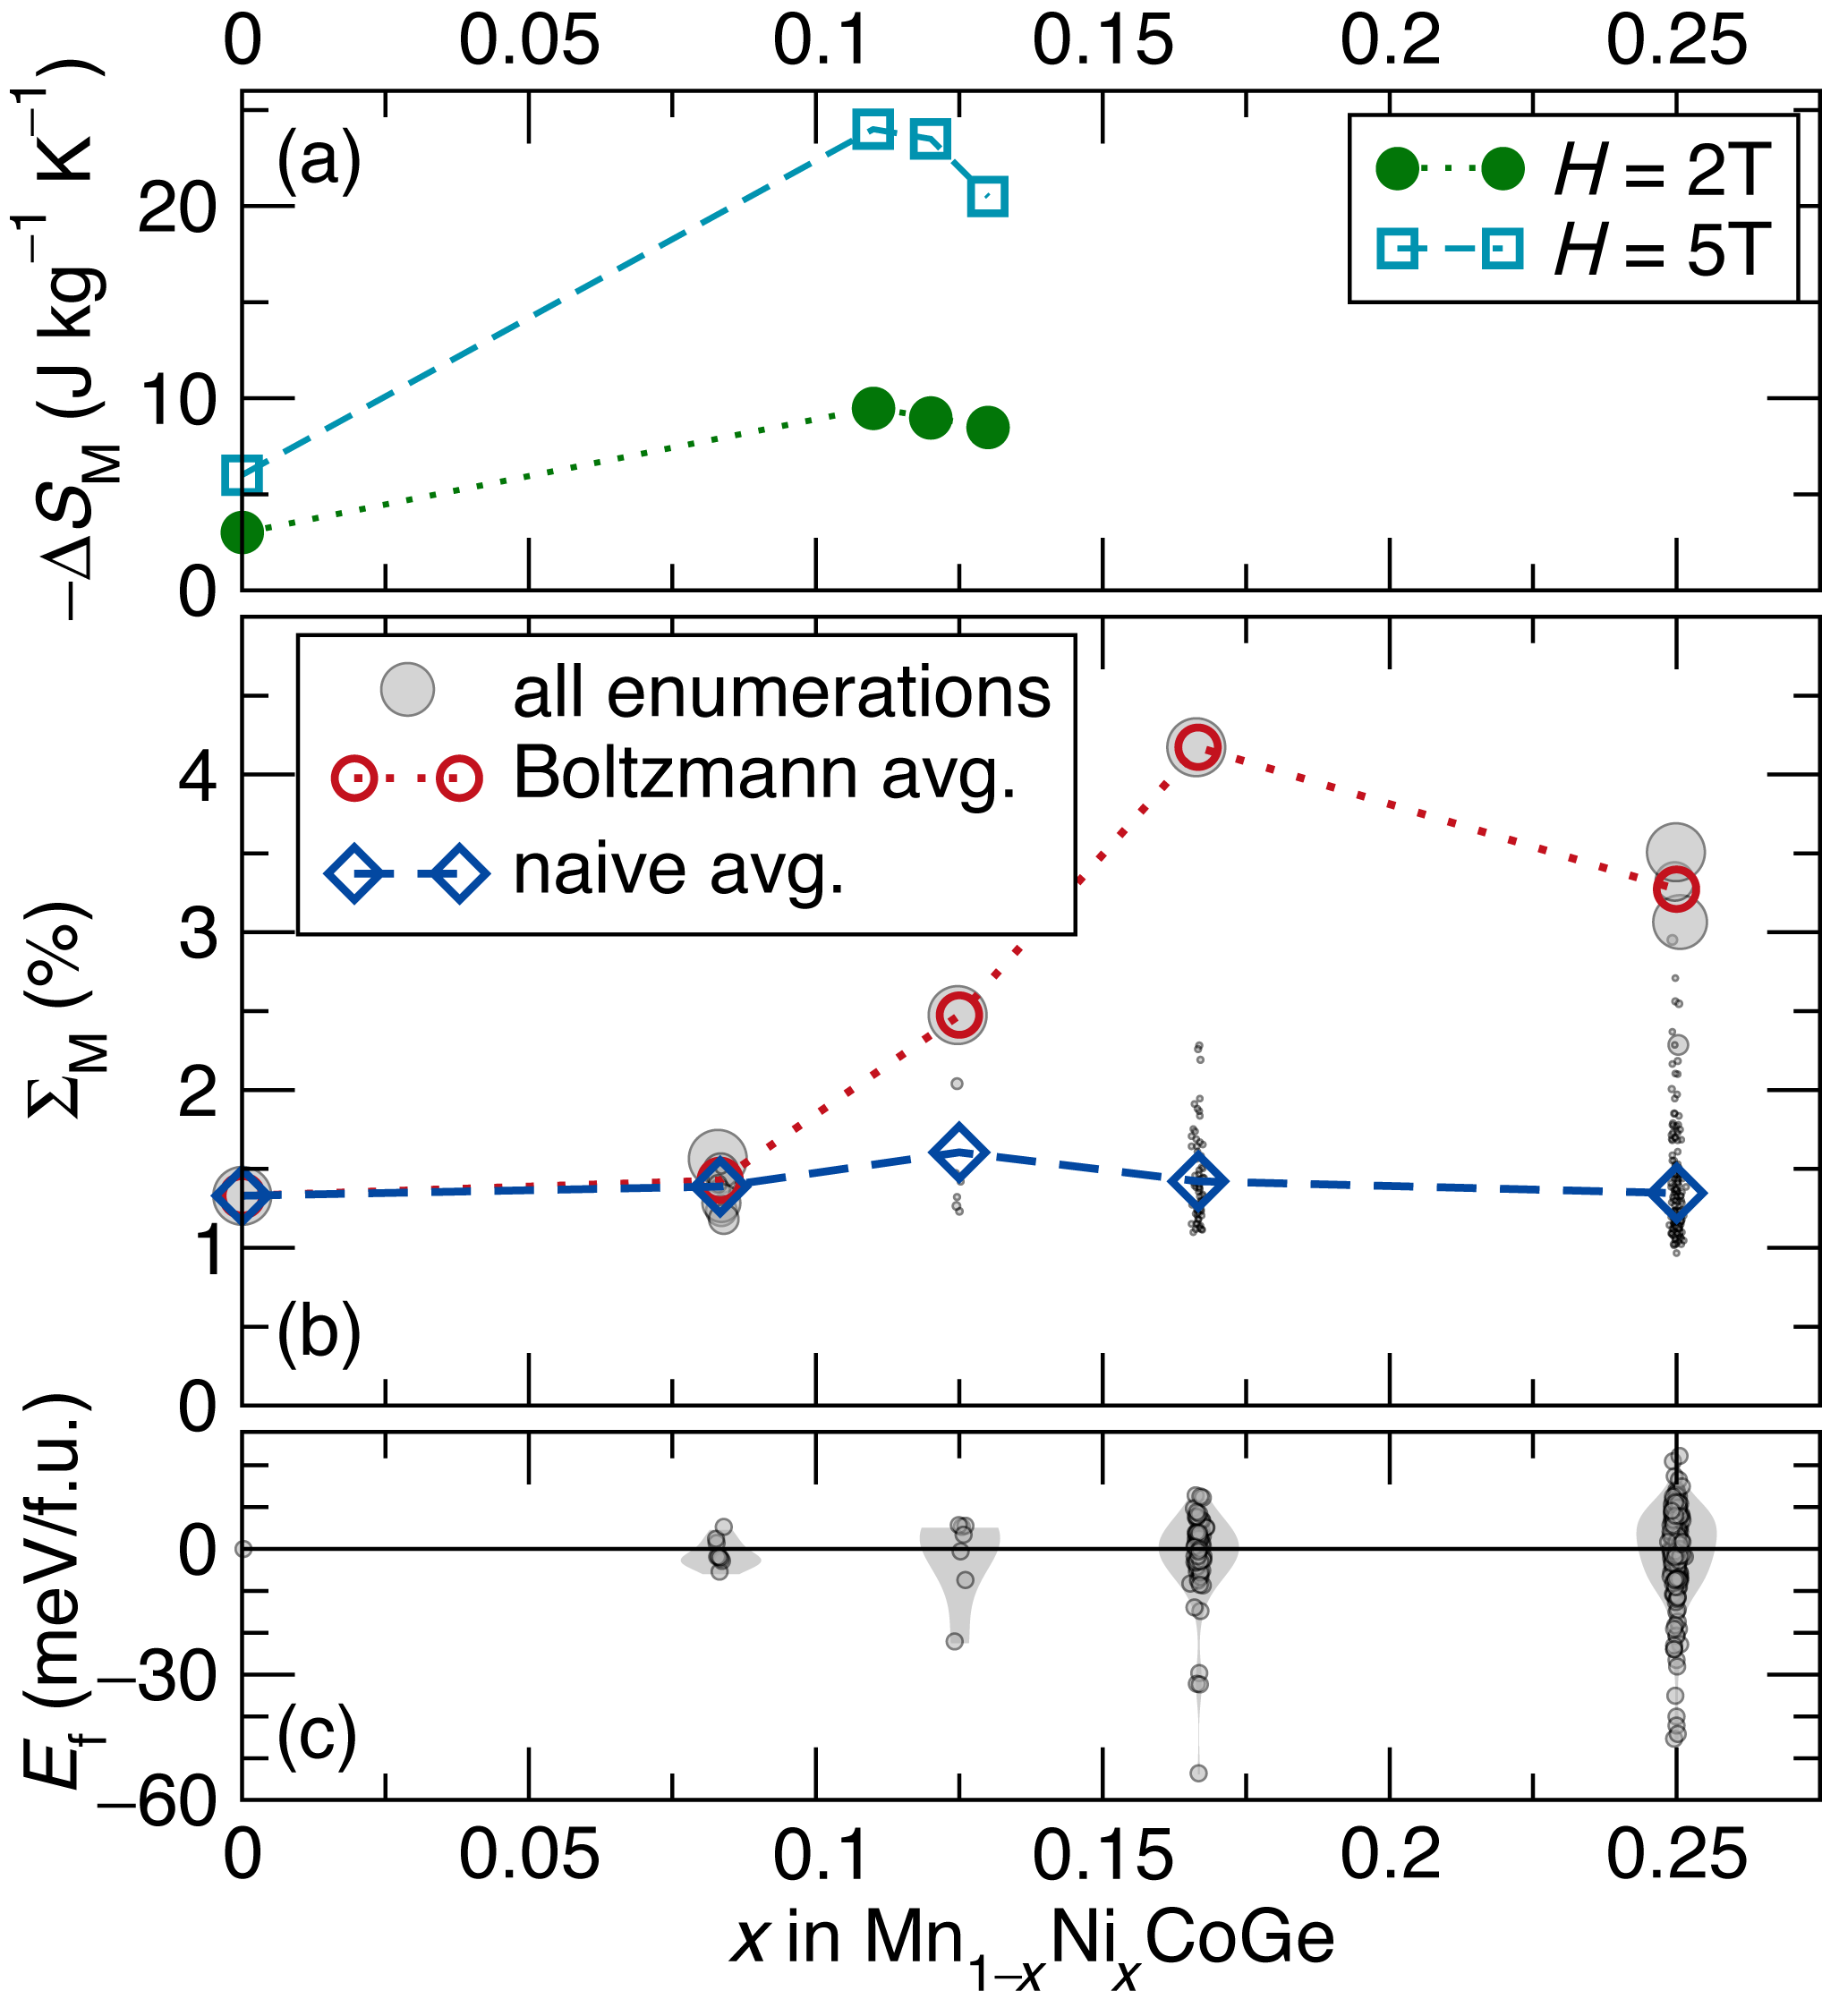
Figure 3 shows the same analysis for a different solid solution of MnCoGe, the (Mn1-xNix)CoGe system. In this case, introduction of a small amount of Ni ( 11%) has been found to result in a giant magnetocaloric effect with peak reaching 24 J kg-1K-1 for an applied field of 5 T Zhang et al. (2015a). As in the Mn(Co1-xFex)Ge system, this is due to the coincidence of magnetic and structural transitions, i.e. due to a first-order magnetostructural transition, observed for samples with between 0.08 and 0.12 (for 0.08 and slightly greater than 0.12, the structural and magnetic transitions occur at different temperatures). As alloying across the whole composition space 0 1 has not yet been reported, in order to set a reasonable limit to the computational cost, was calculated only for 0.25 for this system (Fig. 3). For this compositional range, the calculations presented here reproduce the experimental reports with a similar level of success as the study of the Mn(Co1-xFex)Ge system discussed above. While the maximum is slightly misaligned from the experimental largest ( vs. , respectively), the qualitative shape and the magnitude of the curve matches nicely to the experiment.
A direct comparison of the two systems under study reveals that the maximum is 2.1 times larger in the (Mn1-xNix)CoGe system than in the Mn(Co1-xFex)Ge system. Similarly, the ratio of the maximum Boltzmann averaged values is 2.7. Even without experimental references, a computational screen comparing these two systems would correctly conclude that (Mn1-xNix)CoGe is a more promising candidate system of experimental study. Furthermore, such a conclusion would be reached even if we had only considered supercells of up to size (24 atoms) for both systems. While the peak in at (1/6) in (Mn1-xNix)CoGe would not have been captured, the at is still large enough relative to any values in the Mn(Co1-xFex)Ge system to suggest that Ni is a more interesting dopant. A comparison of and values for the two systems on the same scale may be found in Supplemental Material Fig. S3.
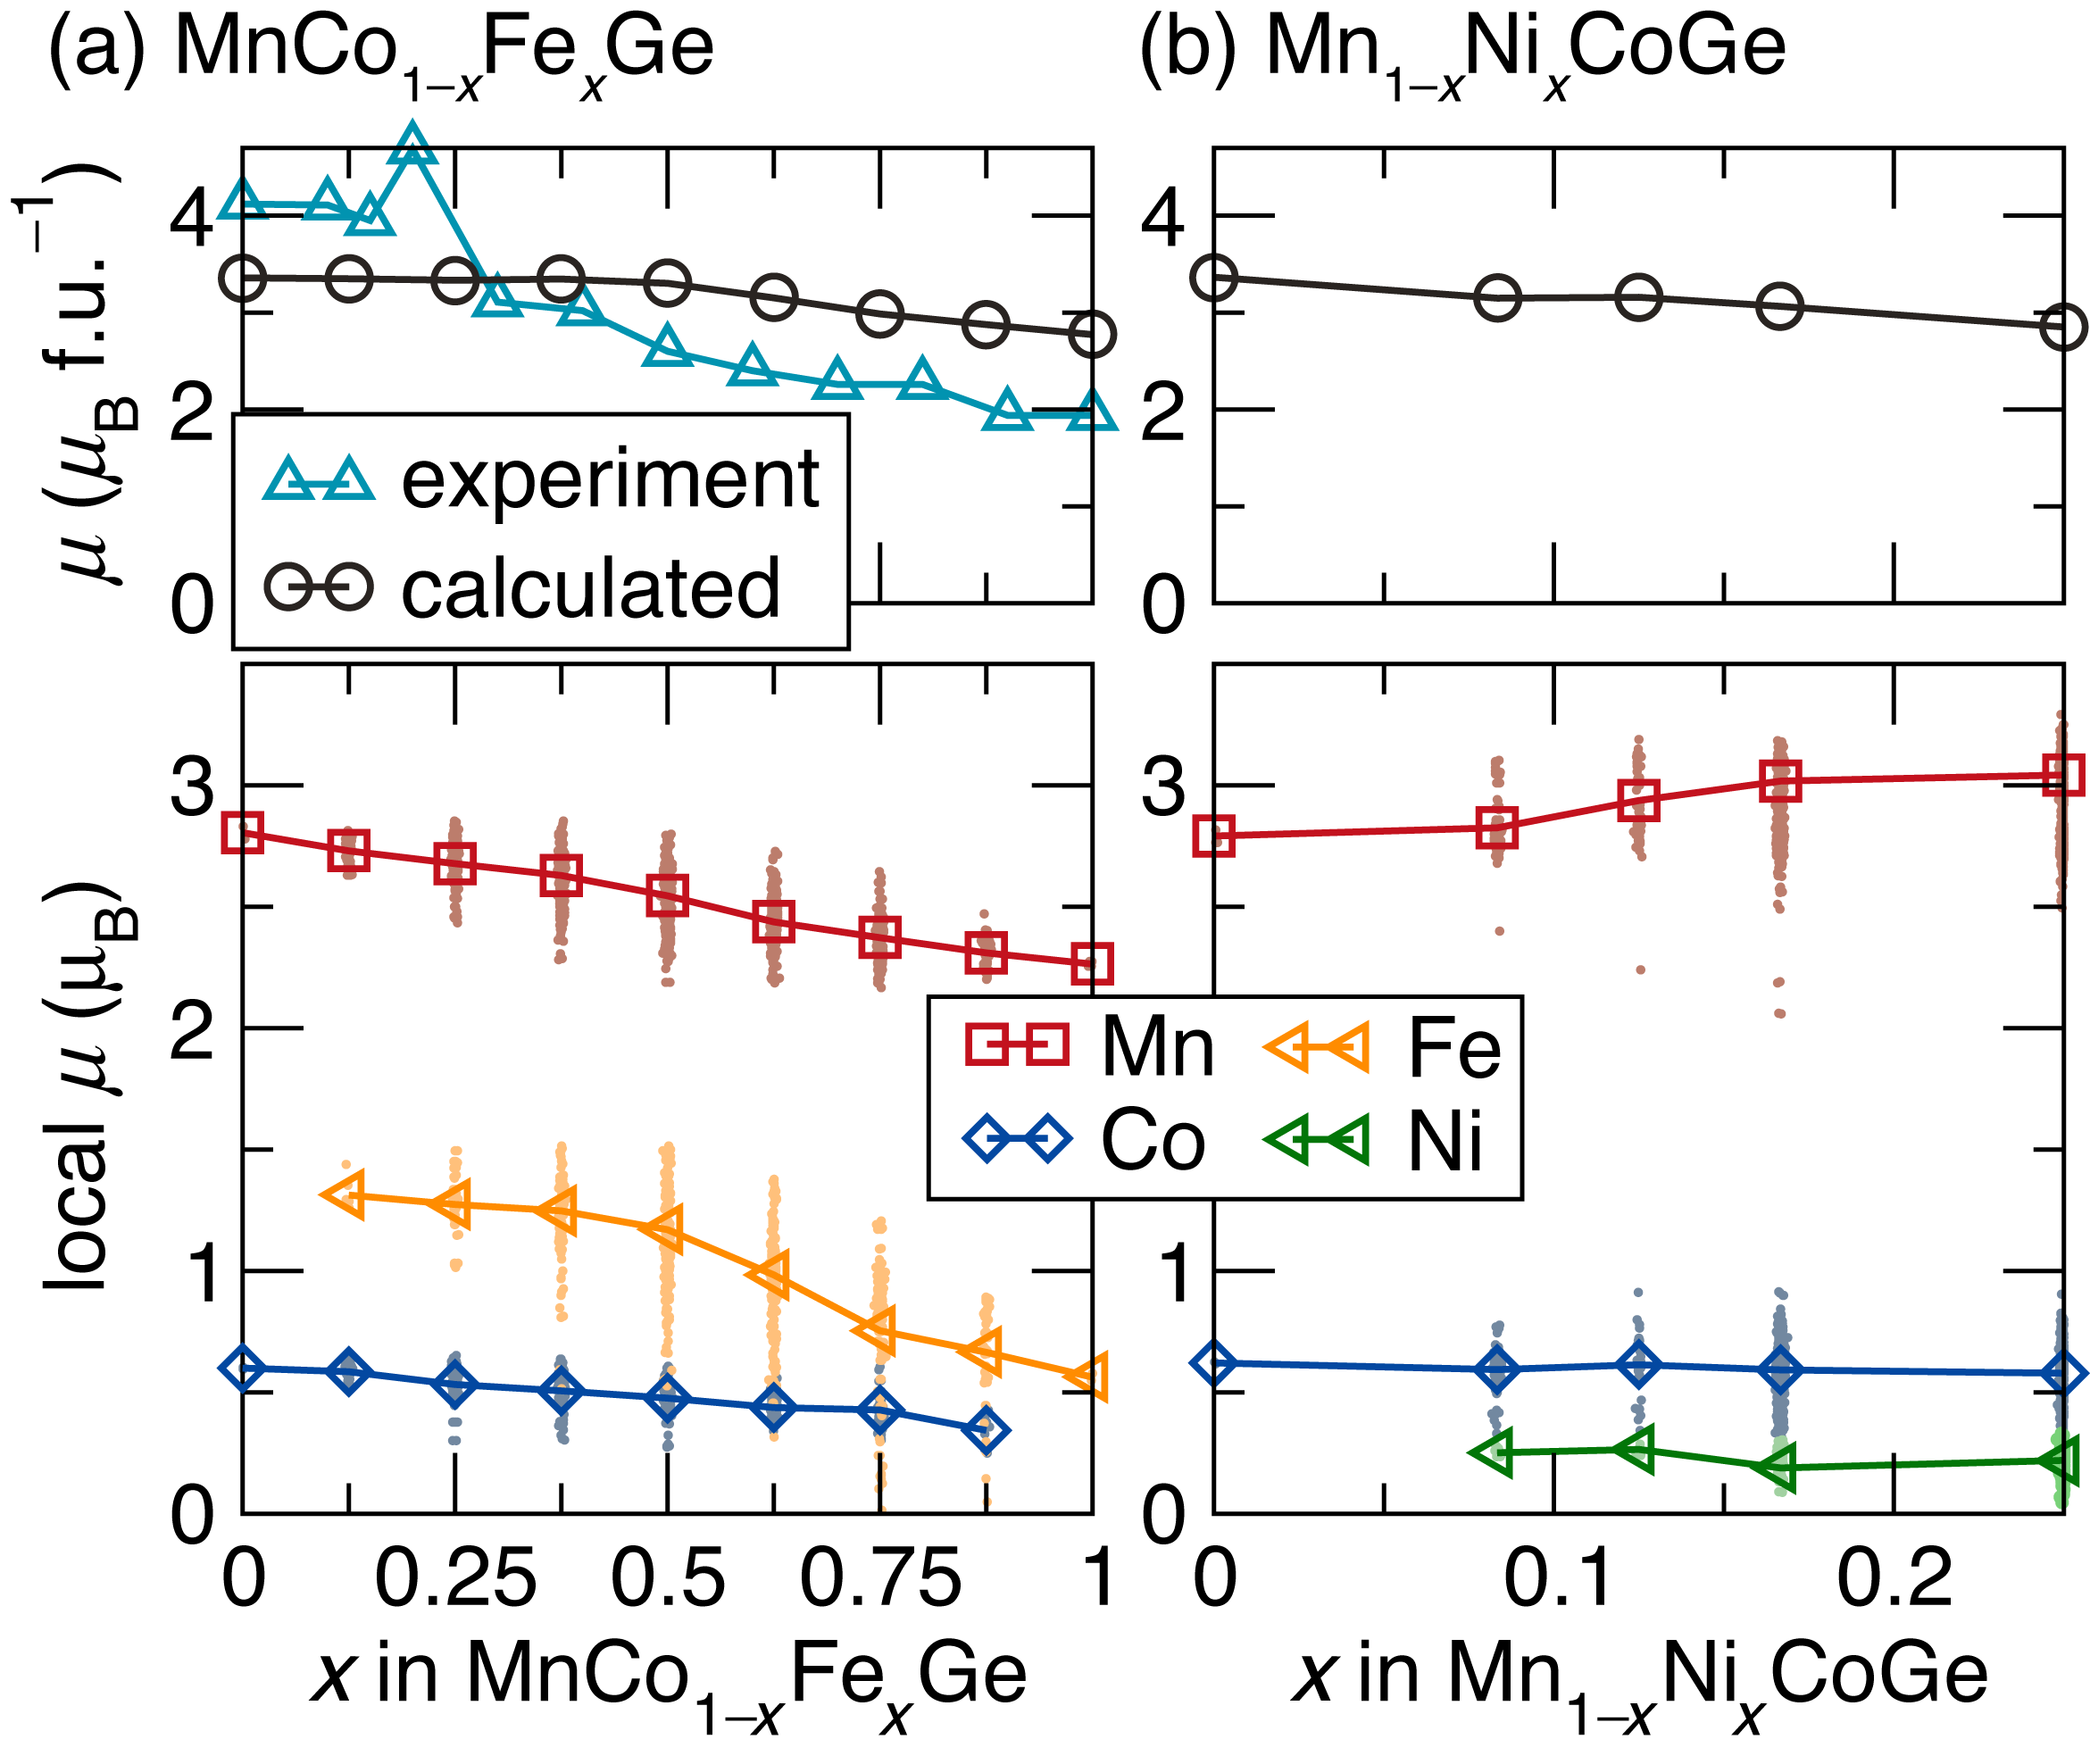
In addition to and cell energy, we obtain information from our calculations about the evolution of magnetic moments in these solid solutions. Figure 4 shows the DFT total moment (top) and projected local moments (bottom) for Mn(Co1-xFex)Ge and (Mn1-xNix)CoGe. As with the ensembled calculations, the total and local moments shown are a Boltzmann-weighted average of all of the moments in all of the enumerated supercell calculations. However, in this case, there are not substantial differences between Boltzmann-weighted and simple averages. In the case of Mn(Co1-xFex)Ge, a comparison to the reported experimental saturated moments at 5 K is included Lin et al. (2006), while we were unable to find such data for (Mn1-xNix)CoGe. From this comparison, we see that the calculated moment is underestimated for MnCoGe and overestimated for MnFeGe. As discussed in the methods section, it is likely that a more faithful reproduction of the experimental moments would require a GGA+ approach. However, the general trend of decreasing moment with increasing Fe content is captured by our calculations, and we can therefore use these results to draw insight into the local magnetic moment evolution. As Fe atoms are substituted in, they are found to hold a larger local moment than the Co atoms they replace (about 1 vs. 0.5 ). However, at the same time, the large Mn moments decrease in magnitude with increasing . The net effect is a decrease in total moment with . In (Mn1-xNix)CoGe, a decrease in total moment with is also predicted; however, in this case, the decrease is driven by the replacement of high-moment Mn atoms (3 ) with Ni atoms which have very small moments (about 0.25 ).
Returning to the results, we noticed that for the compositions showing maximal Boltzmann-averaged ( for Mn(Co1-xFex)Ge and for (Mn1-xNix)CoGe), the Boltzmann averages are dominated by a single enumerated cell which has significantly lower energy than the rest of the cells. For example, in Fig. 2(c), the energy of formation for all of the enumerated cells is plotted versus . At = 0.25, the cell marked with an asterisk is about 20 meV f.u.-1 lower in energy than all the other cells, and therefore contributes dominantly to the Boltzmann-averaged . This special unit cell also exhibits a larger than any of the other enumerations, and as a result this single cell is entirely responsible for the peak at = 0.25 in the Boltzmann-averaged . Inspection of the calculations for this special cell revealed that the magnetic structural optimization resulted in a cell with atom positions consistent with the hexagonal structure [Fig. 1(a)], while the nonmagnetic structural optimization stayed in the orthorhombic structure [Fig. 1(b)] with which the calculation was initialized. For the other enumerations at = 0.25, both the magnetic and nonmagnetic unit cells remained in the orthorhombic structure.
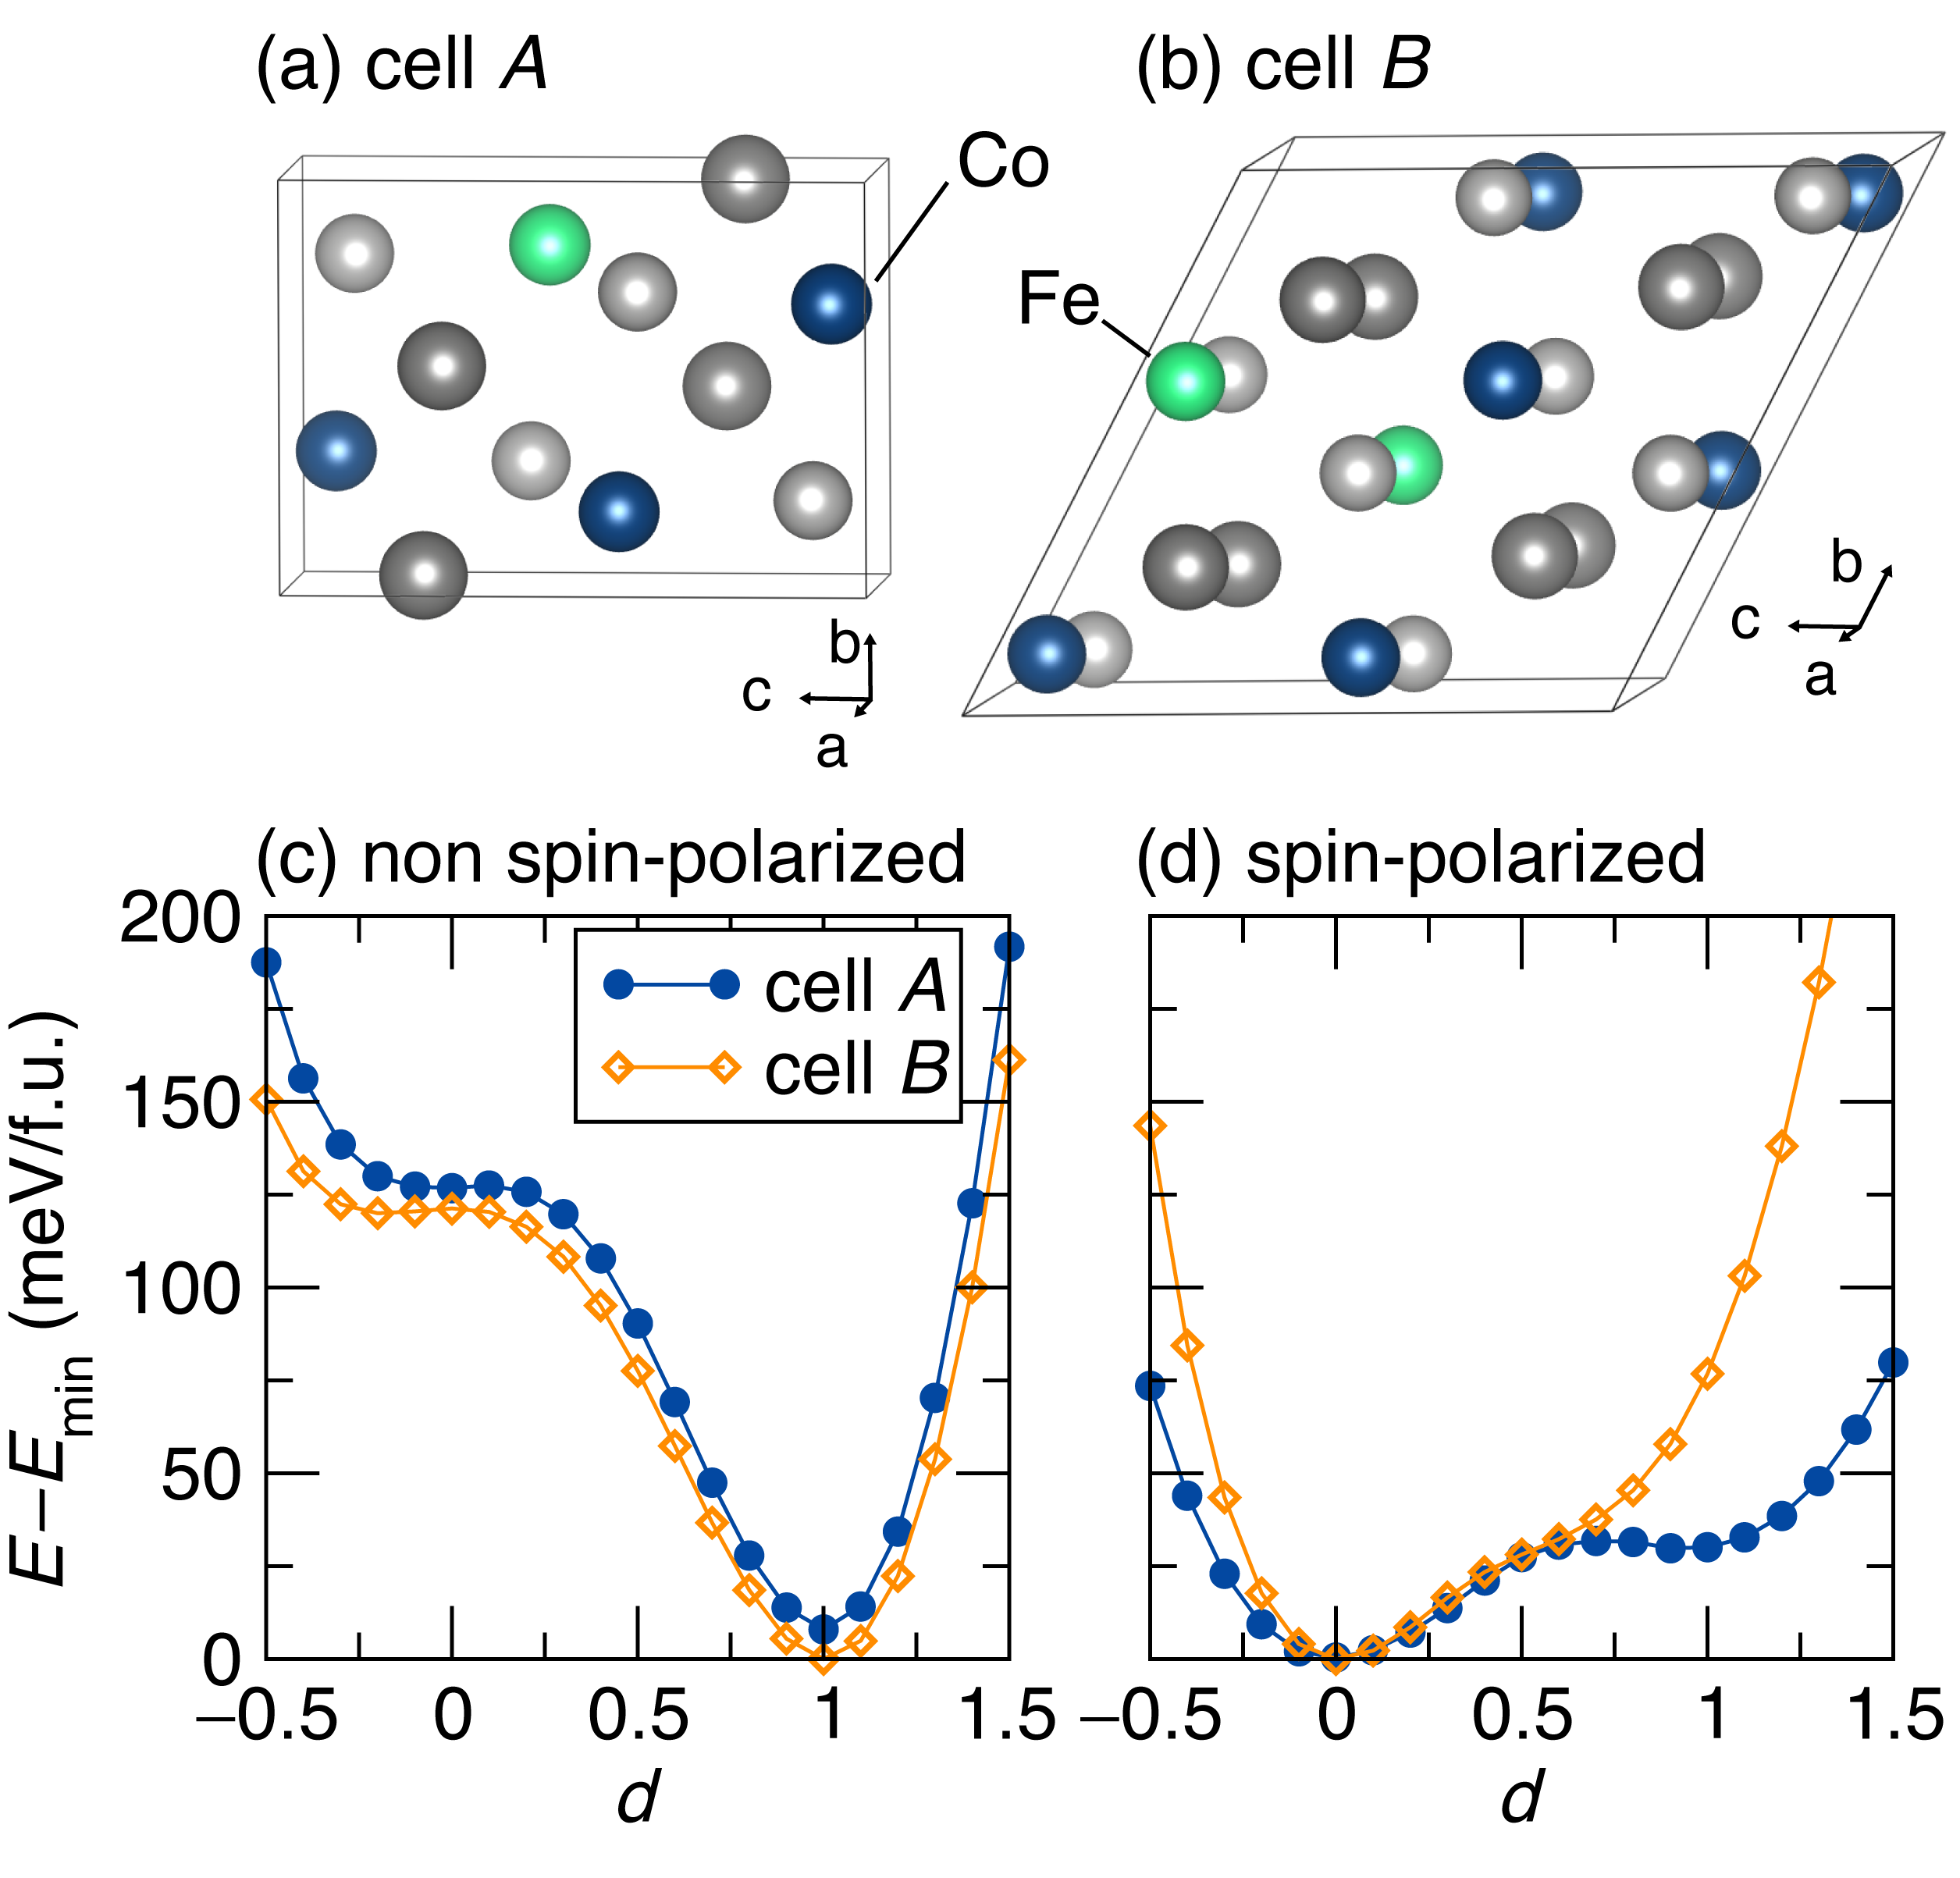
To understand this, we turned to calculations of the transition path energies between the hexagonal and orthorhombic structures of two representative enumerated cells with = 0.25: cell is a cell that stayed in the orthorhombic structure for both magnetic and nonmagnetic optimizations, and cell is the special cell that changed structures during the magnetic optimization. For each cell, Fig. 5 shows the energies of the transition paths with and without spin-polarization as functions of the fractional hexagonal distortion , with corresponding to the hexagonal structure, and to the orthorhombic structure. Interestingly, for both cells, the nonmagnetic calculation shows a global minimum at the orthorhombic structure while the magnetic calculation shows a global minimum at the hexagonal structure. As the enhanced magnetocaloric effect around = 0.2 in Mn(Co1-xFex)Ge is believed to arise from coupling of the magnetic transition to a structural transition, it is interesting to note that the inclusion of magnetism in the DFT calculation changes the predicted structural ground state. However, it is also important to note that the nonmagnetic DFT calculation should not be considered a realistic model for the true high-temperature paramagnetic state.
The transition path energies without spin polarization look qualitatively similar for cell and cell , with a very shallow local minimum at the hexagonal structure and a global minimum at the orthorhombic structure. In contrast, with spin polarization, greater differences between the two cells are evident. Cell exhibits a double well potential with a barrier between the wells, while cell has no barrier to relaxation into the global minimum hexagonal structure. As the optimizations used to calculate were initialized with an orthorhombic starting configuration, cell relaxed into the orthorhombic local minimum, while cell was able to relax into the global minimum structure. As a result of this feature of its potential energy surface, the DFT calculations on cell result in a lower energy and larger magnetic deformation than all other cells enumerated at this composition. We can therefore conclude that the effectiveness of the magnetic deformation proxy in identifying the extremal magnetocaloric composition in this system is driven by the ability to conveniently identify a potential energy surface with competing structural ground states whose energies are coupled to the system magnetism, and which has low barriers to relaxation from one state to the other. These features are consistent with the thermodynamic conditions necessary for a first-order magnetostructural transition leading to an enhanced magnetocaloric effect.
Based on this analysis, we proceed to consider what role the incomplete structural relaxations in cells like cell played in the evaluation of the overall . To address this, a parallel set of DFT calculations was run with the enumerated supercells initialized in the hexagonal structure, instead of the orthorhombic structure. The nonmagnetic and magnetic structures used in calculating were then each taken from the calculation that reached a lower energy state. The results are shown in Fig. 6, which can be compared to Fig. 2 in which only the orthorhombic initialization was considered. Providing an alternate path to relaxation for each cell increases the likelihood that the global energetic minimum is reached for each of the nonmagnetic and magnetic optimizations. As a result, more cells change structure type between the nonmagnetic and magnetic unit cells and the values increase. Both the Boltzmann and simple weighted averages of are seen to increase for all 0.8 in the Mn(Co1-xFex)Ge system such that the strong peak seen before at = 0.2 for the Boltzmann-averaged is smeared out and the qualitative match with the experimental data is weakened. Nevertheless, the composition and magnitude of the peak in remains very similar to the original calculations. Furthermore, this approach results in the Boltzmann and naive averages converging to nearly the same values for each composition. Therefore, if using this strategy to screen magnetocaloric systems, one does not necessarily need to exhaustively perform DFT calculations on all possible enumerations; rather, reasonably accurate results could be obtained by averaging together a small number of values (i.e, 5 – 10 cells) for each composition .
Summary and Conclusions
In this work, we introduce a method for screening experimental magnetocaloric behavior in disordered compounds (alloys) which employs the magnetic deformation proxy in conjunction with the enumeration of relatively small supercells of various compositions. We validate its screening utility by direct comparison to reported experimental measurements in Mn(Co1-xFex)Ge and (Mn1-xNix)CoGe, two systems where the magnetocaloric performance depends on in a highly nonmonotonic manner. In both cases, the method successfully predicts the presence and magnitude of enhanced magnetocaloric effects in the solid solutions compared to MnCoGe, reproducing the qualitative shape of the vs. curves and identifying the compositions of the largest magnetocaloric effect with errors of .
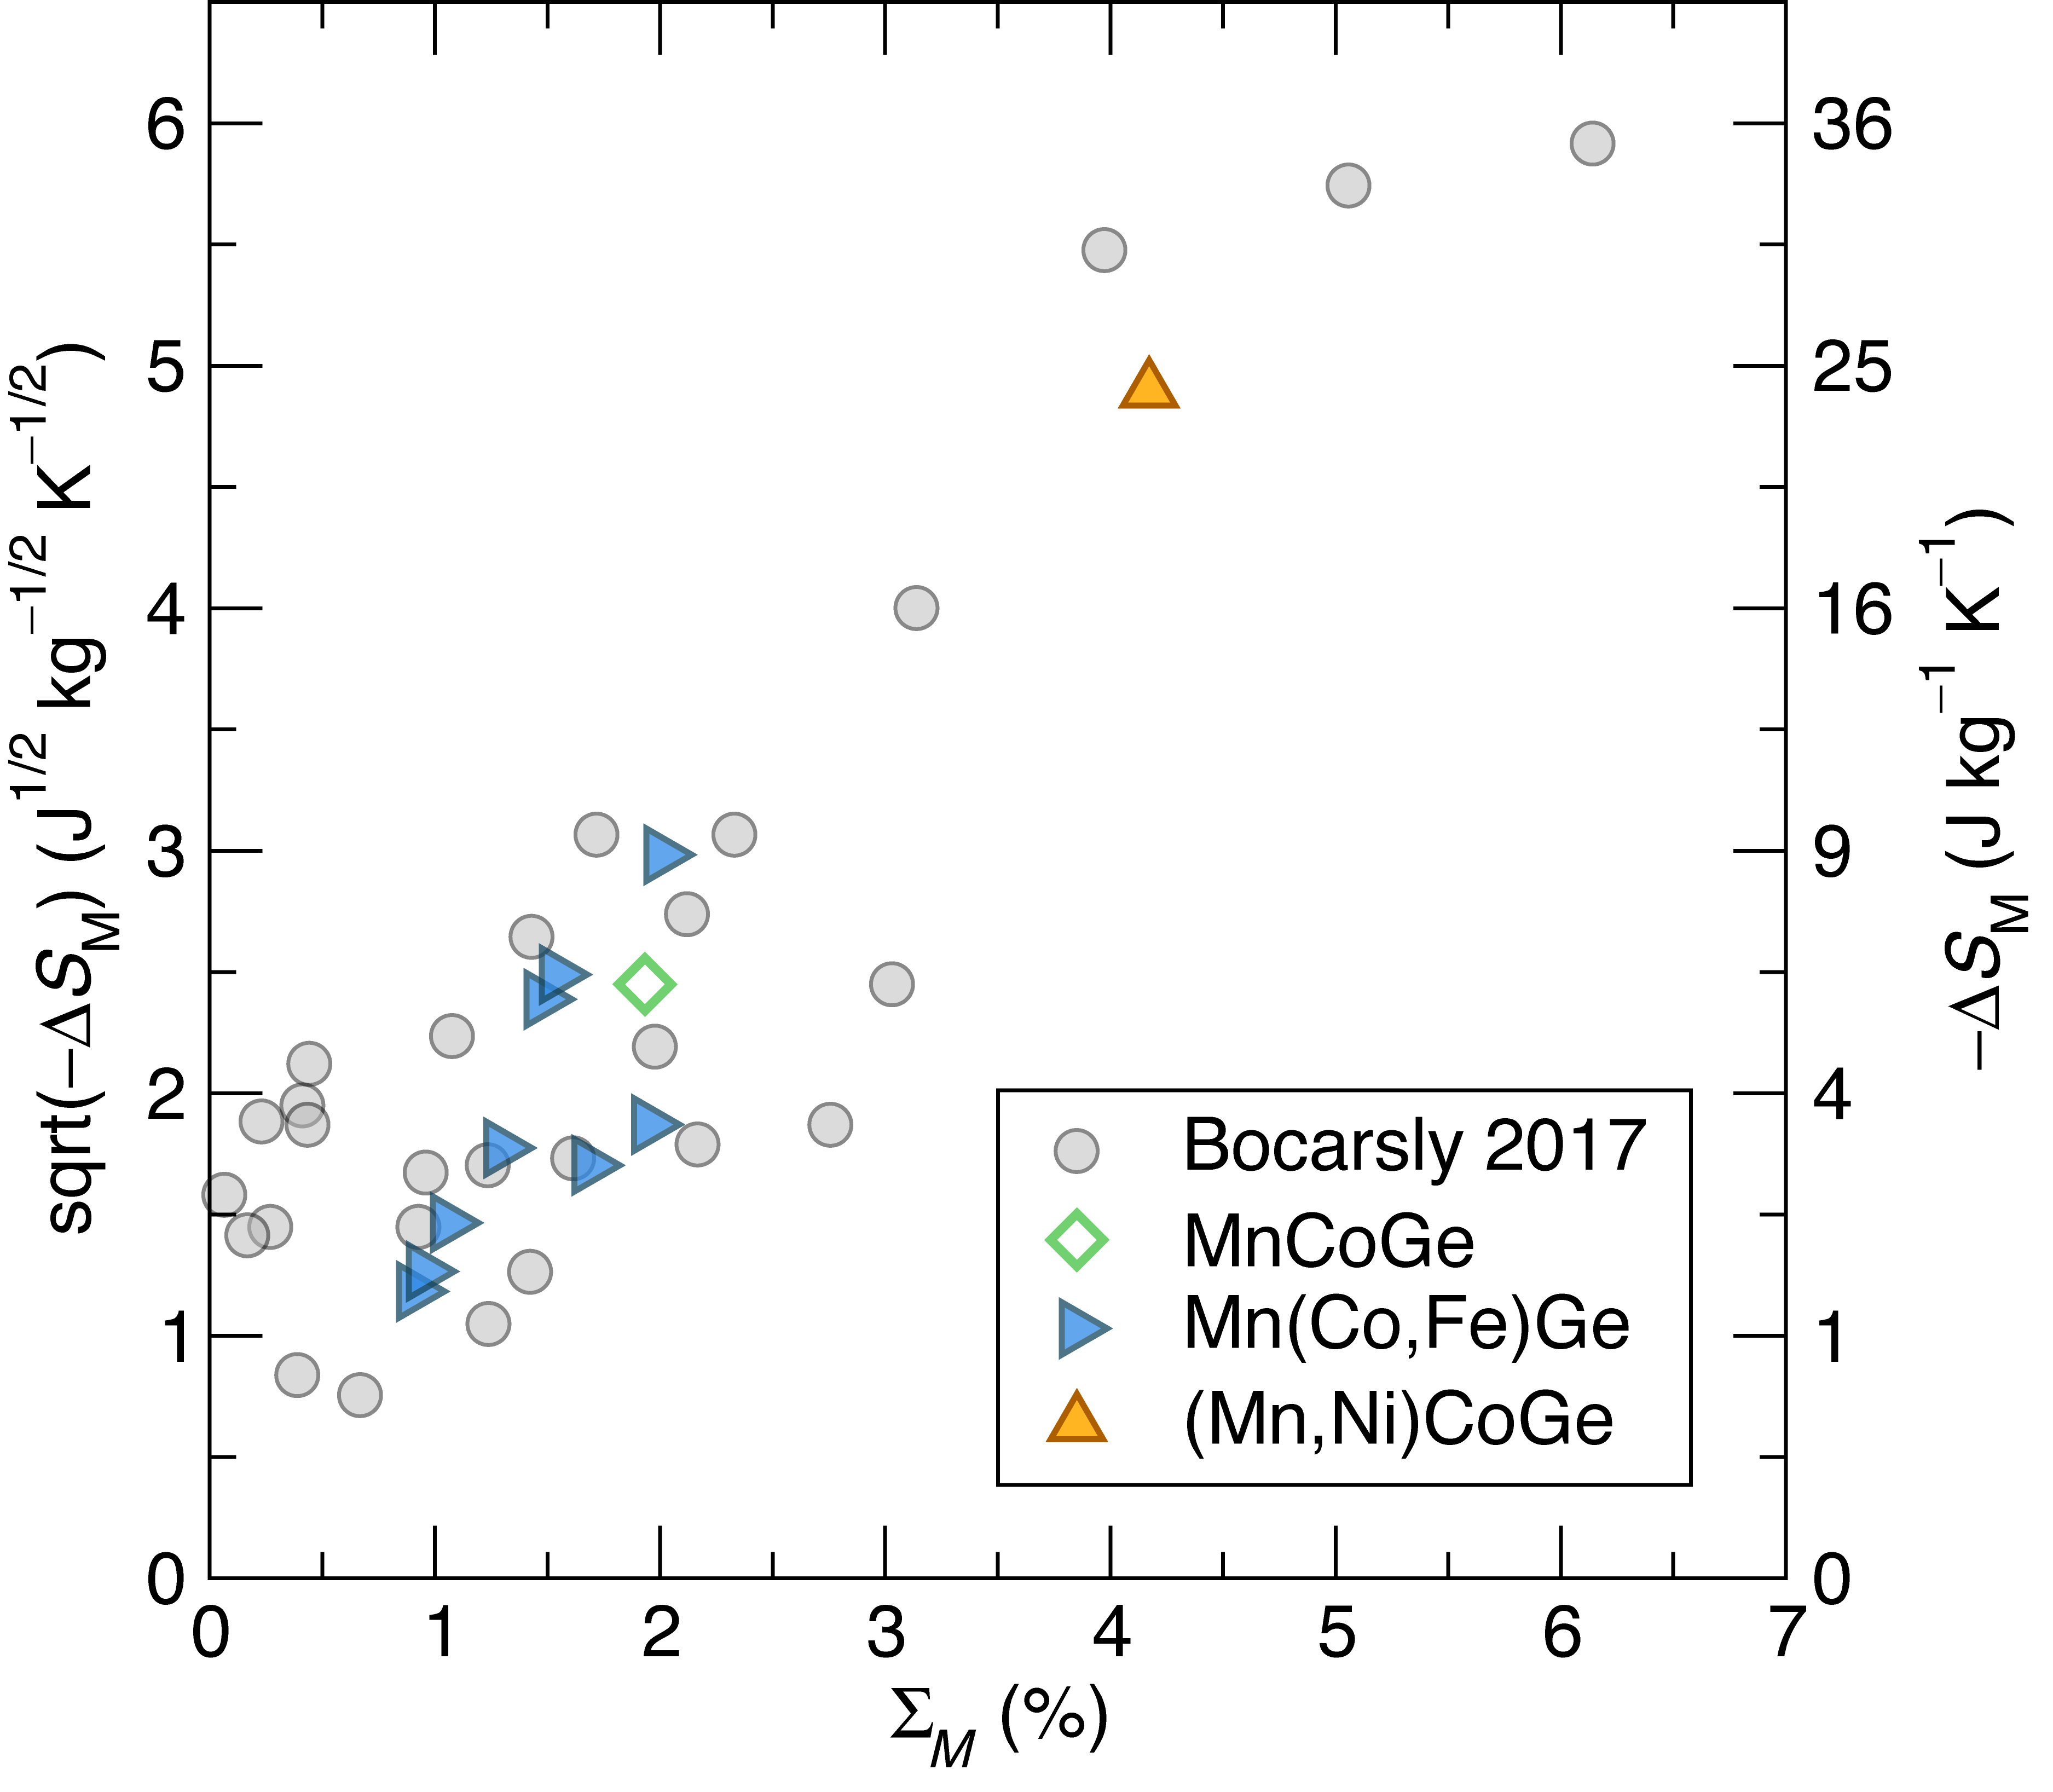
Fig. 7 provides a summary of these results, showing the correspondence between predicted and experimental peak as compared to previous results applying to 33 ferromagnets without substantial atomic site disorder Bocarsly et al. (2017). On this plot, all of the calculated points from the Mn(Co1-xFex)Ge system (Fig. 2) are plotted against the of the nearest composition experimentally reported by Lin et al. Lin et al. (2006). In (Mn1-xNix)CoGe, where the experimental data are more sparse and the composition with maximal somewhat deviates from the reported largest Zhang et al. (2015a), the maximum (at ) is plotted against the maximum (at ). This plot demonstrates that the magnetocaloric effects of these complex disordered systems are being screened with comparable accuracy to prior predictions of ordered magnets.
The success of in predicting behavior of these complex MnCoGe-based magnetocalorics demonstrates that screening disordered magnetocalorics is a promising route towards the discovery of exceptional magnetocaloric effects at unstudied compositions. This screening technique requires no information about the system other than the known crystal structure of the parent compound (here, MnCoGe), and therefore we believe this approach will be quite generally applicable. Due to the many supercells sampled (on the order of 200 for each system), the computational cost of obtaining on solid solutions is much larger than the cost of screening compounds without compositional disorder. Nevertheless, it would be feasible to apply this screening method to searches on the order of tens, or perhaps hundreds, of systems. For example, this method could be used to exhaustively screen elements for promise as dopants for MnCoGe or another magnetocaloric material of interest.
Acknowledgments
This work was supported by the National Science Foundation (NSF) through DMR 1710638. Use was made of the computational facilities of the Center for Scientific Computing (CSC) at UC Santa Barbara, supported by NSF CNS-1725797. The CSC is also supported by the NSF Materials Research Science and Engineering Center (DMR 1720256) at UC Santa Barbara. C.A.C.G and J.D.B. have been supported by the National Science Foundation Graduate Research Fellowship Program, by Grants DGE-1745303 and DGE-1650114, respectively.
References
- Curtarolo et al. (2012) S. Curtarolo, W. Setyawan, G. L. Hart, M. Jahnatek, R. V. Chepulskii, R. H. Taylor, S. Wang, J. Xue, K. Yang, O. Levy, M. J. Mehl, H. T. Stokes, D. O. Demchenko, and D. Morgan, AFLOW: An automatic framework for high-throughput materials discovery, Comput. Mater. Sci. 58, 218 (2012).
- Jain et al. (2013) A. Jain, S. P. Ong, G. Hautier, W. Chen, W. D. Richards, S. Dacek, S. Cholia, D. Gunter, D. Skinner, G. Ceder, and K. A. Persson, Commentary: The Materials Project: A materials genome approach to accelerating materials innovation, APL Mater. 1, 011002 (2013).
- Saal et al. (2013) J. E. Saal, S. Kirklin, M. Aykol, B. Meredig, and C. Wolverton, Materials Design and Discovery with High-Throughput Density Functional Theory: The Open Quantum Materials Database (OQMD), JOM 65, 1501 (2013).
- Hautier et al. (2011a) G. Hautier, A. Jain, S. P. Ong, B. Kang, C. Moore, R. Doe, and G. Ceder, Phosphates as Lithium-Ion Battery Cathodes: An Evaluation Based on High-Throughput ab Initio Calculations, Chem. Mater. 23, 3495 (2011a).
- Hill et al. (2016) J. Hill, G. Mulholland, K. Persson, R. Seshadri, C. Wolverton, and B. Meredig, Materials science with large-scale data and informatics: Unlocking new opportunities, MRS Bull. 41, 399 (2016).
- de Pablo et al. (2019) J. J. de Pablo, N. E. Jackson, M. A. Webb, L.-Q. Chen, J. E. Moore, D. Morgan, R. Jacobs, T. Pollock, D. G. Schlom, E. S. Toberer, J. Analytis, I. Dabo, D. M. DeLongchamp, G. A. Fiete, G. M. Grason, G. Hautier, Y. Mo, K. Rajan, E. J. Reed, E. Rodriguez, V. Stevanovic, J. Suntivich, K. Thornton, and J.-C. Zhao, New frontiers for the materials genome initiative, npj Comput. Mater. 5, 41 (2019).
- Johannesson et al. (2002) G. H. Johannesson, T. Bligaard, A. V. Ruban, H. L. Skriver, K. W. Jacobsen, and J. K. Nørskov, Combined electronic structure and evolutionary search approach to materials design, Phys. Rev. Lett. 88, 255506 (2002).
- Bligaard et al. (2003) T. Bligaard, G. H. Jóhannesson, A. V. Ruban, H. L. Skriver, K. W. Jacobsen, and J. K. Nørskov, Pareto-optimal alloys, Appl. Phys. Lett. 83, 4527 (2003).
- Kirklin et al. (2016) S. Kirklin, J. E. Saal, V. I. Hegde, and C. Wolverton, High-throughput computational search for strengthening precipitates in alloys, Acta Mater. 102, 125 (2016).
- Kirklin et al. (2013) S. Kirklin, B. Meredig, and C. Wolverton, High-Throughput Computational Screening of New Li-Ion Battery Anode Materials, Adv. Energy Mater. 3, 252 (2013).
- Yan et al. (2015) J. Yan, P. Gorai, B. Ortiz, S. Miller, S. A. Barnett, T. Mason, V. Stevanović, and E. S. Toberer, Material descriptors for predicting thermoelectric performance, Energy Environ. Sci. 8, 983 (2015).
- Yu and Zunger (2012) L. Yu and A. Zunger, Identification of Potential Photovoltaic Absorbers Based on First-Principles Spectroscopic Screening of Materials, Phys. Rev. Lett. 108, 068701 (2012).
- Fabini et al. (2019) D. H. Fabini, M. Koerner, and R. Seshadri, Candidate Inorganic Photovoltaic Materials from Electronic Structure-Based Optical Absorption and Charge Transport Proxies, Chem. Mater. 31, 1561 (2019).
- Bocarsly et al. (2017) J. D. Bocarsly, E. E. Levin, C. A. C. Garcia, K. Schwennicke, S. D. Wilson, and R. Seshadri, A simple computational proxy for screening magnetocaloric compounds, Chem. Mater. 29, 1613 (2017).
- Brgoch et al. (2013) J. Brgoch, S. P. DenBaars, and R. Seshadri, Proxies from Ab Initio Calculations for Screening Efficient Ce 3+ Phosphor Hosts, J. Phys. Chem. C 117, 17955 (2013).
- Rondinelli et al. (2015) J. M. Rondinelli, K. R. Poeppelmeier, and A. Zunger, Research Update: Towards designed functionalities in oxide-based electronic materials, APL Mater. 3, 080702 (2015).
- Tegus et al. (2002) O. Tegus, E. Brück, K. H. J. Buschow, and F. R. de Boer, Transition-metal-based magnetic refrigerants for room-temperature applications, Nature 415, 150 (2002).
- Brück et al. (2004) E. Brück, O. Tegus, L. Zhang, X. Li, F. de Boer, and K. Buschow, Magnetic refrigeration near room temperature with Fe2P-based compounds, J. Alloys Compd. Proceedings of the 14th International Conference on Solid Compounds of Transition Elements (SCTE 2003), 383, 32 (2004).
- Cam Thanh et al. (2008) D. T. Cam Thanh, E. Brück, N. T. Trung, J. C. P. Klaasse, K. H. J. Buschow, Z. Q. Ou, O. Tegus, and L. Caron, Structure, magnetism, and magnetocaloric properties of MnFeP1-xSix compounds, J. Appl. Phys. 103, 07B318 (2008).
- Grebenkemper et al. (2018) J. H. Grebenkemper, J. D. Bocarsly, E. E. Levin, G. Seward, C. Heikes, C. Brown, S. Misra, F. Seeler, K. Schierle-Arndt, S. D. Wilson, and R. Seshadri, Rapid Microwave Preparation and Composition Tuning of the High-Performance Magnetocalorics (Mn,Fe)2(P,Si), ACS Appl. Mater. Interfaces 10, 7208 (2018).
- Fujieda et al. (2002) S. Fujieda, A. Fujita, and K. Fukamichi, Large magnetocaloric effect in La(FexSi1-x)13 itinerant-electron metamagnetic compounds, Appl. Phys. Lett. 81, 1276 (2002).
- Shen et al. (2009) B. G. Shen, J. R. Sun, F. X. Hu, H. W. Zhang, and Z. H. Cheng, Recent Progress in Exploring Magnetocaloric Materials, Adv. Mater. 21, 4545 (2009).
- Pecharsky and Gschneidner, Jr. (1997) V. K. Pecharsky and K. A. Gschneidner, Jr., Giant magnetocaloric effect in Gd5(Si,Ge)2, Phys. Rev. Lett. 78, 4494 (1997).
- Choe et al. (2000) W. Choe, V. K. Pecharsky, A. O. Pecharsky, K. A. Gschneidner, V. G. Young, and G. J. Miller, Making and Breaking Covalent Bonds across the Magnetic Transition in the Giant Magnetocaloric Material Gd5(Si2Ge2), Phys. Rev. Lett. 84, 4617 (2000).
- Trung et al. (2010) N. T. Trung, L. Zhang, L. Caron, K. H. J. Buschow, and E. Brück, Giant magnetocaloric effects by tailoring the phase transitions, Appl. Phys. Lett. 96, 172504 (2010).
- Zhang et al. (2015a) C. Zhang, H. Shi, E. Ye, Y. Nie, Z. Han, and D. Wang, Magnetostructural transition and magnetocaloric effect in MnCoGe–NiCoGe system, J. Alloys Compd. 639, 36 (2015a).
- Zhang et al. (2015b) D. Zhang, Z. Nie, Z. Wang, L. Huang, Q. Zhang, and Y. D. Wang, Giant magnetocaloric effect in MnCoGe with minimal Ga substitution, J. Magn. Magn. Mater. 387, 107 (2015b).
- Brown (1976) G. V. Brown, Magnetic heat pumping near room temperature, J. Appl. Phys. 47, 3673 (1976).
- Franco et al. (2012) V. Franco, J. Blázquez, B. Ingale, and A. Conde, The magnetocaloric effect and magnetic refrigeration near room temperature: materials and models, Annu. Rev. Mater. Res. 42, 305 (2012).
- Takeuchi and Sandeman (2015) I. Takeuchi and K. Sandeman, Solid-state cooling with caloric materials, Phys. Today 68, 48 (2015).
- McLinden et al. (2017) M. O. McLinden, J. S. Brown, R. Brignoli, A. F. Kazakov, and P. A. Domanski, Limited options for low-global-warming-potential refrigerants, Nat. Commun. 8, 14476 (2017).
- Bocarsly et al. (2019) J. D. Bocarsly, E. E. Levin, S. A. Humphrey, T. Faske, W. Donner, S. D. Wilson, and R. Seshadri, Magnetostructural Coupling Drives Magnetocaloric Behavior: The Case of MnB versus FeB, Chem. Mater. 31, 4873 (2019).
- Dung et al. (2011) N. H. Dung, L. Zhang, Z. Q. Ou, and E. Brück, From first-order magneto-elastic to magneto-structural transition in (Mn,Fe) 1.95 P 0.50 Si 0.50 compounds, Appl. Phys. Lett. 99, 092511 (2011).
- Franco et al. (2017) V. Franco, J. Y. Law, A. Conde, V. Brabander, D. Y. Karpenkov, I. Radulov, K. Skokov, and O. Gutfleisch, Predicting the tricritical point composition of a series of LaFeSi magnetocaloric alloys via universal scaling, J. Phys. D. Appl. Phys. 50, 414004 (2017).
- Davarpanah et al. (2019) A. Davarpanah, J. H. Belo, V. S. Amaral, and J. S. Amaral, On the Optimization of Magneto-Volume Coupling for Practical Applied Field Magnetic Refrigeration, Phys. status solidi 256, 1800419 (2019).
- Lin et al. (2006) S. Lin, O. Tegus, E. Brück, W. Dagula, T. Gortenmulder, and K. Buschow, Structural and magnetic properties of MnFe1-xCoxGe compounds, IEEE Trans. Magn. 42, 3776 (2006).
- Landrum et al. (1998) G. A. Landrum, R. Hoffmann, J. Evers, and H. Boysen, The TiNiSi Family of Compounds: Structure and Bonding, Inorg. Chem. 37, 5754 (1998).
- Van der Ven et al. (2010) A. Van der Ven, J. C. Thomas, Q. Xu, and J. Bhattacharya, Linking the electronic structure of solids to their thermodynamic and kinetic properties, Math. Comput. Simul. 80, 1393 (2010).
- Thomas and Van der Ven (2013) J. C. Thomas and A. Van der Ven, Finite-temperature properties of strongly anharmonic and mechanically unstable crystal phases from first principles, Phys. Rev. B 88, 214111 (2013).
- Puchala and Van Der Ven (2013) B. Puchala and A. Van Der Ven, Thermodynamics of the Zr-O system from first-principles calculations, Phys. Rev. B 88, 094108 (2013).
- Kresse and Furthmüller (1996) G. Kresse and J. Furthmüller, Efficient iterative schemes for ab initio total-energy calculations using a plane-wave basis set, Phys. Rev. B 54, 11169 (1996).
- Perdew et al. (1996) J. P. Perdew, K. Burke, and M. Ernzerhof, Generalized gradient approximation made simple, Phys. Rev. Lett. 77, 3865 (1996).
- Blöchl (1994) P. E. Blöchl, Projector augmented-wave method, Phys. Rev. B 50, 17953 (1994).
- Ong et al. (2013) S. P. Ong, W. D. Richards, A. Jain, G. Hautier, M. Kocher, S. Cholia, D. Gunter, V. L. Chevrier, K. A. Persson, and G. Ceder, Python Materials Genomics (pymatgen): A robust, open-source python library for materials analysis, Comput. Mater. Sci. 68, 314 (2013).
- Catti (1985) M. Catti, Calculation of elastic constants by the method of crystal static deformation, Acta Crystallogr., Sect. A Found. Crystallogr. 41, 494 (1985).
- de la Flor et al. (2016) G. de la Flor, D. Orobengoa, E. Tasci, J. M. Perez-Mato, and M. I. Aroyo, Comparison of structures applying the tools available at the bilbao crystallographic server, J. Appl. Crystallogr. 49, 653 (2016).
- Zunger et al. (1990) A. Zunger, S.-H. Wei, L. G. Ferreira, and J. E. Bernard, Special quasirandom structures, Phys. Rev. Lett. 65, 353 (1990).
- van de Walle et al. (2013) A. van de Walle, P. Tiwary, M. De Jong, D. Olmsted, M. Asta, A. Dick, D. Shin, Y. Wang, L.-Q. Chen, and Z.-K. Liu, Efficient stochastic generation of special quasirandom structures, Calphad 42, 13 (2013).