Cooper minimum of high-order harmonic spectra from MgO crystal in an ultrashort laser pulse
Abstract
Cooper minimum structure of high-order harmonic spectra from atoms or molecules has been extensively studied. In this paper, we demonstrate that the crystal harmonic spectra from an ultrashort mid-infrared laser pulse also exhibit the Cooper minimum characteristic. Based on the accurate band dispersion and k-dependent transition dipole moment (TDM) from the first-principle calculations, it can be found that the harmonic spectra from MgO crystal along -X direction present a dip structure in the plateau, which is originated from the valley of TDM by examining the distribution of the harmonic intensity at the k-space. The Cooper minimum feature in crystal HHG will pave a new way to retrieve the band information of solid materials by using HHG from the ultrashort mid-infrared laser pulse.
I Introduction
Atoms and molecules irradiated by an intense laser pulse can produce high-order harmonic generation (HHG) Chen1 ; Chen2 ; Tzallas3 ; Sansone4 ; Goulielmakis5 ; Zhang6 ; Bian7 ; Du8 ; Yuan9 ; Zhu10 ; Lin11 ; Zhang12 ; Li13 . Under the influence of the strong laser field, an electron can be ionized from the bound state, and accelerated in the continuum state, finally it can recombine with the ion and gives rise to the emission of extreme ultraviolet (XUV) radiation Zhu10 ; Lan14 . The emitted XUV radiation is closely related to the photorecombination, thus it could encode the structural information on the irradiated target and can be used to study structural features of the target and in particular the Cooper minimum Farrell15 ; Cloux16 ; Schoun17 , which corresponds to the nodal structure in the bound-free transition matrix element.
Because of clear signatures, the photoionization spectroscopy has been traditionally used to observe the Cooper minimum. In the process of HHG, the photorecombination is essentially the time inverse of photoionization, therefore the Cooper minimum should also appear in the harmonic spectra from atoms or molecules. The minimum structure in HHG from atoms or aligned molecules have been extensively investigated in many works Higuet19 ; Higuet20 ; Wong21 ; Farrell15 ; Cloux16 ; Schoun17 ; Farrell18 . Recently, HHG from solids has attracted great interest because of significant applications in attocecond pulse generation and all-optical reconstruction of the band dispersion of solids Vampa22 ; Venkataraman23 . It has demonstrated theoretically and experimentally that the interband polarization dominates the harmonics above the band gap for MgO, ZnO, and GaAs driven by a mid-infrared laser pulse Ghimire24 ; Vampa25 ; Wu26 ; Vampa27 . The interband process for solid HHG can be understood by the semiclasscial recollision model Ghimire24 ; Vampa25 ; Vampa28 ; Lewenstein29 ; S. A.30 ; Dimitrovski31 ; Vampa32 ; Jiang33 : the electron firstly tunneling excitation from the valence band, then the acceleration on the conduction band, finally the electron-hole recombination results in the harmonic photon. Since the harmonic generation from the interband current depends strongly on the transition dipole moment (TDM) Wismer34 ; Chao35 ; Jiang36 of the solid, if there exists a zero in the matrix element between the valence band and the conduction one, analogous to the harmonic spectra from gaseous media, the Cooper minimum structure is expected to appear in the harmonic spectra from solids.
In this paper, based on the accurate band dispersion and k-dependent TDM from the first-principle calculations, we study the feature of HHG from MgO crystal in an ultrashort mid-infrared laser pulse. It is found that, the harmonic spectra from TDM by the first-principle theory show a clear dip structure, which almost does not depend on the parameters of the driving laser pulse. Through analyzing the distribution of the harmonic intensity at different crystal momentums, it is clarified that the minimum of TDM leads to the Cooper minimum structure of HHG spectra.
II Theory and Models
II.1 Semiconductor Bloch equations
Based on the solution of two-band semiconductor Bloch equations (SBEs) Tamaya37 ; Fldi38 ; Golde39 ; Golde40 , we investigate the interaction of an ultrashort mid-infrared laser pulse with MgO crystal. Atomic units are used throughout this article, unless stated otherwise. A linearly polarized laser field is propagated along the -X direction of MgO, and the corresponding SBEs Jiang41 ; Luu42 ; Yu43 ; Wu26 can be read
| (1) |
| (2) |
| (3) |
Here, is the dispersion of the highest valence (lowest conduction) band contributing to HHG , is the population in the corresponding band, and are the microscopic interband polarization and the transition dipole moment between the conduction and valence bands, respectively. is the laser electric field with a Gaussian envelope and being the polarization direction. T2 is the interband dephasing time. In this paper, T2 is set to a quarter-cycle of the driving laser field.
The intraband current because of the motions of the carriers in the bands under a laser pulse is given by
| (4) |
where is the group velocity and is the band index. The interband polarization from the recombination of the electron with the hole can be expressed by
| (5) |
In this work we are interested in the harmonic spectrum, which is proportional to the absolute square of the projection of the Fourier-transformed total current onto the laser polarization direction,
| (6) |
II.2 Band structure and transition dipole moment
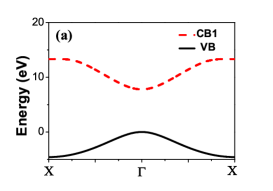
The interband and intraband currents depend significantly on the band structure and TDM Ghimire24 ; Chao35 . By using the Vienna Abinitio Simulation Package (VASP) code Korbman44 ; John45 , accurate k-dependent energy bands and TDM are achieved here. Geometric optimizations of MgO crystal with symmetry group were performed within generalized gradient approximation (GGA) in the parametrization of Perdew-Burke-Ernzerhof (PBE). The energy cutoff was set to be 400 eV, and a k-point Monkhorst pack mesh of 10 1010 was used in the Brillouin zone for electronic structure calculations. The band dispersion and TDM of MgO along the -X direction were calculated by the HSE06 hybrid function with parameter AEXX0.43, which predict a band gap of 7.8 eV, consistent with the experimental value You46 . Based on the accurate band structure as shown in Fig. 1(a), the k-dependent TDM can be given by the following two methods, where the TDM between the valence band and the conduction one from the first-principle theory can be expressed by
| (7) |
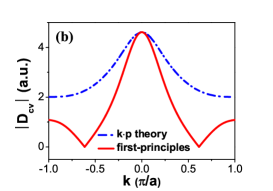
Because MgO crystal has inversion symmetry, the TDM between the lowest conduction band and the highest valence band is a real and even function Jiang41 , as presented by the red solid line in Fig. 1(b).
In most of previous works about solid HHG, the TDM was calculated by the first-order theory Chao35 ,
| (8) |
which is valid when the carriers in conduction or valence bands are mostly populated at . However, under the interaction of a strong laser pulse, electrons (holes) may travel through the entire Brillouin zone, thus the TDM from the first-order approximation is not applicable to this situation. For comparison, the TDM from the first-order theory is also shown by the blue dot dashed line in Fig. 1(b). Obviously, TDM in the first-principle case exists minima at k=0.6 (=4.213 Å) and valley structures. Yu . proved that, the shape of the k-dependent TDM plays an important role in harmonic generation Chao35 . Therefore, we will discuss how the difference in shapes of TDMs effects the HHG spectra.
III COOPER MINIMUM STRUCTURE OF CRYSTAL HHG
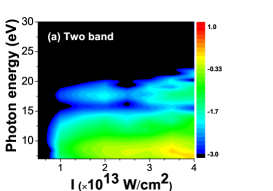
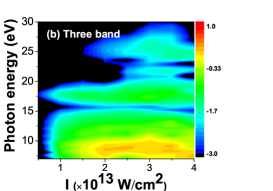
In terms of two-band and three-band SBEs, we firstly examine the dependence of crystal HHG spectra from the first-principle calculations on the driving laser intensity, as shown in Figs. 2(a) and 2(b), respectively. Here, the 3 fs1600 nm mid-infrared laser pulse with carrier envelope phase (CEP) 0 is chosen, and the corresponding peak intensity inside the crystal is changed from to . One can see that, as the increase of the laser intensity, HHG spectra in both cases are almost same and the harmonic efficiency is gradually enhanced; when the peak intensity of the laser pulse is stronger than , the harmonic spectra from the three-band model appear a clear two-plateau structure. In particular, harmonic spectra from the two cases exhibit an apparent minimum near 16 eV in the first plateau. In the following, for better explaining the origin of the dip structure, we focus on harmonic spectra from the two-band SBEs.
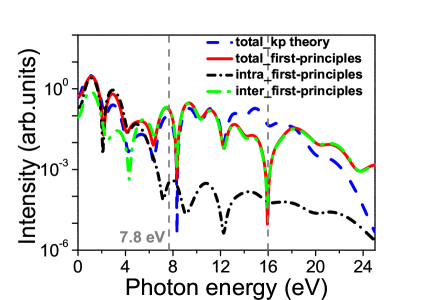
Based on the real TDM from the first-principle calculations, the red solid, black short-dash-dotted and green dash-dotted lines in Fig. 3 present harmonic spectra of MgO crystal in the ultrashort laser pulse, which are generated by the total current, intraband current and the interband polarization, respectively. The laser peak intensity of the incident laser pulse is (about Å), which is lower than the damage threshold of MgO. It is clear that harmonics below/above the bandgap are dominated by intraband/ interband currents, which agree with the recent results for ZnO, MgO, and GaAs in mid-infrared laser pulses Vampa28 ; You46 ; Golde47 ; Wang48 ; Wu49 . Figure 3 also shows the harmonic spectrum (blue dashed line) from the TDM based on the first-order theory. In this case, intensities of harmonics in the plateau are almost same. However, for the spectrum based on the first-principle calculations, there exists an obvious minimum structure when the photon energy is 16 eV. This distinction in both cases indicates that the TDM′s shape has a significant effect on the crystal harmonic spectra.
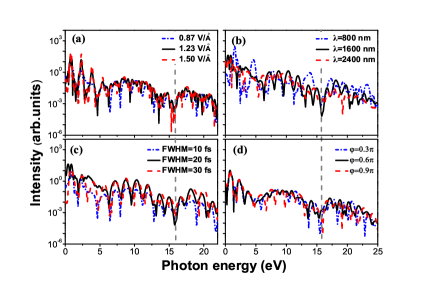
Next, we check the influence of laser parameters to the dip structure in harmonic spectra from the real TDM based on the first-principle calculations. Figs. 4(a)-4(d) show the HHG spectra of MgO crystal in laser pulses with different intensity, wavelength, duration, and CEP, respectively. It is found that, the minimum structure at harmonic spectra is almost independent of parameters of the driving laser pulses. Because harmonics in the plateau are mainly originated from the interband polarization, it is natural to deduce that the dip structure is related to the characteristic of the real TDM of MgO crystal. In the following, for intuitively clarifying the minimum feature, we focus on the HHG spectrum from the ultrashort laser pulse, as shown by the red solid line in Fig. 3.
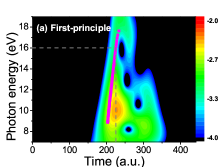
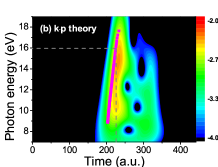
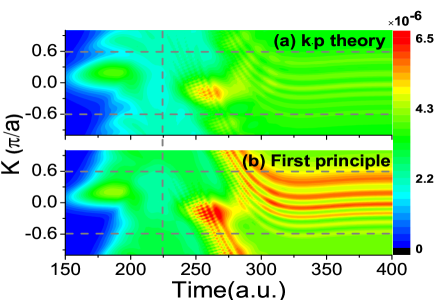
In order to further understand the emission process in crystal HHG, time-frequency analyses of the harmonic spectra for first-principle and first-order theory cases are presented in Figs. 5(a) and 5(b). In both cases, time-frequency diagrams of HHG are similar, harmonics beyond the bandgap are primarily caused by one quantum path. This result is further confirmed by the harmonic photon energy vs the emission instant calculated from the semiclassical recollision model, as shown in the purple circle curve from Fig. 5. It means that the harmonic photon above the band gap and the crystal momentum at the emission instant has a one-to-one correspondence in the ultrashort laser pulse. Furthermore, the time-frequency distribution in Fig. 5(a) shows one hole at the photon energy with 16 eV, which directly correspond to the dip in the harmonic spectrum (the red solid curve) in Fig. 3. In contrast to the first-principle case, there is no hole at 16 eV in the HHG time-frequency distribution from the first-order theory, as shown in Fig. 5(b). The above results further testify that the minimum structure of the harmonic spectrum is closely concerned with the TDM of the crystal.
The efficiency of HHG from the interband current is proportional to the population of the electron (hole) and the TDM between conduction and valence bands at the recombination time . It can be observed that, the emission instant is 225 a.u. from Fig. 5 when the energy of the harmonic photon is equal to 16 eV. To clearly address the physics of the dip structure in harmonic spectra, we examine populations of electrons in the conduction band at this emission instant. Figure 6 shows electronic populations of the conduction band for the first-principle and first-order cases, respectively. From Figs. 1(a) and 1(b), one can find that the bandgap between two bands is exactly equal to 16 eV for the crystal momentum at k=0.6 . In Fig. 6, populations at these crystal momentums for the emission′s instant 225 a.u. are marked by the cross of dashed lines. For both cases, populations at k=0.6 with =225 a.u. are no essential difference. This means that the dip structure of the HHG spectrum is almost independent of the electronic population at the recombination instant.
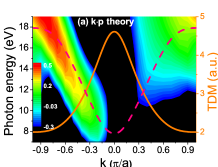
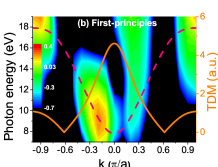
Now that we know the dip structure of the harmonic spectrum is related to the k-dependent TDM, the contribution from different crystal momentums to harmonics above the bandgap should be analyzed. Figs. 7(a) and 7(b) provide a comparison between distributions of harmonic intensities at different k from the first first-order theory and first-principle calculations, respectively. Here, in order to distinctly reveal distributions of harmonics intensities, we focus on harmonics produced at the main emission times from 200 a.u. to 250 a.u.. In the case of the real TDM from the first-principle calculations, the amplitude value of TDM near k=0.6 is close to zero as shown by the orange solid curve in Fig. 7(b), which results in no distribution of the harmonic intensity , as presented in Fig. 7(b). In the first-order theory case, TDM has bigger values near k=0.6 , which induces a clear distribution of the harmonic intensity, as observed from Fig. 7(a). Above all, it can be demonstrated that the valley shape of the TDM from the first-principle calculations results in the dip structure in the harmonic spectra.
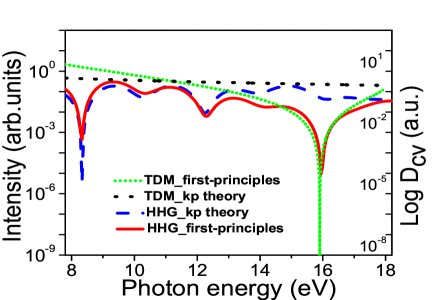
Finally, we explore dependences of amplitudes of TDMs from the first-principle calculations and the first-order theory with the bandgap, as shown by the green short-dotted and black dotted curves in Fig. 8. The corresponding harmonic spectra in both cases are also presented in Fig. 8. In the case of the first-order theory, TDM and the harmonic spectrum near 16 eV have no minimum structure. However, for the case of the first-principle calculations, the TDM′s valley at 16 eV directly coincides with the minimum of the harmonic spectrum. Thereby, we can draw a conclusion that, because the amplitude of TDM between valence and conduction bands exists zero values, harmonic spectra from MgO crystal also exhibit the Cooper minimum structure, which is similar to harmonic spectra from gaseous media.
IV SUMMARY
In conclusion, we have demonstrated that harmonic spectra of MgO crystal in the ultrashort laser pulse have the Cooper minimum structure. By comparing harmonic spectra from TDMs of the first-order theory and the first-principle calculations, it is confirmed that, the shape of TDM plays an important role in the generation of the HHG spectrum, and the valley of the real TDM from the first-principle calculations lead to the dip structure near 16 eV in the harmonic spectra from MgO crystal. More importantly, by taking the valley-dip correspondence as the benchmark, the emitted photon energy and the crystal momentum have a one-to-one match, and the intensity of the harmonic from an ultrashort laser pulse is approximately proportional to the square of the TDM’s value. Thereby, the k-dependent bandgap and TDM between valence and conduction bands are hoped to be mapped by harmonics with energies above the minimum bandgap, which will pave a new way to the all-optical reconstruction of the electronic band structure by taking advantage of the crystal HHG.
ACKNOWLEDGEMENT
The authors sincerely thank Prof. Ruifeng Lu for providing the code. J. G. Chen is supported by the National Natural Science Foundation of China under Grant No. 11975012. Project supported by the National Key R&D Program of China (Grant No. 2017YFA0403300), the National Natural Science Foundation of China (Grant Nos. 11774129, 11627807), the Jilin Provincial Research Foundation for Basic Research, China (Grant No. 20170101153JC) and the Science and Technology project of the Jilin Provincial Education Department (Grant No. JJKH20190183KJ).
References
- (1) P. Tzallas, D. Charalambidis, N. A. Papadogiannis, K. Witte, and G. D. Tsakiris, Nature , 267-271 (2003).
- (2) G. Sansone ., Science , 443-446 (2006).
- (3) E. Goulielmakis ., Science , 1614-1617 (2008).
- (4) J. G. Chen, Y. J. Yang, J. Chen, and B. B. Wang, Phys. Rev. A , 043403 (2015).
- (5) J. G. Chen, R. Q. Wang, Z. Zhai, J. Chen, P. M. Fu, B. Wang, and W. M. Liu, Phys. Rev. A , 033417 (2012).
- (6) B. Zhang, J. M. Yuan, and Z. X. Zhao, Phys. Rev. A , 035402 (2014).
- (7) X. B. Bian and A. D. Bandrauk, Phys. Rev. Lett. , 093903 (2010).
- (8) H. C. Du, S. J. Yue, H. Q. Wang, H. M. Wu, and B. T. Hu, J. Chem. Phys. , 114308 (2016).
- (9) X. L. Yuan, P. F. Wei, C. D. Liu, Z. N. Zeng, Y. H. Zheng, J. M. Jiang, X. C. Ge, and R. X. Li, Appl. Phys. Lett. , 041110 (2015).
- (10) X. S. Zhu, X. Liu, Y. Li, M. Y. Qin, Q. B. Zhang, P. F. Lan, and P. X. Lu, Phys. Rev. A , 043418 (2015).
- (11) C. D. Lin, A. T. Le, Z. Chen, T. Morishita, and R. Lucchese, J. Phys. B: At. Mol. Phys. , 122001 (2010).
- (12) H. D. Zhang, J. Guo, Y. Shi, H. Du, H. F. Liu, X. R. Huang, X. S. Liu, and J. Jing, Chin. Phys. Lett., , 014206 (2017).
- (13) X. Z. Li, H. B. Zhuo, D. B. Zou, S. J. Zhang, H. Y. Zhou, N. Zhao, Y. Lang, and D. Y. Yu, Chin. Phys. Lett. , , 094201 (2017).
- (14) P. F. Lan, P. X. Lu, W. Cao, Y. H. Li, and X. L. Wang, Phys. Rev. A , 011402 (2007).
- (15) J. P. Farrell, L. S. Spector, B. K. McFarland, P. H. Bucksbaum, M. Ghr, M. B. Gaarde, and K. J. Schafer, Phys. Rev. A , 023420 (2011).
- (16) F. Cloux, B. Fabre, and B. Pons, Phys. Rev. A , 023415 (2015).
- (17) S. B. Schoun, R. Chirla, J. Wheeler, C. Roedig, P. Agostini, L. F. DiMauro, K. J. Schafer, and M. B. Gaarde, Phys. Rev. Lett. , 153001 (2014).
- (18) J. P. Farrell, L. S. Spector, B. K. Mcfarland, P. H. Bucksbaum, M. Ghr, M. B. Gaarde, and K. J. Schafer, Phys. Rev. A , 023420 (2011).
- (19) J. Higuet, H. Ruf, N. Thir, R. Cireasa, E. Constant, E. Cormier, D. Descamps, E. Mvel, S. Petit, B. Pons, Y. Mairesse, and B. Fabre, Phys. Rev. A , 053401 (2011).
- (20) J. Higuet , J. Phys.: Conf. Ser. , 022023 (2012).
- (21) M. C. H. Wong, A. T. Le, A. F. Alharbi, A. E. Boguslavskiy, R. R. Lucchese, J. P. Brichta, C. D. Lin, and V. R. Bhardwaj, J. Phys. Rev. Lett. , 033006 (2013).
- (22) G. Vampa, T. J. Hammond, N. Thir, B. E. Schmidt, F. Lgar, C. R. McDonald, T. Brabec, D. D. Klug, and P. B. Corkum, Phys. Rev. Lett. , 193603 (2015).
- (23) V. Venkataraman, K. Saha, P. Londero, and A. L. Gaeta, Phys. Rev. Lett. , 193902 (2011).
- (24) S. Ghimire, A. D. DiChiara, E. Sistrunk, P. Agostini, L. F. DiMauro, and D. A. Reis, Nat. Phys. , 138 (2011).
- (25) G. Vampa, C. R. McDonald, G. Orlando, D. D. Klug, P. B. Corkum, and T. Brabec, Phys. Rev. Lett. , 073901 (2014).
- (26) M. Wu, S. Ghimire, D. A. Reis, K. J. Schafer, and M. B. Gaarde, Phys. Rev. A , 043839 (2015).
- (27) G. Vampa, T. J. Hammond, N. Thir, B. E. Schmidt, F. Lgar, C. R. McDonald, T. Brabec, and P. B. Corkum, Nature , 462 (2015).
- (28) G. Vampa, C. R. McDonald, G. Orlando, P. B. Corkum, and T. Brabec, Phys. Rev. B , 064302 (2015).
- (29) M. Lewenstein, Ph.Balcou, M. Yu. Ivanov, Anne LHuillier, and P. B. Corkum, Phys. Rev. A. , 2117 (1994).
- (30) S. A. Sørngård , S. I. Simonsen and J. P. Hansen, Phys. Rev. A. , 053803 (2013).
- (31) D. Dimitrovski, T. G. Pedersen, and L. B. Madsen, Phys. Rev. A. , 063420 (2017).
- (32) G. Vampa, C. McDonald, A. Fraser, and T. Brabec, IEEE Journal of Selected Topics in Quantum Electronics , 1 (2015).
- (33) S. C. Jiang, C. Yu, G. Yuan, T. Wu, Z. W. Wang, and R. F. Lu, J. Phys.: Condens. Matter , 275702 (2017).
- (34) M. S. Wismer, S. Y. Kruchinin, M. Ciappina, M. I. Stockman, and V. S. Yakovlev, Phys. Rev. Lett. , 197401 (2016).
- (35) Y. Chao, X. Zhang, S. Jiang, C. Xu, G. Yuan, W. Tong, L. Bai, and R. Lu, Phys. Rev. A , 013846 (2016).
- (36) S. C. Jiang, J. G. Chen, H. Wei, C. Yu, R. F. Lu, and C.?D. Lin, Phys. Rev. Lett. , 253201 (2018)
- (37) T. Tamaya, A. Ishikawa, T. Ogawa, and K. Tanaka, Phys. Rev. Lett. , 016601 (2016).
- (38) P. Fldi, M. G. Benedict, and V. S. Yakovlev, New J. Phys. , 063019 (2013).
- (39) D. Golde, T. Meier, and S. W. Koch, J. Opt. Soc. Am. B , 2559 (2006).
- (40) D. Golde, M. Kira, T. Meier, and S. W. Koch, Phys. Status Solidi B , 863 (2011).
- (41) S. C. Jiang, W. Hui, J. G. Chen, Y. Chao, and C. D. Lin, Phys. Rev. A , 053850 (2017).
- (42) T. T. Luu and H. J. Wrner, Phys. Rev. B , 115164 (2016).
- (43) C. Yu, S. Jiang, T. Wu, G. Yuan, Z. Wang, C. Jin, and R. Lu, Phys. Rev. B , 085439 (2018).
- (44) G. Kresse and J. Furthmller, Phys. Rev. B , 11169 (1996).
- (45) John P. Perdew, Kieron Burke, and Matthias Ernzerhof, Phys. Rev. Lett. , 3865 (1996).
- (46) Y. S. You , Opt. Lett. , 1816 (2017).
- (47) D. Golde, T. Meier, and S. W. Koch, Phys. Rev. B , 075330 (2008).
- (48) Z. Wang, H. Park, Y. H. Lai, J. Xu, C. I. Blaga, F. Yang, P. Agostini, and L. F. DiMauro, Nature Commun. , 1686 (2017).
- (49) M. X. Wu, D. A. Browne, K. J. Schafer, M. B. Gaarde, Phys. Rev. A , 063403 (2016).