Broadband Impulsive Stimulated Raman Scattering based on a Chirped Detection
Abstract
In Impulsive Stimulated Raman Scattering vibrational oscillations, coherently stimulated by a femtosecond Raman pulse, are real time monitored and read out as intensity modulations in the transmission of a temporally delayed probe pulse. Critically, in order to retrieve broadband Raman spectra, a fine sampling of the time delays between the Raman and probe pulses is required, making conventional ISRS ineffective for probing irreversible phenomena and/or weak scatterers typically demanding long acquisition times, with signal to noise ratios that crucially depend on the pulse fluences and overlap stabilities. To overcome such limitations, here we introduce Chirped based Impulsive Stimulated Raman Scattering (CISRS) technique. Specifically, we show how introducing a chirp in the probe pulse can be exploited for recording the Raman information without scanning the Raman-probe pulse delay. Then we experimentally demonstrate with a few examples how to use the introduced scheme to measure Raman spectra.
Rome] Dipartimento di Fisica, Universitá di Roma “La Sapienza", Roma, I-00185, Italy Rome] Dipartimento di Fisica, Universitá di Roma “La Sapienza", Roma, I-00185, Italy \alsoaffiliation[IIT] Istituto Italiano di Tecnologia, Center for Life Nano Science @Sapienza, Roma, I-00161, Italy Rome] Dipartimento di Fisica, Universitá di Roma “La Sapienza", Roma, I-00185, Italy Rome] Dipartimento di Fisica, Universitá di Roma “La Sapienza", Roma, I-00185, Italy \alsoaffiliation[IIT] Istituto Italiano di Tecnologia, Center for Life Nano Science @Sapienza, Roma, I-00161, Italy \abbreviationsISRS
![[Uncaptioned image]](/html/1911.12086/assets/x1.png)
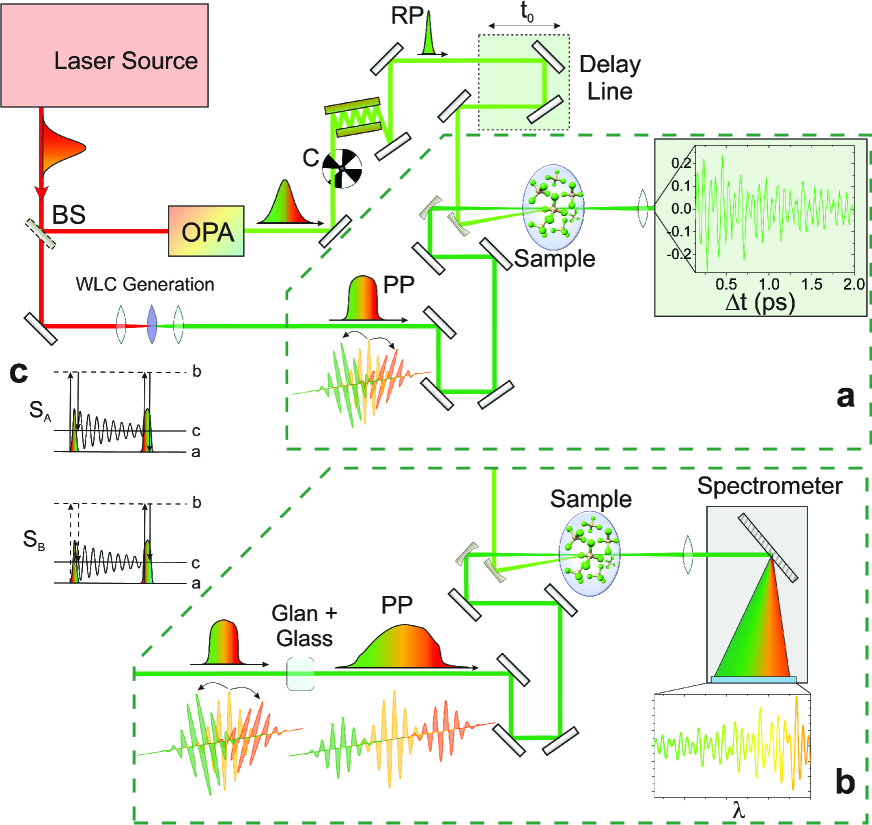
Impulsive Stimulated Raman Scattering (ISRS) is a powerful technique able to monitor in time-domain vibrational fingerprints of solid state or molecular compounds using femtosecond broadband pulses. Within the ISRS experimental scheme, two temporally separated laser fields, conventionally referred to as Raman pulse (RP) and probe pulse (PP), are exploited to stimulate and read out vibrational signatures in the system of interest 1. When the RP is shorter than the period of a normal mode, it can generate a localized wave-packet that coherently oscillates and evolves as a function of time. The photo-excited wave-packet modulates the transmissivity of the sample at the frequencies of the stimulated Raman modes, which can hence be detected by monitoring the PP transmission as a function of both temporal delay between the pulses and the probe wavelength . After Fourier transformation over , ISRS yields the Raman spectrum of the system of interest.
A sketch of the ISRS experimental layout is presented in Fig. 1a. The heterodyne detected ISRS spectra are engraved onto the highly directional PP field, efficiently suppressing both elastic and fluorescence backgrounds. For this reason, ISRS is particularly effective for probing low frequency Raman modes. Moreover, at odds with nonlinear Raman approaches in the frequency domain, such as coherent anti-Stokes Raman scattering or femtosecond stimulated Raman scattering, vibrational information retrieved in ISRS is not hampered by background signals generated by the temporal overlap of multiple pulses 2, 3. Adding an ultrashort actinic pump or tuning the Raman pulse in resonance with an electronic transition enables to trigger photochemical processes, which can then be probed with femtosecond time precision and with the structural sensitivity peculiar of Raman spectroscopy 4, 5.
During the last decade, the great potential of ISRS has been exploited for studying a broad range of phenomena, including photo-isomerization processes in retinal 6, 7, intermolecular vibrational motions in liquids 8, excited-state proton transfer in fluorescent protein 9, nuclear motions in photoreceptor proteins 10, 11, 12, singlet exciton fission in organic semiconductors 13 and polaron formation in hybrid organic-inorganic perovskites 14, 15, 16. Moreover, two-dimensional implementations of ISRS have been exploited for determining nonlinear corrections to the molecular polarizability, intramolecular vibrational anharmonicities, product-reactant correlations and solvation dynamics 17, 18, 19, 20.
Critically, at odds with frequency-domain Raman approaches, where vibrational coherences are automatically sampled over their entire dephasing time, conventional time-domain Raman protocols such as ISRS can monitor vibrational coherences only over a finite temporal window, with a maximum time delay () between RP and PP. For this reason, the ISRS lineshapes are generally affected by a limited spectral resolution . An additional drawback of ISRS is represented by the fact that the maximum resolvable (Nyquist) frequency is limited at half of the sampling frequency (): therefore accessing high frequency Raman modes typically requires long acquisition times 1. In this respect, laser fluctuations during a -scan imply signal-to-noise ratios generally lower than those obtained with frequency-domain Raman spectroscopies and for low cross section or low concentration compounds they can also overwhelm the ISRS oscillations. Finally, the multi-shot acquisition procedure required in ISRS cannot be applied for the study of irreversible processes, such as phase transition or non-reversible chemical reactions, or phenomena accompanied by sample damaging.
Optical pulses are often characterized by a chirp, i.e. a time dependence (in the carrier reference frame) of their instantaneous frequency, which is in general an unfavorable effect. It hampers, for instance, reaching the minimal time bandwidth product given by the Fourier transform limit, a critical limitation in signal transmission, time resolved spectroscopies, efficiency of non-linear processes etc. In some cases, however, it can be exploited as a useful resource. Chirp has been employed for performing high spectral resolution spectroscopy with broadbandwidth laser pulses by spectral focusing 21, 22, 23, to use an optical fiber as a time domain spectrometer 24, for enhancing vibrational signals pertaining to different electronic states 25, 26, 27, 28, up to the recent Nobel award for the amplification of optical pulses 29.
Here we build on a time-to-frequency encoding scheme based on chirp 30, 31 for measuring Raman spectra, introducing the CISRS (Chirp-based Impulsive Stimulated Raman Scattering) technique. The basic idea is to exploit a chirped probe pulse, which arrives at the sample after the RP photo-excitation, so that different probe wavelengths interact with the system of interest at different time delays, . The evolution of the stimulated vibrational coherences, encoded in the PP spectrum, is hence acquired frequency-dispersing the probe beam by a spectrometer onto a CCD device (a sketch of the experimental layout is reported in Fig. 1b and compared with the conventional ISRS scheme). Notably, the use of a frequency dispersed detection allows accessing the Raman modes which have an oscillation period much faster than the PP time duration and does not compromise the temporal resolution of the ISRS experiment 32.
The electric field of a linearly chirped PP with a carrier frequency can be expressed as , where is the square root of the PP spectrum. We define the zero of the reference temporal axis as the arrival time of the PP carrier frequency (). Considering a RP centered at - with a corresponding electric field - the relative time delay between the RP and the different probe spectral components scales as . By synthesizing the PP through super-continuum generation33, chirped white light continuum (WLC) pulses with a large spectral bandwidth are available. The chirp value can be further increased by introducing a dispersive material along the beam path and tailored in order to encode in the PP spectrum vibrational information sampled over a wider temporal windows. Another convenient way to add a large amount of chirp in the PP is to place along the PP optical path a Glan-laser polarizer, which can be also exploited for controlling the relative polarization between the Raman and probe pulses. For this reason, we used a 1 cm thick Glan-laser calcite polarizer.
In the left panel of Fig. 2 we report the CISRS signal acquired in a common solvent, namely liquid Carbon tetrachloride (), as a function of the probe frequency around the more stable PP spectral region (from 16500 to 19500 cm-1). The adimensional signal can be defined, factoring out the probe fluence, as the difference between the transmitted probe spectrum in presence () and in absence () of the RP, normalized by the probe pulse energy
| (1) |
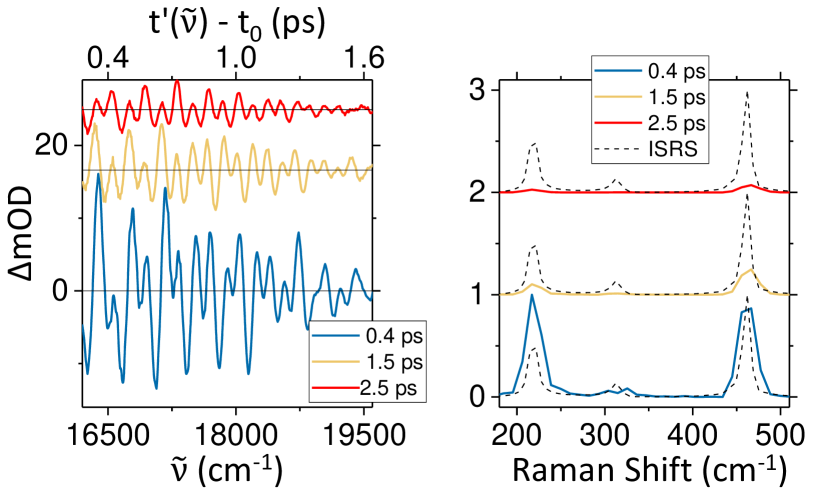
In the top axis we report the corresponding axis. Considering the 16500-19500 cm-1 PP spectral region, a 900 fs2 chirp corresponds to 1 ps of temporal window probed in a single-shot CISRS measurement. In order to further increase the monitored temporal region, we can tune the relative delay between Raman and probe pulses for acquiring additional CISRS spectra or increase the thickness of the dispersive material along the PP direction.
In the right panel of Fig. 2, the CISRS signal obtained upon Fourier transformation over is reported and compared with a a conventional ISRS experiment performed on the same sample. Critically, while the position of two Raman bands (at 219 and 460 cm-1) is in agreement with the conventional ISRS measure, the 315 cm-1 peak is not resolved. Furthermore the lineshapes and the obtained relative intensities are not in agreement with the conventional ISRS spectrum.
In order to understand the origin of such anomalous response, the expected CISRS signal can be theoretically evaluated building on a perturbative expansion of the density matrix in powers of the electric fields acting on the sample 34, 35, 36, 37, 38. In the case of non-resonant pulses, only two terms and are required to calculate the CISRS repsonse. The corresponding energy level diagrams, representing the evolution of the density matrix upon the different interaction with the RP and PP fields, are reported in Fig. 1c.
The frequency-dispersed heterodyne detected CISRS signal can be expressed as the imaginary part () of the product between the third-order polarizations induced in the sample by the RP and PP fields and the complex conjugate of the probe field , accordingly to
| (2) |
Denoting the frequency difference between the vibrational levels and as and the vibrational dephasing rate of the induced coherence as , with 34, 39, and can be expressed as
| (3) |
and
| (4) |
with
| (5) |
is a common intensity factor depending on the electronic dipole moments, with the indexes , and that indicate the energy levels reported in the diagrams of Fig. 1c. A complete derivation of the Eqs. 3-5 is reported in the Supporting Information (SI).
Considering a Gaussian RP , in the electronic off-resonant regime (with ), Eq. 5 can be recast as
We note that the common factor can be exploited to normalize the ISRS maps, in order to take into account the effect of a finite temporal duration of the RP, which impacts the ISRS response gradually reducing the Raman mode intensities upon increasing the frequency. In fact, this is done by multiplying the ISRS map for the factor .
Defining , the signal can be further simplified (the detailed derivation is reported in the SI) to
| (6) |
and
| (7) |
As expected both and oscillate at the frequency and decay with the rate. While the signal is generated by an interaction with the PP field red-shifted by one vibrational quantum -- with respect to the detected probe frequency , the contribution arises from the blue shifted component 27. Considering a fixed , the CISRS frequency resolved signals can be converted to the corresponding temporal delays . Critically, Fourier transforming or over provides a direct information on the vibrational coherence only if the PP is constant over the monitored spectral region ().
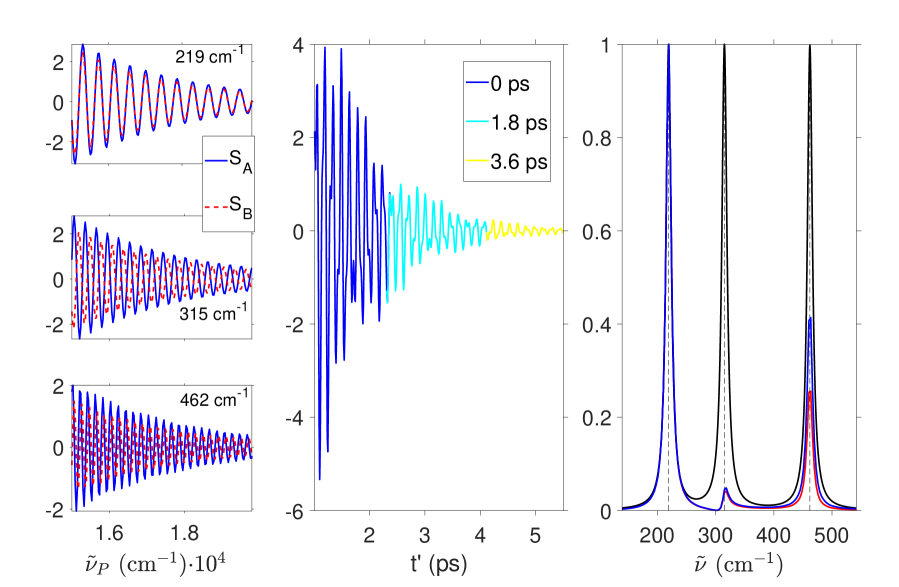
In Fig. 3 we show the signals and computed for such an ideal case, with a spectrally flat PP, using a 30 fs RP and a PP chirp = 945 fs2.
We considered a model system with three Raman active modes at frequencies 219, 315 and 462 cm-1, with equal amplitudes and the same dephasing time (1 ps).
In order to increase the effective probed temporal window, and hence the spectral resolution upon Fourier transforming (right panel), we evaluated the CISRS total response (reported in the central panel and obtained as the sum of and ) for three time delays between the Raman and the probe pulses.
Critically, as highlighted in the left panel, and can be in phase or out of phase depending on the chirp and on the Raman mode under investigation 27, 28. Specifically, considering a mode at frequency , the two signals are in phase for and are out of phase for () for a spectrally flat PP.
Therefore the amplitude of the ISRS oscillations can vary as a function of the probe wavelength also in the electronic off-resonant regime and in general the intensity of the ISRS peaks does not directly reflect the Raman cross-section.
Moreover, the broadband pulses synthesized by optical parametric amplification or supercontinuum generation are in general not spectrally flat and hence a direct conversion of the CISRS spectrally detected signal to the corresponding time delay is not valid.
For these reasons, the Raman spectrum obtained upon a direct Fourier transform of the measured CISRS signal is not effective, since specific modes under investigation can be suppressed and the Raman lineshapes can be altered.
It is worth stressing that using a non spectrally flat PP from one hand requires a more complex modeling, but from the other ensures that the destructive interference between the signals and does not cancel the vibrational response of Raman modes at :
since the amplitude of the two contributions is proportional to the intensity of the probe field at different frequencies, the and terms do not cancel each other out.
In order to correctly extract the Raman information from a spectrally dispersed CISRS trace, Eqs. 3-5 should hence be used. We note that such relations are valid not only for Gaussian pulses but hold for arbitrary RP and PP spectral profiles. Moreover, by expanding the PP phase in power of , accordingly to , the derived formalism can be exploited for taking into account higher order dispersion terms beyond then linear chirp regime, a crucial factor for a correct calibration of the arrival time of each PP component in a broad spectral range. In order to estimate for the experimental PP, we measured the temporal overlap between the different spectral component of the broadband PP and the femtosecond RP inside the sample by means of the Optical Kerr Effect (OKE) cross-correlation 40 (further details are reported in the Methods section and in the SI). In our case, we used a PP with = 837 fs2 and = 194 fs3, which correspond to a temporal window equal to ps in the considered spectral range.
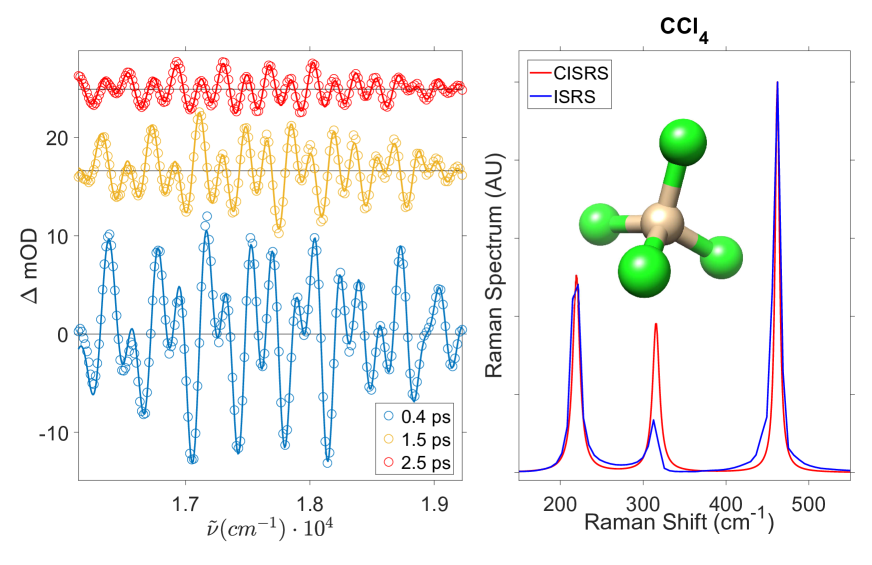
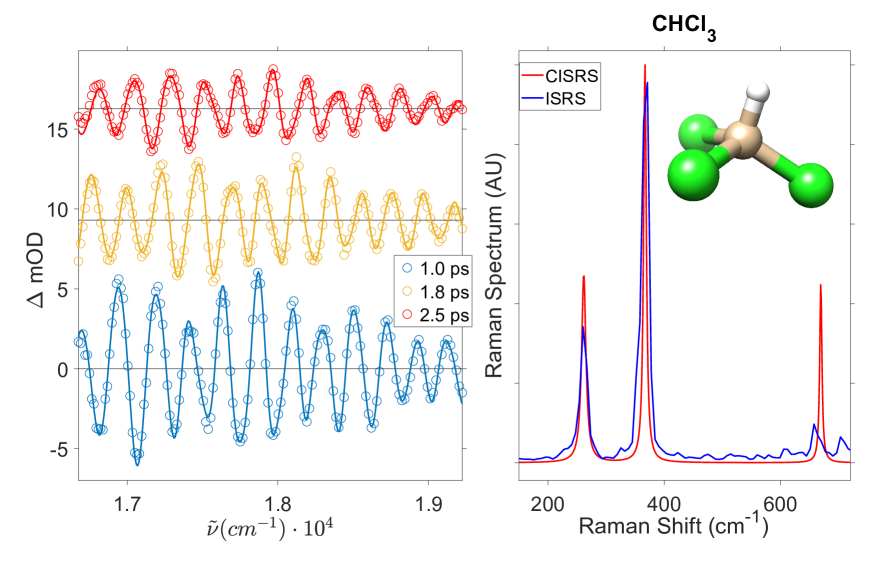
In Figs. 4 and 5 we report the CISRS traces of carbon tetrachloride and chloroform (), respectively. The experimental data (dots) are in good agreement with the signal modeled using Eqs. 3-5 (continuous lines). Specifically, Eqs. 3-5 have been exploited to fit the experimental traces in order to retrieve the matter parameters ruling the Raman scattering cross section (normal mode frequencies, dephasing times and Raman intensity), which have been reported in the right panels of Figs. 4 and 5.
The CISRS extracted spectrum is compared with the conventional ISRS signal obtained by Fourier transforming over the scanned temporal delay between the Raman and probe pulses (further details in the SI). The ISRS Raman spectrum has been corrected to take into account the finite RP time duration (30 ps).
To ensure a high spectral resolution, in the ISRS measure we used a 4 ps time-window, with a 10 fs sampling step.
The CISRS measured peak positions are 219, 315.5 and 462 cm-1 for (with corresponding measured dephasing times equal to 1, 1.1 and 1.7 ps), and
261.5, 367 and 669 cm-1 for (1.2, 1.9 and 2.3 ps measured dephasing times). All of them are in good agreement with the frequency domain spontaneous and stimulated Raman, as well as with ISRS measurements, demonstrating the CISRS capability of measuring Raman spectra with fast acquisition times.
A detailed comparison between normal peak frequencies and line-widths is reported in Table 1.
Notably, while the ISRS measurement required 400 different acquisitions for retrieving the Raman information, the CISRS was performed with only 3 steps.
Moreover, the CISRS Raman spectrum shows an improved signal-to-noise ratio with respect to the ISRS one: in fact, the fast CISRS acquisition time ensures that the measure is not affected by laser fluctuations or by beam dealignment, which on the contrary limit conventional ISRS.
We note that under the present experimental conditions, a single CISRS measurement is still able to retrieve the Raman information but with a lower spectral resolution. A convenient way to increase the such resolution for performing single-shot CISRS acquisitions is introducing additional chirp or increasing the monitored PP spectral region.
| Carbon tetrachloride | |||||
|---|---|---|---|---|---|
| Peak Position (cm-1) | FWHM (cm-1) | ||||
| CISRS | Spontaneous Raman | SRS | CISRS | Spontaneous Raman | SRS |
| 219 | 21741, 21742 | 219 | 11 | 1143 | 10 |
| 315.5 | 315.541, 31342 | 315 | 10 | 1143 | 11 |
| 462 | 45941, 45942 | 460 | 6 | 943 | 8 |
| Chloroform | |||||
| Peak Position (cm-1) | FWHM (cm-1) | ||||
| CISRS | Spontaneous Raman | SRS | CISRS | Spontaneous Raman | SRS |
| 261.5 | 26141, 26142 | 263 | 9 | 944 | 8 |
| 367 | 36341, 36642 | 367 | 6 | 544 | 4 |
| 669 | 67241, 66742 | 669 | 5 | 444 | 4 |
In Summary, we have introduced a novel experimental scheme based on the use of a broadband chirped probe pulse to record in time-domain vibrational coherences and thereby Raman spectra. In CISRS the signal measured at a given probe wavelength does not simply correspond to a contribution generated at the arrival time of the corresponding PP spectral component, but rather it results from the interference of signals generated at different time delays. Building on a perturbative expansion of the density matrix representing the matter evolution during sequential interaction with the fields, we have shown how to retrieve the Raman information encoded in the spectrally dispersed probe. At odds with conventional ISRS, the presented scheme does not require to scan the temporal delay between pump and probe pulses, ensuring acquisition times two orders of magnitude faster, with comparable or better temporal and spectral resolutions. Moreover, the chirped based scheme is not affected by pump instabilities or by beams dealignments which occurs during the time-delay scan required by conventional ISRS, ensuring improved signal-to-noise ratios. The presented scheme can be exploited for mapping the ultrafast Raman response of irreversible processes, such as phase transition, non-reversible chemical reactions or phenomena accompanied by sample damaging, where on the contrary ISRS cannot be applied. Finally, we anticipate that the chirp based detection scheme introduced here can be extended to multidimensional time domain Raman spectroscopy, representing a fast acquisition method, which simplifies the experimental design and at the same time increases the signal to noise ratios.
1 Methods
Experimental setup. The experimental setup exploited for the measurements is based on a Ti:sapphire laser source that generates 3.6 mJ, 35 fs pulses at 800 nm and 1 kHz repetition rate. The vertically polarized Raman pulse is synthesized by a non-collinear optical parametric amplifier (NOPA) that produces tunable pulses in the visible range (500-700 nm) and its compression is controlled by a pair of chirped mirrors 45. The RP energy focused on the sample is 600 nJ. The 50 nJ vertically polarized probe pulse is synthesized trough supercontinuum generation by focusing part of the source pulse on a sapphire plate and filtering the 800 nm component by means of a shortpass filter. The PP chirp can be modified by introducing glass windows of different widths along the beam path and finely tuned changing the parameters of the super continuum generation inside the sapphire crystal. A convenient way to introduce a large amount of chirp in the PP is to add along the PP path a glan-laser polarizer, which ensures at the same time a parallel polarization between all the spectral components of the probe pulse 46. Both the PP and the RP polarizations can be rotated using half-wave plates on the beam paths. The time interval between Raman and probe pulses can be controlled by an optical delay line on the Raman pulse path. A synchronized chopper blocks alternating RP pulses in order to obtain the transmitted WLC probe both in presence and in absence of the Raman excitation. Raman and probe pulses are then focused on a 500 m thick optical glass cuvette containing the or the samples. Finally, the PP is frequency dispersed by a spectrometer onto a CCD device. The OKE cross-correlation was performed for measuring the temporal overlap between the different spectral components of the PP and the RP and by means of the same experimental apparatus, with an additional glan-laser polarizer, suppressing the PP transmission in absence of the Raman pulse. For performing the frequency domain SRS measurements reported in Table 1 the femtosecond RP was replaced by a narrowband pulse ( 10 cm-1 of bandwidth centered at 596 nm), temporally overlapped with the PP inside the sample.
G.B. acknowledges the ‘Avvio alla ricerca 2018’ grant by Sapienza Universitá di Roma.
The following files are available free of charge.
-
•
OKE measure performed on for calibrating the probe chirp and the temporal delay between RP and PP; complete derivation of the and CISRS signals; conventional ISRS spectra of and ;
References
- Liebel et al. 2015 Liebel, M.; Schnedermann, C.; Wende, T.; Kukura, P. Principles and Applications of Broadband Impulsive Vibrational Spectroscopy. J. Phys. Chem. A 2015, 119, 9506–9517
- Cheng and Xie 2004 Cheng, J.-X.; Xie, X. S. Coherent Anti-Stokes Raman Scattering Microscopy: Instrumentation, Theory, and Applications. J. Phys. Chem. B 2004, 108, 827–840
- Batignani et al. 2019 Batignani, G.; Fumero, G.; Pontecorvo, E.; Ferrante, C.; Mukamel, S.; Scopigno, T. Genuine dynamics vs cross phase modulation artefacts in Femtosecond Stimulated Raman Spectroscopy. ACS Photonics 2019,
- Hamaguchi and Gustafson 1994 Hamaguchi, H.; Gustafson, T. L. Ultrafast Time-Resolved Spontaneous and Coherent Raman Spectroscopy: The Structure and Dynamics of Photogenerated Transient Species. Annu. Rev. Phys. Chem. 1994, 45, 593–622
- Baskin and Zewail 2001 Baskin, J. S.; Zewail, A. H. Freezing Atoms in Motion: Principles of Femtochemistry and Demonstration by Laser Stroboscopy. J. Chem. Educ. 2001,
- Kahan et al. 2007 Kahan, A.; Nahmias, O.; Friedman, N.; Sheves, M.; Ruhman, S. Following Photoinduced Dynamics in Bacteriorhodopsin with 7-fs Impulsive Vibrational Spectroscopy. J. Am. Chem. Soc. 2007, 129, 537–546
- Schnedermann et al. 2016 Schnedermann, C.; Muders, V.; Ehrenberg, D.; Schlesinger, R.; Kukura, P.; Heberle, J. Vibronic Dynamics of the Ultrafast all- trans to 13- cis Photoisomerization of Retinal in Channelrhodopsin-1. J. Am. Chem. Soc. 2016, 138, 4757–4762
- Ruhman et al. 1987 Ruhman, S.; Kohler, B.; Joly, A. G.; Nelson, K. A. Intermolecular vibrational motion in CS2 liquid at 165 T 300 K observed by femtosecond time-resolved impulsive stimulated scattering. Chem. Phys. Let. 1987, 141, 16–24
- Fujisawa et al. 2016 Fujisawa, T.; Kuramochi, H.; Hosoi, H.; Takeuchi, S.; Tahara, T. Role of Coherent Low-Frequency Motion in Excited-State Proton Transfer of Green Fluorescent Protein Studied by Time-Resolved Impulsive Stimulated Raman Spectroscopy. J. Am. Chem. Soc. 2016, 138, 3942–3945
- Liebel and Kukura 2013 Liebel, M.; Kukura, P. Broad-Band Impulsive Vibrational Spectroscopy of Excited Electronic States in the Time Domain. J. Phys. Chem. Lett. 2013, 4, 1358–1364
- Kuramochi et al. 2017 Kuramochi, H.; Takeuchi, S.; Yonezawa, K.; Kamikubo, H.; Kataoka, M.; Tahara, T. Probing the early stages of photoreception in photoactive yellow protein with ultrafast time-domain Raman spectroscopy. Nat. Chem. 2017, 9, 660–666
- Maiuri et al. 2018 Maiuri, M.; Ostroumov, E. E.; Saer, R. G.; Blankenship, R. E.; Scholes, G. D. Coherent wavepackets in the Fenna–Matthews–Olson complex are robust to excitonic-structure perturbations caused by mutagenesis. Nat. Chem. 2018, 10, 177–183
- Musser et al. 2015 Musser, A. J.; Liebel, M.; Schnedermann, C.; Wende, T.; Kehoe, T. B.; Rao, A.; Kukura, P. Evidence for conical intersection dynamics mediating ultrafast singlet exciton fission. Nat. Phys. 2015, 11, 352–357
- Ghosh et al. 2017 Ghosh, T.; Aharon, S.; Etgar, L.; Ruhman, S. Free Carrier Emergence and Onset of Electron–Phonon Coupling in Methylammonium Lead Halide Perovskite Films. J. Am. Chem. Soc. 2017, 139, 18262–18270
- Batignani et al. 2018 Batignani, G.; Fumero, G.; Kandada, A. R. S.; Cerullo, G.; Gandini, M.; Ferrante, C.; Petrozza, A.; Scopigno, T. Probing femtosecond lattice displacement upon photo-carrier generation in lead halide perovskite. Nat. Commun. 2018, 9
- Park et al. 2018 Park, M.; Neukirch, A. J.; Reyes-Lillo, S. E.; Lai, M.; Ellis, S. R.; Dietze, D.; Neaton, J. B.; Yang, P.; Tretiak, S.; Mathies, R. A. Excited-state vibrational dynamics toward the polaron in methylammonium lead iodide perovskite. Nat. Commun. 2018, 9
- Tanimura and Mukamel 1993 Tanimura, Y.; Mukamel, S. Two-dimensional femtosecond vibrational spectroscopy of liquids. J. Chem. Phys 1993, 99, 9496–9511
- Tokmakoff et al. 1997 Tokmakoff, A.; Lang, M. J.; Larsen, D. S.; Fleming, G. R.; Chernyak, V.; Mukamel, S. Two-Dimensional Raman Spectroscopy of Vibrational Interactions in Liquids. Phys. Rev. Lett. 1997, 79, 2702–2705
- Molesky et al. 2016 Molesky, B. P.; Guo, Z.; Cheshire, T. P.; Moran, A. M. Perspective: Two-dimensional resonance Raman spectroscopy. J. Chem. Phys 2016, 145, 180901
- Kuramochi et al. 2019 Kuramochi, H.; Takeuchi, S.; Kamikubo, H.; Kataoka, M.; Tahara, T. Fifth-order time-domain Raman spectroscopy of photoactive yellow protein for visualizing vibrational coupling in its excited state. Sci. Adv. 2019, 5
- Hellerer et al. 2004 Hellerer, T.; Enejder, A. M.; Zumbusch, A. Spectral focusing: High spectral resolution spectroscopy with broad-bandwidth laser pulses. Appl. Phys. Lett. 2004, 85, 25–27
- Rocha-Mendoza et al. 2008 Rocha-Mendoza, I.; Langbein, W.; Borri, P. Coherent anti-Stokes Raman microspectroscopy using spectral focusing with glass dispersion. Appl. Phys. Lett. 2008, 93, 201103
- Rocha-Mendoza et al. 2009 Rocha-Mendoza, I.; Langbein, W.; Watson, P.; Borri, P. Differential coherent anti-Stokes Raman scattering microscopy with linearly chirped femtosecond laser pulses. Opt. Lett. 2009, 34, 2258
- Saltarelli et al. 2018 Saltarelli, F.; Kumar, V.; Viola, D.; Crisafi, F.; Perri, A.; Cerullo, G.; Polli, D. Photonic time stretch to measure small spectral changes with broad wavelength coverage for high-speed coherent Raman microscopy (Conference Presentation). Real-time Measurements, Rogue Phenomena, and Single-Shot Applications III. 2018
- Bardeen et al. 1995 Bardeen, C. J.; Wang, Q.; Shank, C. V. Selective Excitation of Vibrational Wave Packet Motion Using Chirped Pulses. Phys. Rev. Lett. 1995, 75, 3410–3413
- Wand et al. 2010 Wand, A.; Kallush, S.; Shoshanim, O.; Bismuth, O.; Kosloff, R.; Ruhman, S. Chirp effects on impulsive vibrational spectroscopy: a multimode perspective. Phys. Chem. Chem. Phys. 2010, 12, 2149–2163
- Monacelli et al. 2017 Monacelli, L.; Batignani, G.; Fumero, G.; Ferrante, C.; Mukamel, S.; Scopigno, T. Manipulating Impulsive Stimulated Raman Spectroscopy with a Chirped Probe Pulse. J. Phys. Chem. Lett. 2017, 8, 966–974
- Gdor et al. 2017 Gdor, I.; Ghosh, T.; Lioubashevski, O.; Ruhman, S. Nonresonant Raman Effects on Femtosecond Pump–Probe with Chirped White Light: Challenges and Opportunities. J. Phys. Chem. Lett. 2017, 8, 1920–1924
- Strickland and Mourou 1985 Strickland, D.; Mourou, G. Compression of amplified chirped optical pulses. Opt. Commun. 1985, 56, 219–221
- Teo et al. 2015 Teo, S. M.; Ofori-Okai, B. K.; Werley, C. A.; Nelson, K. A. Invited Article: Single-shot THz detection techniques optimized for multidimensional THz spectroscopy. Rev. Sci. Instrum. 2015, 86, 051301
- Waldecker et al. 2015 Waldecker, L.; Miller, T. A.; Rudé, M.; Bertoni, R.; Osmond, J.; Pruneri, V.; Simpson, R. E.; Ernstorfer, R.; Wall, S. Time-domain separation of optical properties from structural transitions in resonantly bonded materials. Nat. Mater. 2015, 14, 991–995
- Polli et al. 2010 Polli, D.; Brida, D.; Mukamel, S.; Lanzani, G.; Cerullo, G. Effective temporal resolution in pump-probe spectroscopy with strongly chirped pulses. Phys. Rev. A 2010, 82, 053809
- Agrawal 2013 Agrawal, G. Nonlinear Fiber Optics; Academic Press, 2013
- Mukamel 1995 Mukamel, S. Principles of nonlinear spectroscopy; Oxford university press, 1995
- Rahav and Mukamel 2010 Rahav, S.; Mukamel, S. Ultrafast Nonlinear Optical Signals Viewed from the Molecule’s Perspective: Kramers-Heisenberg Transition-Amplitudes versus Susceptibilities. Adv. At., Mol., Opt. Phys. 2010, 59, 223–263
- Dorfman et al. 2013 Dorfman, K. E.; Fingerhut, B. P.; Mukamel, S. Time-resolved broadband Raman spectroscopies: A unified six-wave-mixing representation. J. Chem. Phys 2013, 139, 124113
- Batignani et al. 2015 Batignani, G.; Fumero, G.; Mukamel, S.; Scopigno, T. Energy flow between spectral components in 2D broadband stimulated Raman spectroscopy. Phys. Chem. Chem. Phys. 2015, 17, 10454–10461
- Batignani et al. 2016 Batignani, G.; Pontecorvo, E.; Ferrante, C.; Aschi, M.; Elles, C. G.; Scopigno, T. Visualizing Excited-State Dynamics of a Diaryl Thiophene: Femtosecond Stimulated Raman Scattering as a Probe of Conjugated Molecules. J. Phys. Chem. Lett. 2016, 7, 2981–2988
- Batignani et al. 2016 Batignani, G.; Pontecorvo, E.; Giovannetti, G.; Ferrante, C.; Fumero, G.; Scopigno, T. Electronic resonances in broadband stimulated Raman spectroscopy. Sci. Rep. 2016, 6
- McCamant et al. 2004 McCamant, D. W.; Kukura, P.; Yoon, S.; Mathies, R. A. Femtosecond broadband stimulated Raman spectroscopy: Apparatus and methods. Rev. Sci. Instrum. 2004, 75, 4971–4980
- Shimanouchi 1972 Shimanouchi, T. Tables of molecular vibrational frequencies. Consolidated volume I; National Bureau of Standards, 1972
- Marrinan and Sheppard 1954 Marrinan, H. J.; Sheppard, N. Relative Intensities of the Raman Lines of Carbon Tetrachloride, Chloroform, and Methylene Chloride. J. Opt. Soc. Am. 1954, 44, 815
- Gaynor et al. 2015 Gaynor, J. D.; Wetterer, A. M.; Cochran, R. M.; Valente, E. J.; Mayer, S. G. Vibrational Spectroscopy of the CCl4 1 Mode: Effect of Thermally Populated Vibrational States. J. Chem. Educ. 2015, 92, 1949–1952
- McCreery 2000 McCreery, R. L. Raman Spectroscopy for Chemical Analysis; John Wiley & Sons, Inc., 2000
- Zavelani-Rossi et al. 2001 Zavelani-Rossi, M.; Cerullo, G.; Silvestri, S. D.; Gallmann, L.; Matuschek, N.; Steinmeyer, G.; Keller, U.; Angelow, G.; Scheuer, V.; Tschudi, T. Pulse compression over a 170-THz bandwidth in the visible by use of only chirped mirrors. Opt. Lett. 2001, 26, 1155–1157
- Ferrante et al. 2018 Ferrante, C.; Batignani, G.; Fumero, G.; Pontecorvo, E.; Virga, A.; Montemiglio, L. C.; Cerullo, G.; Vos, M. H.; Scopigno, T. Resonant broadband stimulated Raman scattering in myoglobin. J. Raman Spectrosc. 2018,