Charge exchange emission and cold clumps in multi-phase galactic outflows
Abstract
Large-scale outflows from starburst galaxies are multi-phase, multi-component fluids. Charge-exchange lines which originate from the interfacing surface between the neutral and ionised components are a useful diagnostic of the cold dense structures in the galactic outflow. From the charge-exchange lines observed in the nearby starburst galaxy M82, we conduct surface-to-volume analyses and deduce that the cold dense clumps in its galactic outflow have flattened shapes, resembling a hamburger or a pancake morphology rather than elongated shapes. The observed filamentary H features are therefore not prime charge-exchange line emitters. They are stripped material torn from the slow moving dense clumps by the faster moving ionised fluid which are subsequently warmed and stretched into elongated shapes. Our findings are consistent with numerical simulations which have shown that cold dense clumps in galactic outflows can be compressed by ram pressure, and also progressively ablated and stripped before complete disintegration. We have shown that some clumps could survive their passage along a galactic outflow. These are advected into the circumgalactic environment, where their remnants would seed condensation of the circumgalactic medium to form new clumps. The infall of these new clumps back into the galaxy and their subsequent re-entrainment into the galactic outflow form a loop process of galactic material recycling.
keywords:
galaxies:starburst – galaxies:individual(M82) – X-rays:galaxies – ISM:structure – atomic processes1 Introduction
The Universe is mostly filled with ionised gas. However, in many astrophysical systems such as galaxies, stars, and sub-stellar objects, neutral materials are not only present but coexist with hot ionised gases. In the interfaces where neutral and ionised media meet, ions would inevitably encounter neutral atoms or molecules and the interactions between them would allow for the capture of an electron or several electrons by the ions. In this charge-exchange (CX) process, the electron-capture hosts are often in an excited state. Their subsequent de-excitation gives rise to photon emission, with the photon energy determined by the energy levels involved in the electronic transition. X-ray emission lines are produced when the emitting hosts are highly charged ions. CX emission processes are efficient, as the interaction cross-section may reach (Tawara et al., 1985; McGrath & Johnson, 1989; Greenwood et al., 2000). This is much larger than the Thomson electron-photon scattering cross-section (), which signifies common radiative processes that occur in hot astrophysical plasmas (e.g., accretion flows in compact objects and relativistic AGN jets) which generate keV X-rays. CX emission has been observed in astronomical environments ranging from sub-stellar sized objects, e.g. comets (Lisse et al., 1996; Cravens, 1997; Bodewits et al., 2007), planets (Branduardi-Raymont et al., 2004; Dennerl, 2006, 2008) and moons (Johnson & Strobel, 1982; McGrath & Johnson, 1989) to systems of galactic-scale structures and beyond, e.g. high-velocity clouds in galactic halos (Lallement, 2004), the galactic centre and the galactic ridge (Tanaka et al., 1999; Tanaka, 2002), and large-scale outflows from star-forming galaxies (Ranalli et al., 2008; Konami et al., 2011; Liu et al., 2011; Zhang et al., 2014). Although CX processes are often associated with ionised or partially ionised gases, a thermally hot medium is not always required. An example of this is the solar wind and comet interface (see Ip, 1989).
The current spectroscopic diagnoses of keV and sub-keV astrophysical plasmas are mostly based on the radiative recombination emission associated with collisional ionisation/excitation and photo-ionisation processes (see Smith et al., 2001; Ferland, 2003; Raymond, 2005; Kaastra et al., 2008; Porquet et al., 2010). Despite this, CX spectroscopy has been applied in many other disciplinary areas for decades, e.g. in confined fusion reaction and reactor studies (e.g. Isler, 1994; Ida et al., 2008; Li et al., 2016). Its use as a diagnostic tool of astrophysical plasmas outside the solar system (see Wargelin et al., 2008; Dennerl, 2010) has also recently gained attention. CX lines are now identified as a useful means by which the physical conditions in multi-phase outflows from galaxies can be probed (see Konami et al., 2011; Liu et al., 2011, 2012; Zhang et al., 2014).
Large-scale galactic outflows are characteristic of starburst galaxies (see Heckman, 2003; Veilleux et al., 2005, for reviews). They are powered by the star-forming processes in galaxies (Mathews & Baker, 1971; Chevalier & Clegg, 1985; Strickland & Stevens, 2000; Meiksin, 2016), where the frequent supernova explosions continually inject large amounts of energy into the interstellar medium (ISM).
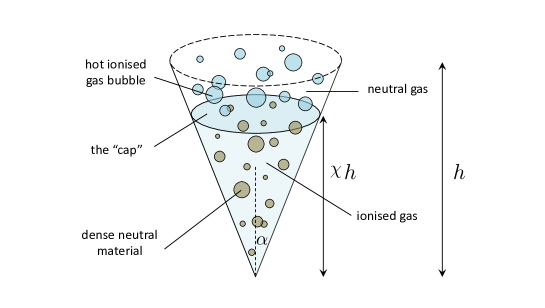
The out-of-galactic-plane outflow material emits strong continuum and line X-rays (Bregman et al., 1995; Dahlem et al., 1998; Wang et al., 2001; Strickland et al., 2004; Yamasaki et al., 2009), implying that it contains substantial hot, thermal, ionised gases. The discovery of synchrotron emission halos associated with galactic outflows in some starburst galaxies, e.g. NGC 253 (Carilli et al., 1992), also indicate the presence of energetic non-thermal electrons and cosmic rays. However, the filament-like structures in H images (see Lehnert & Heckman, 1996; Hoopes et al., 1999; Yoshida et al., 2011), suggest that warm, partially ionised gas is interwoven amongst the hot ionised keV X-ray emitting gases. Colour variations in the optical/UV emission are observed in the conic outflows (hereafter, wind cone) of galaxies (Hutton et al., 2014, 2015), which are attributed to differential extinction caused by variations in the dust properties and/or temperature inhomogeneity along the flows. There is an ionisation cap at high altitudes () of the outflow in some starburst galaxies, e.g., M82 (Devine & Bally, 1999; Tsuru et al., 2007).
Although cooling effects are arguably very significant in altering the flow dynamics in the so-called super-winds of starburst galaxies (Heckman, 2003), the thermal properties in the outflow are by no means uniform throughout (see e.g., the thermal and hydrodynamic profiles shown in Chevalier & Clegg 1985). Recombination and radiative cooling would compete with ionisation and mechanical (shock) heating in the wind cone (Hoopes et al., 2003), the transitional cap111This transitional cap is not the ionisation cap mentioned above, but a rough boundary where there is a transition between the properties of the inhomogeneities in the galactic wind cone., and the region above it. Moreover, the thermal and dynamical instabilities that subsequently develop will lead to the fragmentation of the ionised flow into ionised bubbles interspersed with cooler, denser, condensed clumps (see e.g. Strickland & Stevens, 2000; Pittard et al., 2003; Cooper et al., 2008; Fujita et al., 2009). These ionised and neutral sub-structures are entrained in the flow and continue migrating upwards (see Schwartz & Martin, 2004). As for the hot ionised bubbles, some will escape to intergalactic space where gravitational forces give way to inertial, radiative and buoyancy forces (cf. the model of bubble buoyancy in Cen A, Saxton et al., 2001), while others may be heated and evaporated as they traverse up the outflow zone. Galactic outflows are evidently complex, multi-component, multi-phase fluids (see Ohyama et al., 2002; Strickland et al., 2002; Melioli et al., 2013; Martín-Fernández et al., 2016), where hot ionised gases, warm partially ionised gases and cool neutral material intermingle as well as segregate.
While we are able to paint a broad phenomenological picture of galactic outflows, many questions regarding their finer geometries and physical properties are still waiting to be answered. For instance, what is the mass-loading of neutral material and warm gas in the hot ionised outflows? What are the filling factors of the ionised and neutral components in flows? What are the internal geometries of the neutral material and the warm gas? The answers to these questions are not only essential to determine the dynamics of the system, but they also provide insights for wider astrophysical issues such as the chemical and energy transport processes at work within galaxies, and from galaxies into intergalactic space, and the role of galactic outflows in shaping the present-day structure of our Universe.
In this work we investigate the interior geometries of multi-phase multi-component galactic outflows, utilising the information obtained from the CX spectroscopic analyses. We determine the surface area to volume ratio of ionised gas and neutral material in a flow, which characterises the strength of the CX emission, and we derive the volume partitions of neutral and ionised fluid components. We show that CX emission information together with appropriate models for the thermal and dynamical properties of the ionised gas and neutral material can strongly constrain the internal geometries of outflow regions in starburst galaxies.
We organise the paper as follows: In §2 we present a two-phase two-zone model for the outflow region from star-forming galaxies, with spherical neutral clumps entrenched in an ionised zone and spherical gas bubbles in a neutral zone, and we compute the surface-to-volume ratio of the ionised gas. In §3 we relax the model to allow ellipticity in the neutral clumps and the ionised gas bubbles and, finally, we generalise the model to consider clumps and bubbles with arbitrary aspect ratios. We compute the corresponding surface-to-volume ratios for these cases. With these ratios in-hand, we use values inferred from the charge-exchange (CX) lines observed in galactic outflows of starburst galaxies and the timescale over which condensed, neutral clumps are ablated to set constraints on the geometries and sizes of neutral clumps and their filling factors within ionised outflows. In §4 we discuss our findings in comparison to previous numerical and observational studies. We also discuss the astrophysical implications in the context of the survival of the neutral clumps in the galactic outflows and the advection of remnant neutral clumps and their stripped gas into the circumgalactic medium. In §5 we give a brief summary of our findings.
2 Two-phase two-zone model
Consider that the outflow region is conical, and is enclosed in a neutral background medium. The outflow region consists of two zones, the first being predominantly ionised, and the other being predominantly neutral. The predominantly ionised zone (hereafter the ionised zone) is located close to the galactic plane, and the predominantly neutral zone (hereafter the neutral zone) is above the ionised zone at the outskirts. Both zones are inhomogeneous. In the ionised zone, neutral clumps are entrained in an ionised flow; in the neutral zone, ionised bubbles are embedded in the neutral outflowing material.
Without losing generality we assume that the conic outflow region has a circular cross-section. The opening half-angle of the wind cone is , and the height is . The ionised zone terminates at a height , and above it lies the neutral zone. The radius of the circular surface where the two zones meet is .
2.1 Surface area to volume ratios of individual spherical clumps and bubbles
We first consider that both the dense neutral clumps in the ionised zone and the ionised bubbles in the neutral zone are spherical. The spherical assumption will be relaxed in later sections, where other shapes will be considered. In reality, the clumps and the bubbles would vary in their sizes and densities. Without losing generality, we assume that the sizes and the densities of the clumps and bubbles can be represented by some characteristic values. Then we may assign an effective radius for the neutral clumps and an effective radius for the ionised bubbles, and similarly an effective number density for the clumps and an effective number density for the bubbles. Moreover, the sizes of the neutral clumps and the ionised gas bubbles are small, with the condition generally satisfied. A schematic illustration of the two-zone wind cone model is shown in Fig. 1.
The total volume of the outflow region is , while the volumes of the ionised and neutral zones are and respectively. The total volume occupied by the ionised gas in the entire outflow is
| (1) |
and the total volume occupied by the neutral material is
| (2) |
There are four interfaces between the ionised gases and the neutral material in this configuration: (i) the interface at which the ionised zone and the neutral zone within the outflow region meet; (ii) the interface at which the ionised zone meets with the neutral material enclosing the wind cone; (iii) the interface between the ionised gas and the dense neutral clumps in the ionised zone; and (iv) the interface between the neutral material and the ionised gas bubbles in the neutral zone. If the interfacing surfaces in all these cases are smooth, the respective areas are simply , , and . Summing them gives the total surface area of the interfacing boundaries between the ionised gas and the neutral material in the outflow:
| (3) |
where the total surface area of the outflow zone is
| (4) |
Note that and are the volume filling fraction of the dense neutral clumps in the ionised zone and the volume filling fraction of the ionised gas bubbles in the neutral zone respectively. The relative enhancement of the area-to-volume ratio for the surface interfacing the ionised gases and the neutral material in the presence of spherical dense neutral clumps in the ionised zone and spherical ionised gas bubbles in the neutral zone is therefore
| (5) |
In the special case where the outflow is predominantly occupying the ionised zone (with clumps of neutral material), and
| (6) |
If the volume filling fraction of the dense neutral clumps is insignificant, i.e. (which automatically implies , although the converse is not always true), the global geometrical factor will dominate in the numerator. Then, we have
| (7) |
This recovers the result for a fully ionised outflow enveloped by a neutral ambient medium. If the volume filling fraction of the dense neutral clumps is not negligible, and if the clump sizes are sufficiently small such that , then
| (8) |
2.2 Surface area to volume ratios of individual ellipsoidal clumps and bubbles
We now relax the spherical assumption for the dense neutral clumps and ionised gas bubbles. Consider that they are ellipsoids, characterised by three semi-axes , and . The volume of these ellipsoids is simply
| (9) |
One needs to evaluate two elliptic integrals numerically to obtain the exact surface area of an ellipsoid. A simple analytical expression in terms of elementary functions is not always possible. This is impractical when extracting information from observational data where an algebraic expression of the surface area is unavailable. An approximate analytic expression with good accuracy is therefore needed. Hence, we may adopt the Thomsen formula (see Appendix A) for the surface area of ellipsoids
| (10) |
with the index . Then we obtain a surface area to volume ratio for the ellipsoids as:
| (11) |
The surface area to volume ratio of a sphere with a radius is
| (12) |
Thus, the equivalent radius of a sphere with a volume the same as that of an ellipsoid is the geometric mean of the three semi-axes of the ellipsoid, i.e.,
| (13) |
We define the ratio of the surface areas of the ellipsoid and the sphere respectively. For an ellipsoid and a sphere with the same volume,
| (14) |
The -th power of is essentially the ratio between the arithmetic mean and the geometrical mean of the reciprocals of the three semi-axes. It is always equal to or larger than 1, and is equal to one only when (i.e. a sphere). serves as a geometrical correction factor for the surface area of an object when it deviates from a spherical shape. Thus, a general formula for the enhancement of the surface area to volume ratio of the ionised material, taking into account the ellipsoid shapes of the dense neutral clumps and the ionised gas bubbles, is
| (15) |
where are the geometrical correction factors for the ellipsoidal dense neutral clumps and the ionised gas bubbles, and here and .
2.3 Effects of the aspect ratios of individual clumps and bubbles
2.3.1 Cylindrical approximation
Now consider that the clumps and bubbles have shapes with substantial aspect ratios. Here we adopt a simple approximation that the elongated and flattened clumps (hereafter filament-like and pancake-like correspondingly) and bubbles are approximated by cylinders. The height/length of the cylinder is and the cross-sectional area is (where is the radius of the cross-section). For the filament-like clumps/bubbles, ; for the pancake-like clumps/bubbles . The surface area of and the volume of of the cylinders a geometrical correction factor
| (16) |
Now consider an aspect ratio defined as
| (17) |
In terms of this aspect ratio, the geometrical correction factor is
| (18) |
with for filament-like clumps and bubbles and for pancake-like clumps and bubbles. In the limit of an extreme aspect ratio, the expression becomes
| (19) |
In the cylindrical approximation, the enhancement of the surface area to volume ratio has the same expression as that in equation 15, except that the equivalent spherical radius is now
| (20) |
for the filament-like clumps and bubbles and
| (21) |
for the pancake-like clumps and bubbles. It is interesting that, in the limit of extreme aspect ratios for the clumps or bubbles, i.e. , the factor is therefore
| (22) |
for filament-like cylindrical clumps and bubbles and
| (23) |
for pancake-like cylindrical clumps and bubbles.
2.3.2 Elongated and flattened ellipsoids
Here we consider the case where the clumps/bubbles are elongated and flattened ellipsoids. For ellipsoids with a rotational symmetry axis, the geometrical correction factor , in equation 14 obtained previously, can be expressed in terms of an aspect ratio, which is now defined as
| (24) |
In the convention , is simply . Setting gives
| (25) |
for the prolate ellipsoids, and setting yields
| (26) |
for the oblate ellipsoids. Filaments can be considered as prolate ellipsoids with , and their geometrical correction factor is therefore
| (27) |
Oblate ellipsoids with would resemble pancakes, and their geometrical correction factor is
| (28) |
The effective spherical radii of the ellipsoids are
| (29) |
with for prolate ellipsoids and for oblate ellipsoids. Hence,
| (30) |
for the ellipsoids. It is also worth noting that and for (see Appendix A), which implies that .
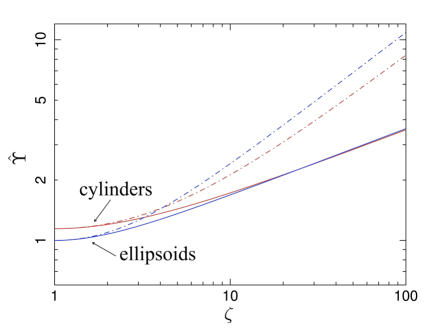
Fig. 2 shows the dependence of on for elongated and flattened clumps/bubbles modelled respectively by cylinders and ellipsoids. As expected, the ellipsoids give and the cylinders give at . In both the elongated and flattened cases, of the ellipsoids and the cylinders have the same dependencies on when the aspect ratio is sufficiently large. Moreover, the value of hardly exceeds 12, even when is as large as 100. This restricts the values for the ratios of the interfacing surface areas to the volumes between the ionised and neutral material. Nevertheless, higher surface area to volume ratios can be obtained if the interacting boundary is sufficiently rough (e.g. as would be the case with fractal structures).
Shapes with small aspect ratios may also emerge in outflows: for instance, clumps with a substantial relative speed with respect to the velocity of the outflowing plasma in which they are entrained could develop into shapes resembling a hamburger. We discuss the resulting surface area to volume ratios of such objects in Appendix B.
3 Results and discussion
The general two-zone flow model is characterised by , which takes a value between 0 and 1, with the general formula for the enhancement of the surface area to volume ratio being described by equation 15. We demonstrate our model by considering the two extreme cases in which the two-zone model reduces to a one-zone system: (1) when , in which a neutral background flow is embedded with ionised bubbles; and (2) when , in which an ionised flow is embedded with neutral clumps. A more thorough parameter study and investigation of the two-zone model (i.e. when adopting values of between 0 and 1), is left to future work.
3.1 Ionised bubbles in a neutral flow
With the surface area to volume ratio of individual neutral clumps and ionised bubbles for specific shapes determined, we are ready to calculate the enhancement of the surface area to volume ratio . The relative size of the ionised gas dominated region and the neutral material dominated region in the wind cone is specified by .
We first consider the case with in which the wind cone is one-zone, with a neutral background flow which is embedded with ionised bubbles. Putting in equation (15) gives
| (31) |
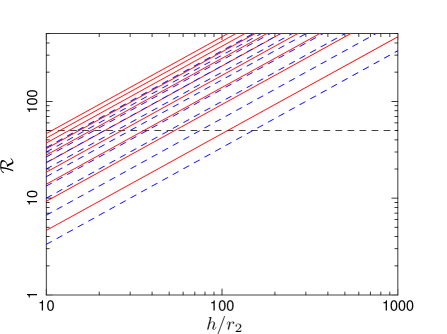
The enhancement factor thus depends only on the size () and the shape (through ) of the bubbles, when the opening angle of the wind cone is specified. Hence, it can be used to put constraints on the geometrical properties of the bubbles in a neutral outflow. For instance, in a predominantly neutral flow (i.e. with ), a value of derived from CX line spectroscopy in an observation would imply (from Fig. 3) that the effective linear size of the ionised bubbles, , relative to the height of the wind cone, , is about 1/200, provided that the bubbles are sufficiently hot so as to maintain a roughly spherical shape (cf. the value of derived for the outflow of M82 from X-ray spectroscopy in section 3.2.3). Even in the extreme case that the bubbles are compressed into a pancake shape, the effective size of the bubbles relative to the height of the wind cone would not exceed 1/10 (cf. Fig. 3). It is however unlikely that the ionised bubbles would have such an extremely flat pancake-like shape as this would require a background flow in the wind cone to have very high speeds, exceeding the thermal velocities of the ionised gas in the bubbles (i.e. ram pressure dominated), yet still maintaining a uniform flow pattern with the absence of turbulence. When , is independent of , the filling factor of the ionised gas bubbles, and hence the fractional volumes of the neutral material and the ionised gas are unconstrained by . In other words, the total mass loading in the neutral outflow embedded with ionised bubbles cannot be determined using the information obtained from CX line spectroscopy alone.
3.2 Neutral clumps in an ionised flow
3.2.1 Filling factor
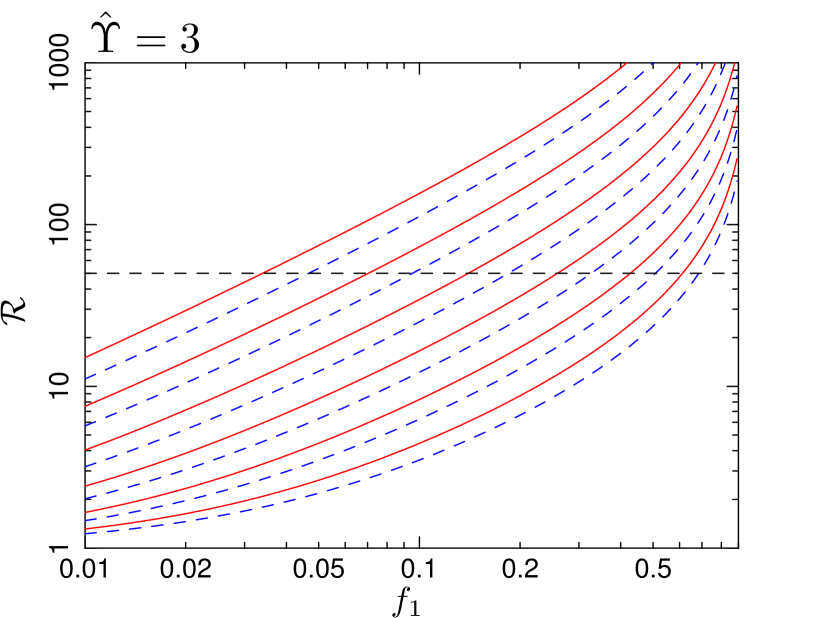
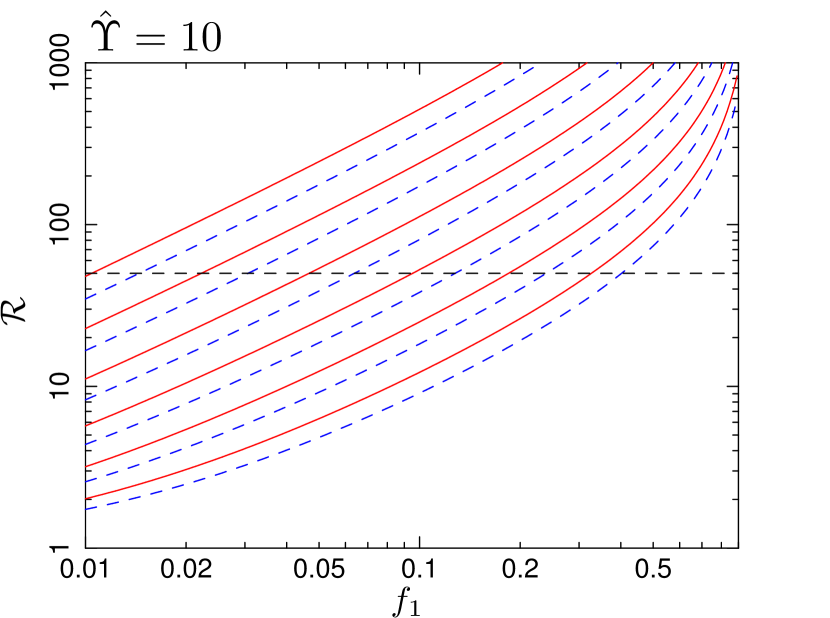
We next consider the case where , i.e. when the wind cone is one-zone, predominantly filled with ionised gas entrenched with neutral clumps. There are two kinds of interfacing surfaces between the ionised gas and the neutral material in the flow where CX emission lines could arise: (i) the boundary surface of the wind cone where the ionised gas meets the surrounding neutral material, and (ii) the surface layer of the neutral clumps carried by the flow.
By setting in equation (15), we obtain
| (32) |
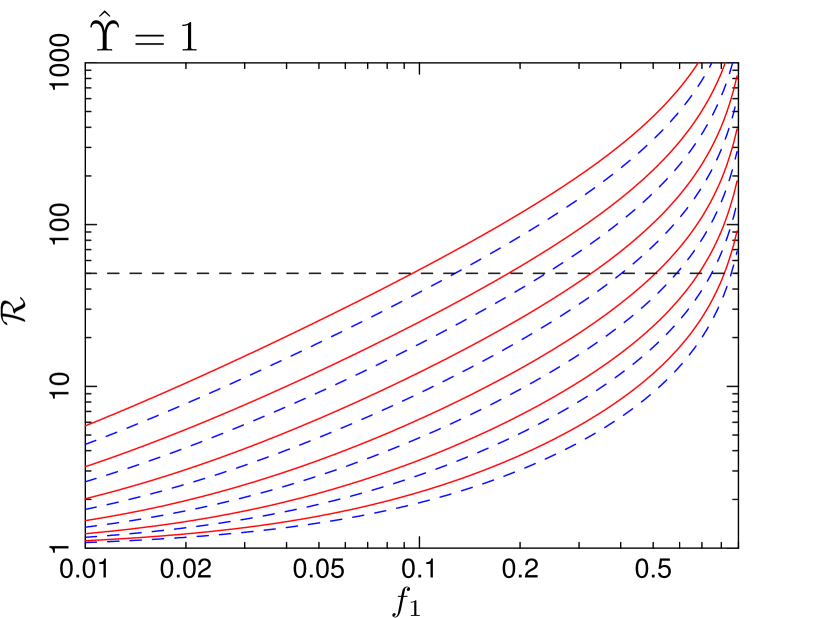
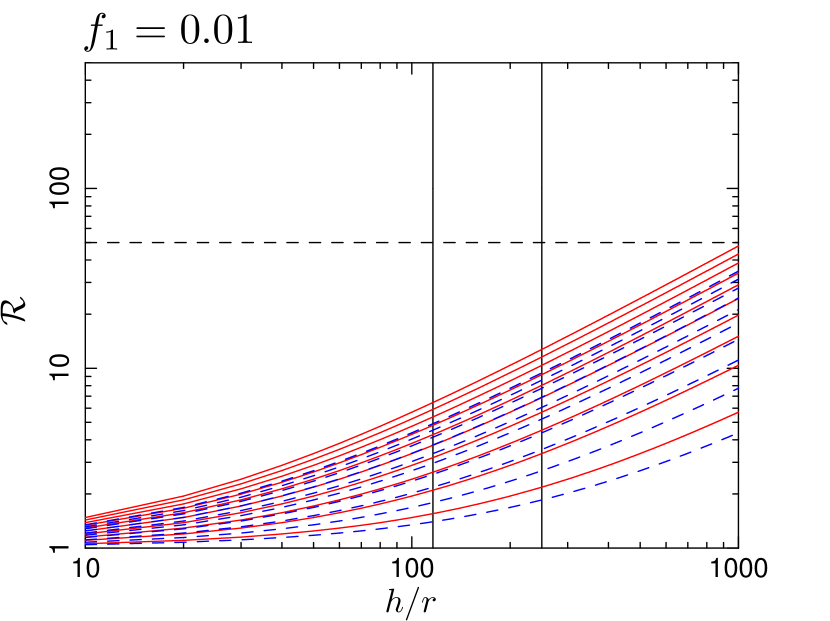
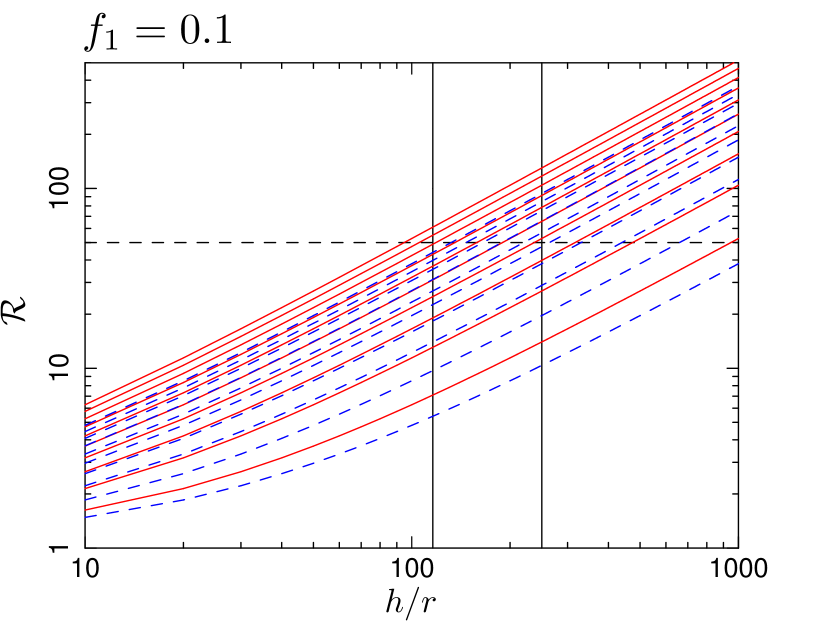
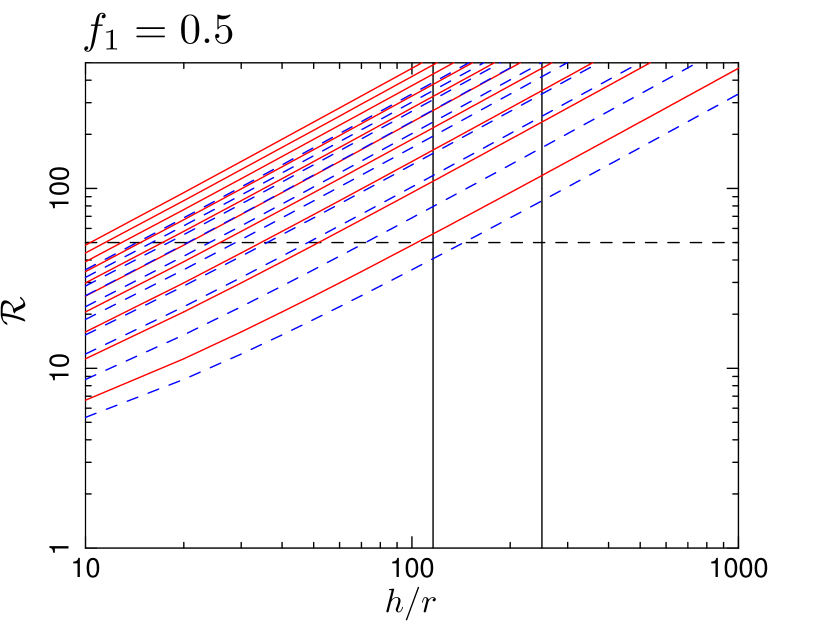
The enhancement of the surface area to volume ratio is now determined by the volume filling factor of the neutral clumps as well as their individual sizes and geometries. Fig. 4 shows as a function of , the filling factor of the neutral material in the flow for various effective linear sizes of the clumps , expressed in terms of . Three clump geometries are shown in the panels from top to bottom: spherical clumps (), filament-like and pancake-like clumps which have large aspect ratios ( and 10 respectively). Fig. 5 shows as a function of the effective linear clump size, in terms of , for various values. The panels from top to bottom correspond respectively to the cases with filling factors of , 0.1 and 0.5. The general trends shown in Fig. 4 and 5 are that either smaller effective neutral clump sizes , and/or larger values for individual clumps, will both give larger values of . Moreover, increases with the clump filling factor . An observed value of would therefore yield constraints on the clump filling factor as well as the clump geometry222 We note that, in addition to the large observational and model uncertainties in derived values of (c.f. section 3.2.3), there is some degeneracy between the shape and size of the clumps and the filling factor and their impact on . Unless these degeneracies can be broken, the constraining power of on the internal multi-phase structure on outflows may not be tightened. This issue would be exacerbated by complex (e.g. fractal-like) geometry, which may occur at the interfaces between different phases of material when Kelvin-Helmholtz and/or Rayleigh-Taylor instabilities are present in an outflow. (i.e. the effective linear size in terms of and the aspect ratio as parametrised by ).
3.2.2 Characteristic clump size
In an outflow where the filling fraction of the neutral clumps is non-negligible, the characteristic clump size can be estimated using equation 8, i.e. as:
| (33) |
where , the height of the outflow cone, and , the opening angle of the cone, can be determined by imaging observations. can be derived from the relative strength of the CX lines. The volume fraction of the ionised gas can in principle be obtained from X-ray spectroscopic measurements (assuming a sensible model for the emission process), and hence the volume filling fraction of clumps can be estimated. This gives sufficient information for the characteristic size of the neutral clumps entrenched within the ionised gas outflow to be constrained. If filament-like structures are predominant within the outflow, extreme prolate ellipsoids (or cylinders) may be used as a more suitable approximation for their morphology in the context of parametrising their surface to volume ratios. In this case, the characteristic clump size is modified according to equation 32, thus yielding
| (34) |
for which the extra parameter may be estimated from the clump morphology (prolate ellipsoids or cylinders), e.g. from infra-red (IR) emission which more directly reveals the structure of the cold material in the flow.
3.2.3 Calculating for the M82 superwind
The XMM-Newton RGS spectrum of the M82 superwind cannot be explained using an optically-thin thermal-plasma model, but a good fit can be found if CX emission is taken into account. The CX emission would contribute about one-quarter of the flux in the RGS wavelength range (630 Å), and the hot plasma would have a temperature of 0.6 keV and solar-like metal abundances (Zhang et al., 2014). Given that CX process arise at the surface of the neutral material, the observed CX component allow us to determine the effective area of the interface between the hot plasma and the neutral gas. The normalisation of the ACX model (Smith et al., 2012; Smith et al., 2014)333Also detailed online, at http://www.atomdb.org/CX/., which represents the CX component, suggests a total flux of ions onto the M82 wind’s interface area, , of
| (35) |
with a measurement uncertainty of 15%, plus an assumed 30% ACX model uncertainty. Here is the hydrogen number-density of the hot plasma, and is the relative velocity between the hot gas and neutral material.
Assuming the hot plasma to be homogeneous and has a unique interacting velocity , it follows that . The density of the hot plasma can be inferred from the normalisation of the APEC (Astrophysical Plasma Emission Code; Foster et al. 2012) model, given by
| (36) |
with an uncertainty of 20%. Here, "wc" denotes the region over which the integral is performed (i.e. the wind cone), is the volume of the ionised gas in the wind, and is the electron density (with for solar-like abundance). We set the distance to M82 (Tully et al., 2009). Without losing generality, we consider that all the ionised gas is contained by the conical outflow, which has a half-cone opening angle and a height 3 kpc, and ignore the volume filling fraction of the dense neutral material inside the ionised outflow. Then,
| (37) |
and the density of plasma is estimated to be . While the hot ionised plasma has a velocity in the outflow, the entrained cool gas was found to move substantially slower (at ; see Melioli et al. 2013). An approximation of the relative velocity is then , which is comparable to the sound speed of the hot plasma. It follows that an estimate to the total surface area of the interfacing boundaries
| (38) |
when integrated across all interfacing surfaces in the wind cone.
Along the axis of the superwind, H i was detected up to 10 kpc () toward the south and beyond 5 kpc () to the north (Martini et al., 2018)444There are indications that the northern ionised wind has broken the 3 kpc shell, and could reach as far as the 11.5 kpc ‘cap’. The wind density is low, and its contribution to the soft X-ray emission is much less than that of the southern wind (Zhang et al., 2014).. Taking this as the entire wind bi-cone, the total surface area of the ionised wind is then
| (39) |
and the total volume is
| (40) |
The relative enhancement of the area-to-volume ratio then follows as
| (41) |
The uncertainty in this value is dominated by that of the two volumes, and . The value of could therefore be off by a factor of a few, given that X-ray emission from the hot ionised gas is dominated by the southern wind cone in M82, which leads to uncertainties in the hot gas density of 50% and interfacing area of 60% (neglecting the assumed 30% ACX model uncertainty). We also note that the filling factor of the neutral clumps has been ignored in the above estimation, which in term would lead to a value of smaller than the expected value when the filling factor of the neutral clumps is considered.
4 Properties of charge-exchange line emitting clumps
4.1 Stripped gas and H filaments
CX processes take place at the boundary between the gases in the neutral and the ionised phases, and therefore CX lines carry information about how the cool neutral gas interacts with the hot ionised gas in galactic outflows. Observations have shown H emitting filamentary structures in the outflows of starburst galaxies (see e.g. the HST H images of M82 – Mutchler et al. 2007). The H trails are even more apparent in images obtained by the William Herschel Telescope (WHT)555See http://www.iac.es/telescopes/IAM/2011/73_may11_m82.jpg.html for WHT RGB + H image..
Structures are seen in the Chandra X-ray image of the M82 outflow, at 0.31.1 keV and 0.72.2 keV (Kilgard et al., 2011)666The multi-band X-ray images are also available here: http://www.chandra.harvard.edu/photo/2011/m82/.. ‘Pancake’-like morphologies were present at high flow altitudes in the 0.72.2 keV image. These X-rays were due, at least in part, to CX processes operating in the interface between ionised and neutral material in the outflow. CX lines, including those from C vi, N vi, N vii, O viii and (most importantly) O vii, are present in the 0.31.1 keV band, while O viii is present also in the 0.72.2 keV band (see Smith et al., 2012). Although spectroscopic fits to the lines in the RGS spectrum of M82 indicate multiple origins for the O vii triplet, very substantial contributions must come from the CX process.777 The line ratios of O vii triplets were found to be different at different locations in M82. If their physical origins were attributed solely to the same process, we would expect the same line ratios (see observations and discussions in Liu et al., 2012). Liu et al. 2011 estimated that CX processes contribute 90% to the O vii K triplet lines (with substantial but lower fractions for other species) in the XMM-Newton RGS spectrum (see also Liu et al., 2012).
Note that the presence of O i (63m) and C ii (158m) line emission from M82’s outflow cones suggests the presence of diffuse H i gas, i.e. cold neutral gas with temperature below , while detection of [O iii] emission (88m) would suggest this diffuse H i is interspersed with H ii regions (Leroy et al., 2015), i.e. hot ionised gas with a temperature of K or even above (see Franceschini, 2000; Contursi et al., 2013). Moreover, CO emission is also observed around M82. This comes from cold, dense molecular gas (e.g. Franceschini, 2000; Draine, 2011), so presumably, the CO emission is associated with the clumps in which the inner cores are comprised of cold gas harbouring neutral species, or species in low ionisation states. This emission is clumpy in morphology and extended along the direction of the outflow cones (Leroy et al., 2015).
Observations of other nearby starburst galaxies also show evidence of multi-phase clumpy outflows. For instance, CX X-ray emission (with a strong forbidden line in the O vii K triplet) has been detected in NGC 253, M51, M82, M61, NGC 4631 and the Antennae galaxies. There is also evidence of a combination of thermal and CX X-ray emission in M94 and NGC 2903 (Liu et al., 2012; Wang & Liu, 2012).
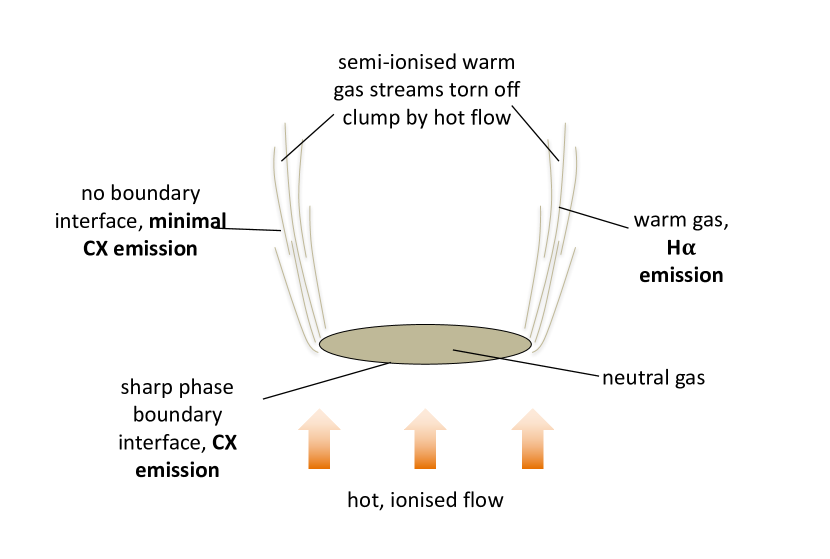
This filamentary geometry appears to contradict our deduction (from the CX lines) that the neutral clumps have flattened oblate geometries, i.e. shapes resembling a hamburger, or even a pancake. This apparent dilemma can be resolved as follows. The H filaments are not the CX line emitters. They are trails of gas torn off from neutral clumps by the fast flowing gas around them (see simulations of Suchkov et al., 1994; Cooper et al., 2008, 2009; Scannapieco & Brüggen, 2015; Banda-Barragán et al., 2016; Brüggen & Scannapieco, 2016; Banda-Barragán et al., 2018; Goldsmith & Pittard, 2018). The stripped material from the cooler CX emitting clumps, when warmed appropriately, emits H lines and appears as H filaments. Moreover, dense clumps are more likely to survive in the presence of strong irradiation in a galactic outflow environment than geometrically thin filaments – see Appendix C.
4.2 Survival of clumps
An approximate pressure balance between the gases of the neutral phase and the ionised phase implies that the neutral clumps, which are cooler, should be denser. While the ionised gases are accelerated mechanically or radiatively to form a galactic outflow, the neutral clumps (which have larger inertia) are not accelerated very efficiently. A pressure is therefore exerted on the slow-moving clumps by the faster moving ionised gas from below, causing compression of the clump material. The shear between the fast-moving ionised gas and the slow-moving clumps would also cause stripping, especially at the edges of the clumps (see the schematic illustration in Fig. 6). The stripped material naturally has a filamentary structure but is less dense than the cooler clumps. The filaments are thus thinner optically as well as geometrically.
For H emission to be produced, the material must be warm, with temperatures of around 104 K or slightly higher, but is not fully ionised. Although the filaments are not fully ionised initially, they are in direct contact with the hot ionised gas and fully exposed to the ambient radiation. The filaments are therefore heated by particle collisions, radiation from starlight and down scattered X-ray radiation of the ionised gas888 The H emission is unlikely to be caused by the CX X-rays because the ionising (UV/X-ray) continuum due to the hot gas and stellar/SN emission carries much more energy and has more photons than the CX lines. and also a certain degree of thermal conduction (see, e.g. Draine 2011 and also section 4.2.2). In contrast, the material in the inner core of a dense clump is shielded from UV radiation and soft X-rays. The timescale for conduction heating is also long compared to the galactic outflow timescale (see section 4.2.2), so a shielded clump would remain cold and will not be strong in X-ray/UV emission, or even optical. Their presence may, however, be tracked by the trails of material that is stripped from them.
A possible origin if these CX emitting clumps is the dense interstellar medium (ISM) of the galaxy entrained into the wind cone and accelerated by the flow (see e.g. Heckman et al., 1990; Cooper et al., 2008; Fujita et al., 2009; Sharma & Nath, 2012), which pushes on the lower surface of clumps999For the prescription of an outflow adopted in this model, the dominant pressure acting on these clouds is ram pressure, being around an order of magnitude greater than thermal pressure, with .. There are several possible consequences: (i) the clump is accelerated in the direction of the flow, but it traverses the outflow cone before it is transported to large altitudes; (ii) the clump is entrapped and accelerated sufficiently to become entrained in the plasma fluid; (iii) the clump is evaporated before it can penetrate sufficiently far into the outflow cone for its dynamics to be significantly affected. We shall assess each of these possibilities accordingly.
4.2.1 Acceleration and entrainment
In M82, filaments and clump-like structures move along with an outflow with velocities (see Strickland & Heckman, 2009). The CX line emitters are embedded structures in an outflow and would have similar velocities. Thus, we may assume . Consider that a clump entering the outflow is accelerated to the observed velocities of those entrained in the flow. With an initial zero upward velocity, the velocity difference between the clump and the outflowing fluid is specified by the outflow velocity alone. Without losing generality, we adopt the centre point of the range suggested for M82, i.e. setting . The fluid plasma outflow velocity is expected to rapidly reach terminal velocity at low altitudes (see e.g. Chevalier & Clegg, 1985), so the ram pressure acting on an outflow clump could be approximated as throughout the outflow cone. There would be a decrease in the rate of acceleration as the clumps evaporate (by reducing the cross-section surface), while the velocity offset between the clump and the hot surrounding gas decreases when the clumps are accelerated. These complications are not essential for the illustrative estimation here, for which only a first upper-estimate on the timescale is required. If assuming a roughly uniform acceleration, then we have , where is the mass of the clump, is the effective surface intercepting the hot outflow fluid, is the hydrogen (number) density of the gas in the clump, is the radius of the clump, and is hydrogen mass. This gives a length-scale
| (42) |
over which the clump is accelerated to velocities comparable to the observed entrained clumps, (with as the over-density of a clump compared to the density of the outflowing fluid). This corresponding acceleration arises on a timescale of
| (43) |
The high-velocity clouds (HVCs) in the Milky Way typically have velocities less than relative to the Galactic standard of rest (e.g. Wakker & van Woerden, 1991; Putman et al., 2002). If adopting the values observed for the HVCs in the Milky Way as an initial (likely upper bound) velocity of a clump passing into the outflow cone in a direction perpendicular to the flow, we would expect that the HVC would take around 10 Myr to traverse a wind cone of a width of 1 kpc. This timescale is substantially longer than the expected acceleration timescale (equation 43). The HVCs, and hence the clumps, passing into the flow would therefore have sufficient time to be accelerated, and would eventually become entrained into the flow instead of traversing across and leaving it.
4.2.2 Fate of entrained clumps
The entrained clumps (and their stripped gas) will be heated by the hot gas in the outflow and also by the ambient radiation, leading to ionisation and evaporation. For conduction the heat diffusion is expected to be most effective along the minor axis of the clumps (or the filaments), because of both the larger interfacing cross-sectional area and the shorter path from the interfacing surface to the interior core. CX requires that the neutral material has temperatures (e.g. Strickland et al., 1997; Lehnert et al., 1999). The ionised gas in the galactic outflow would have temperatures reaching (see, e.g. McKeith et al., 1995; Shopbell & Bland-Hawthorn, 1998). The timescale over which a clump (i.e. an entrained HVC) evaporates due to conduction heating is
| (44) |
(see Draine, 2011), where is in the range (e.g. Melioli et al., 2013), and is the characteristic clump cross-sectional radius along its minor axis, which is of order 10 pc.
The timescale over which clumps are pushed along the wind cone, can be estimated from their observed velocity and the length-scale of the flow, i.e.
| (45) |
Here, corresponds to the approximate scale height for the super-wind as those observed in M82 (Strickland & Heckman, 2009) Note that this parameter varies among systems (see Veilleux et al., 2005). For our adopted parameter choices, , meaning that clumps (and warm filaments) would generally evaporate and dissolve into the surrounding hot fluid before they can reach the top cap of the wind cone. Moreover, comparison with the clump acceleration timescale (equation 43) indicates that clump entrainment/acceleration would also arise on comparable timescales, i.e. with . Thus, while some clumps entering an outflow are gradually accelerated and evaporated, other dense clumps could survive for their entire passage up the flow, with the neutral gas they harbour being ultimately advected into circumgalactic space.
4.3 The circumgalactic environment
4.3.1 Cooling
The thermal cooling timescale of ionised gas is , where is the cooling rate, is the electron number density, is the electron temperature, is the charge number of ions, and is the Boltzmann constant. For ionised hydrogen in free-free cooling,
| (46) |
Thus, (equation 45) for an ionised outflow with and . The hot ionised gas will be advected into the CGM, and will eventually cool outside the host galaxy. Partially ionised gas of temperatures can be cooled more efficiently through bound-free and bound-bound cooling processes (see Sutherland & Dopita, 1993). When the temperature of the outflowing ionised gas falls below K, bound-free and bound-bound processes will become dominant. Condensation would occur in the circum-galactic environment (cf. Putman et al., 2002; Putman et al., 2003), with the surviving clump remnants as seeds for density growth. The condensates formed as such when falling back into the host galaxy, would manifest as objects similar to the HVCs that we observe in the Milky Way (Putman et al., 2012).
4.3.2 Clump infall
The loss of kinetic energy of CGM clumps causes their infall back into the host galaxy to become part of its ISM. The rate at which this happens is determined by a number of processes, in particular, (i) the ram pressure drag experienced by clumps in the CGM, which leads to their energy loss and hence orbital decay, and (ii) the collision and merging of clumps. The infall timescale is given by
| (47) |
where is the lengthscale of the CGM and is the dynamical mass of the system, which is scaled here to that of M82 (see e.g. Strickland & Heckman, 2009; Greco et al., 2012). The kinetic energy loss of a clump due to ram pressure drag will lead to a decay of its orbit. Assuming a uniform deceleration, we obtain a drag timescale of
| (48) |
(Maller & Bullock, 2004), where is the mean radius of the clump (rather than the size of the minor axis), for which we adopt a characteristic value of (Crighton et al., 2015). Here retains its earlier definition as the clump mass, is its velocity in the CGM, is the number density of the hot component of the CGM gas, and is the over-density of a clump on the CGM background. The CGM gas is slightly cooler than that of the outflow fluid, and its temperature is expected to be (Narayanan et al., 2010; Werk et al., 2013; Stocke et al., 2013; Tumlinson et al., 2017). Thus, the ram pressure drag-induced kinetic energy loss is insufficient to cause galactic outflow material to return and replenish the ISM of the host galaxy.
An alternative mechanism is clump-clump collisions. The process is stochastic, in contrast to the drag process which extracts a clump’s kinetic energy continuously. In a collision, some fraction of the kinetic energy of the colliding clumps will be transferred into turbulence, causing heating in the clump material. When the thermal energy is radiated away, it leaves a single massive remnant with a kinetic energy lower than those of its pre-merge progenitors (Maller & Bullock, 2004). The efficiency of the clump-clump collision process may be estimated as follows. The initial number of clumps (per CGM unit volume) is given by
| (49) |
where is total mass content in the neutral material in the CGM, and is the averaged mass of a single clump. It is argued that 20-30% of the dynamical mass of the host galaxy may reside in the cold, neutral component of the CGM (e.g. Maller & Bullock, 2004; Stocke et al., 2013). The neutral material is likely to be condensates, i.e. in the form of clumps, rather than being mixed-in with the ionised material101010Note that here the neutral clumps are referred to in a general context, i.e. in that they are dense condensates in the CGM. They can be formed by condensation of the CGM directly, or by condensation of the CGM seeded by the remnant clumps which have survived their passage through the galactic outflow to be advected into the circumgalactic environment, or by the recycling condensation of the galactic outflow material.. For a galaxy similar to M82, the amount of neutral gas in the CGM may therefore be (see e.g. Maller & Bullock, 2004; Stocke et al., 2013; Werk et al., 2013). Presumably, the end-state of CGM clumps after they have undergone an infall would be HVCs. The masses of the Galactic HVCs are found to be within a range of (e.g. Putman et al., 2012). Without losing generality, we assign as the characteristic mass of CGM neutral clumps. (We acknowledge these are observed to be comprised of smaller sub-structures of filaments and clouds, c.f. Putman et al. 2003; Thom et al. 2008; Hsu et al. 2011; Fox et al. 2014, also seen in M31 – Thilker et al. 2004.)
The clump-clump collisional timescale may be estimated as
| (50) |
which is shorter than the timescale for drag-induced energy loss for the parameters considered in this work. Clump-clump collisions are therefore a viable mechanism for returning the outflow material. Note that the collisional timescale estimated above is slightly longer than the timescale over which clumps are advected (cf. equation 45). An advection timescale shorter than the kinetic energy loss timescale implies a gradual building up of CGM. The accumulation of outflow material would persist until the termination of the starburst phase (hence, the cut off of the energy supply for outflow – see e.g. Chevalier & Clegg 1985 for a generic scenario and the hydrodynamics formulation). If the star formation occurs in cycles, this ejection of multi-phase clumpy ISM matter will give rise to complexity in the feedback interplay. On the one hand, the depletion of cold gas in the ISM and the advection of neutral material to the outside of the host galaxy would undoubtedly suffocate the star formation process. But, on other hand, a multi-phase outflow would provide metal-enriched material, which can be cooled more efficiently than the metal-poor pristine cosmological gas. The remnant clumps would be seeds that nucleate CGM condensation, and the subsequent infall of the newly formed CGM condensate would reignite and fuel the next phase of the star formation cycle.
4.4 Additional remarks
The large-scale galactic outflow in M82 is believed to be driven by a combination of outward thermal pressure and the coalescence of shocks and outflowing material, with power derived from an active star-forming core at the base of the wind cone. In such a setting, the hot outflow would entrain cold neutral material from the ISM which would form into clumps and filaments. In a galactic outflow with a single phase medium, an asymptotic flow velocity will develop when the energy injection by the supernova explosions is deposited into the thermal and kinetic energy of the fluid (see Chevalier & Clegg, 1985). In a multi-phase clumpy galactic outflow, a fraction of the supernova power will be dissipated for the compression of the cold neutral clumps that are entrained into the hot galactic outflow medium. Such compression has already been seen in numerical simulations and is also verified by the flattened hamburger/pancake shapes that we infer from the surface-to-volume analyses using observations of CX emission. Another fraction of the supernova power will be dissipated in the drag between the clumps and the gas in the flow, by which the clumps are accelerated (see Larson, 1974; Nath & Trentham, 1997; Veilleux et al., 2005; Bustard et al., 2016).
A single fluid formulation is therefore inadequate to model the thermodynamics and hydrodynamics of such multi-phase clumpy galactic outflows. It is needless to say that further complications would also arise due to the radiative cooling of the hot outflow medium and the additional pressure exerted by radiation and cosmic rays produced in star-forming regions at the base of the wind cone. Moreover, the entrained clumps and filaments are not stationary structures as they are subjected to mechanical ablation, i.e. stripping, by the faster-moving fluid in the surrounding and thermal evaporation by UV and X-rays permeating through the hot galactic outflow medium. In addition, clump destruction can also arise due to thermal conduction (see the discussions in sections 4.1 and 4.2.2). The material evaporated or mechanically stripped from the clumps will be pushed ahead in the flow. This is heated and stretched, forming a semi-ionised H-emitting trail. The galactic outflow is likely to be turbulent, and this would cause the filamentary trails to develop fractal-like structures rather than a well-defined interface surface on which CX process would operate in a quasi-steady manner.
The survival of the stripped material against mixing when it extends into the hot galactic outflow depends on many factors and their interplay. The dissolution of these fractal trails in a hot outflow is an important avenue of future research, given that it will strongly impact on the mass-loading of the flow, the redistribution of material in different fluid phases, the evolution of substructures, and the observational morphologies of X-ray and H emission features.
Galactic outflows in active star-forming galaxies do not necessarily take the form of a super-wind, where dense clumps and H emitting filaments are entrained within, as that of M82 (Chevalier & Clegg, 1985; Ohyama et al., 2002). In NGC 3077, a starburst dwarf neighbour of M82, bubbles and expanding shells (instead of elongated filaments) are observed (Ott et al., 2003). The bubbles consist of hot gas, and they are enclosed by a warm shell, characterised by the H emission. In terms of the two-zone model shown in Figure 1, the super-wind galactic outflows would be dominated by the bottom zone, while in the galactic outflows of NGC 3077 the bottom zone is negligible or absent. Such different multi-phase structures would have different hydrodynamic properties. These would have impacts on the entrainment of HVCs, if it happens, and the subsequent evolution of HVCs/clumps in the outflow.
In fact, the diversities of galactic outflow conditions are now recognised, and outflows from star-forming galaxies can be powered by various driving mechanisms. A galactic outflow can be driven by the radiation from an intense star-forming core in the host galaxy (Dijkstra & Loeb, 2008; Nath & Silk, 2009; Thompson et al., 2015). It has also been suggested that cosmic rays can play a very important role in regulating the energy budget of galactic outflows (Samui et al., 2010; Uhlig et al., 2012)111111At high redshifts, the favoured mechanism for driving galactic outflows is cosmic-ray pressure. Studies have argued that cosmic-ray driven outflows become increasingly important in earlier epochs (e.g. Samui et al., 2010), when host galaxy masses were presumably smaller and star-formation rates were higher during bursts.. The ability for a neutral clump to survive in a hot ionised galactic fluid, an intense radiative field or a bath of cosmic rays may depend on the metalicity and even the magnetic field in addition to the density of the clump, the outflow speed of the hot ionised gas and the length-scale of the outflow.
Ignoring magnetism for the time being, in a low-temperature outflow (e.g. in a radiatively driven system, see Zhang 2018) clump destruction is less likely to arise by thermal conduction. Instead, the abundant ionising radiation responsible for powering the outflow will cause surface evaporation of a clump, particularly on the surface facing the host galaxy, where the strong radiation is emitted from the regions with intense star formation. Outflows driven predominantly by cosmic ray pressure may also exhibit a relatively low fluid temperature in the outflow material (see e.g. Samui et al., 2010). As the energy deposition of the cosmic rays will not be concentrated at the base of the outflow cone, the gas would accelerate not only by a thermal pressure gradient but also by a cosmic ray pressure gradient, which shares some similarities to the radiative pressure. A consequence is that outflows can extend to altitudes higher than those driven purely by supernova power mechanically, reaching a few tens of kpc instead of just a few kpc (Naab & Ostriker, 2017; Jacob et al., 2018; Girichidis et al., 2018). Again, the lower temperatures reduce the amount of heat transported into clumps by means of thermal conduction, which reduces this as a means of dissolving the clumps and erasing the temperature inhomogeneities within the flow. However, the lower velocities sometimes attributed to cold cosmic ray driven outflows (e.g. Samui et al., 2010) mean that entrained clumps remain in the (much larger) outflow cone for greatly extended periods of time. This would mean that a given clump/over-density is exposed to eroding and irradiating processes for much longer than its counterparts in a supernova-driven hot outflow, which may still lead to its eventual destruction well before it has completed its passage of an outflow cone. As such, it would not be advected into the circumgalactic space, despite the less efficient heat conduction process. Cosmic rays can cause heating and ionisation in the CGM and the intergalactic medium as well as the ISM (see e.g. Owen et al., 2018), and tend to deposit their energy into dense targets. Hence the dense cores of entrained neutral clumps are more effective in capturing and absorbing the cosmic ray particles then the galactic outflow medium. The heating effect due to cosmic rays can also be enhanced if clumps are magnetised. As the energy is deposited mainly in the densest parts of clumps and/or the most strongly magnetised regions, clumps in a cosmic ray dominated flow are being pushed along by their cores (i.e. expanding ‘inside-out’ instead of compression by an external pressure force). This could stretch clumps out over time, if the magnetic fields are also stretched along the flow of ionised fluid. This will lead to the formation of extended filaments oriented along the outflow direction – in contrast to the clumps in a supernova-driven system, where pancake or hamburger shape clumps with their flattened surface oriented perpendicularly to the flow direction of a hot galactic outflow fluid. The action of different clump-flow interactions should give different surface-to-volume ratios and the interfacing surface would be accordingly marked by the strength of the CX lines in their emission spectra.
Finally, we note that in outflows with a significant magnetic energy density and turbulence, the heating/evaporation of entrained clumps in a hot outflow may be reduced (if cosmic rays are insignificant). This is because the thermal particles (usually electrons) responsible for the conduction of heat propagate predominantly along magnetic field lines. In the presence of tangled and turbulent magnetic fields, such lines increase the path that particles must travel when conducting heat, thus slowing the conduction process down (Tao, 1995; Chandran & Cowley, 1998; Malyshkin, 2001). This would operate to protect entrained clumps, enabling them to survive much longer in the outflow cone, and allowing them to persist to higher altitudes.
5 Summary and conclusions
Galactic outflows are complex multi-phase fluids, with cold dense clumps and warm filaments entrained in a hot ionised gas. CX (charge-exchange) processes are a characteristic of fluids consisting of a neutral and an ionised phase. For galactic outflows, they operate in the interface surface between neutral or partially ionised clumps and the ionised gas, and the CX processes give rise to X-ray CX emission lines. The large-scale outflows of a number of nearby starburst galaxies show a strong forbidden line in the X-ray O vii triplet (Liu et al., 2012; Wang & Liu, 2012), which are interpreted as CX lines, thus establishing the multi-phase nature of galactic outflows.
In this work, we conducted analyses of the surface-to-volume ratio of dense clumps based on observations of CX emission from starburst galaxies, and hence constrained the geometries and structures of the dense neutral material in galactic outflows. More specifically we considered the relative enhancement of the area-to-volume ratio of the dense neutral clumps with respect to spheres, and we derived the aspect ratios of these clumps from the observed strengths of CX lines, e.g. in M82 (Liu et al., 2011). Our analyses indicated that the cold dense clumps in galactic outflows such as those of M82 would have flattened shapes, resembling a hamburger or a pancake, instead of elongated shapes. The flattened geometry is consistent with the findings of numerical simulations, which show that dense clumps entrained in galactic outflows would be ram pressure compressed. Our analyses do not support an elongated geometry for the CX emission objects. Thus, the filamentary features observed in the H images of galactic outflows are not primary CX emitters. We interpret them as warm trails of the stripped material from the colder dense CX emitting clumps, which are pushed forward (after having been stripped) and stretched into filamentary structures by the faster-moving galactic outflow fluid. These filaments are exposed to the hot gas in their surroundings and intense background radiation. Though cold initially, they are gradually warmed. This is consistent with numerical studies which have shown that dense, slowly moving clumps are ablated by shear and ram pressure exerted by the fast-moving galactic outflow fluid, and the stripped material forms long trails leading the clump of their origin.
We have found that the entrainment, acceleration and evaporation/dissolution of neutral clumps in a galactic outflow occur over comparable timescales (see section 4.2.2). Thus, some fraction of the clumps, and perhaps the stripped gas filaments, can survive their entire passage through the galactic outflow to be advected into the circumgalactic space surrounding their galaxy of origin. These remnants are metal-enriched, and they are seeds for the condensation of CGM (circumgalactic medium) to form a new generation of clumps. Clump-clump collisions in circumgalactic environments would cause clump infall into the ISM of their host galaxy, as the clumps would lose a substantial fraction of their kinetic energies in a collision. These new clumps could be the origin of the HVCs (high-velocity clouds) as those observed in our Galaxy (see Putman et al., 2012). When infallen clumps are re-entrained into the galactic outflow, a recycling of galactic material is initiated.
Acknowledgements
We thank the referee for helpful comments and suggestions to improve the manuscript. KJL’s research at UCL-MSSL was supported by UCL through a MAPS Dean’s Research Studentship and by CUHK through a CN Yang Scholarship, a University Exchange Studentship, a Physics Department SURE Studentship, and a New Asia College Scholarship. ERO was supported by a UK Science and Technology Facilities Council PhD studentship. This research has made use of the SAO/NASA ADS system and the arXiv system.
References
- Arnett (1996) Arnett D., 1996, Supernovae and Nucleosynthesis: An Investigation of the History of Matter from the Big Bang to the Present
- Banda-Barragán et al. (2016) Banda-Barragán W. E., Parkin E. R., Federrath C., Crocker R. M., Bicknell G. V., 2016, MNRAS, 455, 1309
- Banda-Barragán et al. (2018) Banda-Barragán W. E., Federrath C., Crocker R. M., Bicknell G. V., 2018, MNRAS, 473, 3454
- Beard & Chuang (1987) Beard K. V., Chuang C., 1987, Journal of Atmospheric Sciences, 44, 1509
- Bodewits et al. (2007) Bodewits D., et al., 2007, A&A, 469, 1183
- Branduardi-Raymont et al. (2004) Branduardi-Raymont G., Elsner R. F., Gladstone G. R., Ramsay G., Rodriguez P., Soria R., Waite Jr. J. H., 2004, A&A, 424, 331
- Bregman et al. (1995) Bregman J. N., Schulman E., Tomisaka K., 1995, ApJ, 439, 155
- Brüggen & Scannapieco (2016) Brüggen M., Scannapieco E., 2016, ApJ, 822, 31
- Bustard et al. (2016) Bustard C., Zweibel E. G., D’Onghia E., 2016, ApJ, 819, 29
- Carilli et al. (1992) Carilli C. L., Holdaway M. A., Ho P. T. P., de Pree C. G., 1992, ApJ, 399, L59
- Chandran & Cowley (1998) Chandran B. D. G., Cowley S. C., 1998, Physical Review Letters, 80, 3077
- Chevalier & Clegg (1985) Chevalier R. A., Clegg A. W., 1985, Nature, 317, 44
- Contursi et al. (2013) Contursi A., et al., 2013, A&A, 549, A118
- Cooper et al. (2008) Cooper J. L., Bicknell G. V., Sutherland R. S., Bland-Hawthorn J., 2008, ApJ, 674, 157
- Cooper et al. (2009) Cooper J. L., Bicknell G. V., Sutherland R. S., Bland-Hawthorn J., 2009, ApJ, 703, 330
- Cravens (1997) Cravens T. E., 1997, Geophys. Res. Lett., 24, 105
- Crighton et al. (2015) Crighton N. H. M., Hennawi J. F., Simcoe R. A., Cooksey K. L., Murphy M. T., Fumagalli M., Prochaska J. X., Shanks T., 2015, MNRAS, 446, 18
- Dahlem et al. (1998) Dahlem M., Weaver K. A., Heckman T. M., 1998, ApJS, 118, 401
- Dennerl (2006) Dennerl K., 2006, Space Sci. Rev., 126, 403
- Dennerl (2008) Dennerl K., 2008, Planet. Space Sci., 56, 1414
- Dennerl (2010) Dennerl K., 2010, Space Sci. Rev., 157, 57
- Devine & Bally (1999) Devine D., Bally J., 1999, ApJ, 510, 197
- Dijkstra & Loeb (2008) Dijkstra M., Loeb A., 2008, MNRAS, 391, 457
- Draine (2011) Draine B. T., 2011, Physics of the Interstellar and Intergalactic Medium
- Dunkl & Ramirez (1994a) Dunkl C. F., Ramirez D. E., 1994a, ACM Trans. Math. Softw., 20, 413
- Dunkl & Ramirez (1994b) Dunkl C. F., Ramirez D. E., 1994b, ACM Trans. Math. Softw., 20, 427
- Ferland (2003) Ferland G. J., 2003, ARA&A, 41, 517
- Foster et al. (2012) Foster A. R., Ji L., Smith R. K., Brickhouse N. S., 2012, ApJ, 756, 128
- Fox et al. (2014) Fox A. J., et al., 2014, ApJ, 787, 147
- Franceschini (2000) Franceschini A., 2000, arXiv Astrophysics e-prints,
- Fujita et al. (2009) Fujita A., Martin C. L., Mac Low M.-M., New K. C. B., Weaver R., 2009, ApJ, 698, 693
- Girichidis et al. (2018) Girichidis P., Naab T., Hanasz M., Walch S., 2018, MNRAS, 479, 3042
- Goldsmith & Pittard (2018) Goldsmith K. J. A., Pittard J. M., 2018, MNRAS, 476, 2209
- Greco et al. (2012) Greco J. P., Martini P., Thompson T. A., 2012, ApJ, 757, 24
- Greenwood et al. (2000) Greenwood J. B., Williams I. D., Smith S. J., Chutjian A., 2000, ApJ, 533, L175
- Heckman (2003) Heckman T. M., 2003, in Avila-Reese V., Firmani C., Frenk C. S., Allen C., eds, Revista Mexicana de Astronomia y Astrofisica Conference Series Vol. 17, Revista Mexicana de Astronomia y Astrofisica Conference Series. pp 47–55
- Heckman et al. (1990) Heckman T. M., Armus L., Miley G. K., 1990, ApJS, 74, 833
- Hoopes et al. (1999) Hoopes C. G., Walterbos R. A. M., Rand R. J., 1999, ApJ, 522, 669
- Hoopes et al. (2003) Hoopes C. G., Heckman T. M., Strickland D. K., Howk J. C., 2003, ApJ, 596, L175
- Hsu et al. (2011) Hsu W.-H., Putman M. E., Heitsch F., Stanimirović S., Peek J. E. G., Clark S. E., 2011, AJ, 141, 57
- Hutton et al. (2014) Hutton S., Ferreras I., Wu K., Kuin P., Breeveld A., Yershov V., Cropper M., Page M., 2014, MNRAS, 440, 150
- Hutton et al. (2015) Hutton S., Ferreras I., Yershov V., 2015, MNRAS, 452, 1412
- Ida et al. (2008) Ida K., Sakamoto Y., Yoshinuma M., Inagaki S., Kobuchi T., Matsunaga G., Koide Y., 2008, Review of Scientific Instruments, 79, 053506
- Ip (1989) Ip W.-H., 1989, ApJ, 343, 946
- Isler (1994) Isler R. C., 1994, Plasma Physics and Controlled Fusion, 36, 171
- Jacob et al. (2018) Jacob S., Pakmor R., Simpson C. M., Springel V., Pfrommer C., 2018, MNRAS, 475, 570
- Johnson & Strobel (1982) Johnson R. E., Strobel D. F., 1982, J. Geophys. Res., 87, 10385
- Kaastra et al. (2008) Kaastra J. S., Paerels F. B. S., Durret F., Schindler S., Richter P., 2008, Space Sci. Rev., 134, 155
- Kilgard et al. (2011) Kilgard R. E., Roberts T. P., Jackson F. E., Great NASA Observatories M82 Extended Survey Team 2011, in American Astronomical Society Meeting Abstracts #217. p. 325.07
- Klamkin (1971) Klamkin M. S., 1971, The American Mathematical Monthly, 78, 280
- Konami et al. (2011) Konami S., Matsushita K., Tsuru T. G., Gandhi P., Tamagawa T., 2011, PASJ, 63, S913
- Lallement (2004) Lallement R., 2004, A&A, 422, 391
- Larson (1974) Larson R. B., 1974, MNRAS, 169, 229
- Lehner (1950) Lehner D. H., 1950, Canad. J. Math., 2, 267
- Lehnert & Heckman (1996) Lehnert M. D., Heckman T. M., 1996, ApJ, 462, 651
- Lehnert et al. (1999) Lehnert M. D., Heckman T. M., Weaver K. A., 1999, ApJ, 523, 575
- Leitherer (2005) Leitherer C., 2005, in Popescu C. C., Tuffs R. J., eds, American Institute of Physics Conference Series Vol. 761, The Spectral Energy Distributions of Gas-Rich Galaxies: Confronting Models with Data. pp 39–58 (arXiv:astro-ph/0411345), doi:10.1063/1.1913914
- Leroy et al. (2015) Leroy A. K., et al., 2015, ApJ, 814, 83
- Li et al. (2016) Li Y. Y., et al., 2016, Review of Scientific Instruments, 87, 11E501
- Lisse et al. (1996) Lisse C. M., et al., 1996, Science, 274, 205
- Liu et al. (2011) Liu J., Mao S., Wang Q. D., 2011, MNRAS, 415, L64
- Liu et al. (2012) Liu J., Wang Q. D., Mao S., 2012, MNRAS, 420, 3389
- Maller & Bullock (2004) Maller A. H., Bullock J. S., 2004, MNRAS, 355, 694
- Malyshkin (2001) Malyshkin L., 2001, ApJ, 554, 561
- Martín-Fernández et al. (2016) Martín-Fernández P., Jiménez-Vicente J., Zurita A., Mediavilla E., Castillo-Morales Á., 2016, MNRAS, 461, 6
- Martini et al. (2018) Martini P., Leroy A. K., Mangum J. G., Bolatto A., Keating K. M., Sandstrom K., Walter F., 2018, ApJ, 856, 61
- Mathews & Baker (1971) Mathews W. G., Baker J. C., 1971, ApJ, 170, 241
- McGrath & Johnson (1989) McGrath M. A., Johnson R. E., 1989, J. Geophys. Res., 94, 2677
- McKeith et al. (1995) McKeith C. D., Greve A., Downes D., Prada F., 1995, A&A, 293, 703
- Meiksin (2016) Meiksin A., 2016, MNRAS, 461, 2762
- Melioli et al. (2013) Melioli C., de Gouveia Dal Pino E. M., Geraissate F. G., 2013, MNRAS, 430, 3235
- Mutchler et al. (2007) Mutchler M., et al., 2007, Publications of the Astronomical Society of the Pacific, 119, 1
- Naab & Ostriker (2017) Naab T., Ostriker J. P., 2017, ARA&A, 55, 59
- Narayanan et al. (2010) Narayanan A., Wakker B. P., Savage B. D., Keeney B. A., Shull J. M., Stocke J. T., Sembach K. R., 2010, ApJ, 721, 960
- Nath & Silk (2009) Nath B. B., Silk J., 2009, MNRAS, 396, L90
- Nath & Trentham (1997) Nath B. B., Trentham N., 1997, MNRAS, 291, 505
- Ohyama et al. (2002) Ohyama Y., et al., 2002, PASJ, 54, 891
- Ott et al. (2003) Ott J., Martin C. L., Walter F., 2003, ApJ, 594, 776
- Owen et al. (2018) Owen E. R., Jacobsen I. B., Wu K., Surajbali P., 2018, MNRAS, 481, 666
- Pittard et al. (2003) Pittard J. M., Hartquist T. W., Ashmore I., 2003, A&A, 408, 813
- Porquet et al. (2010) Porquet D., Dubau J., Grosso N., 2010, Space Sci. Rev., 157, 103
- Putman et al. (2002) Putman M. E., et al., 2002, AJ, 123, 873
- Putman et al. (2003) Putman M. E., Staveley-Smith L., Freeman K. C., Gibson B. K., Barnes D. G., 2003, ApJ, 586, 170
- Putman et al. (2012) Putman M. E., Peek J. E. G., Joung M. R., 2012, ARA&A, 50, 491
- Ranalli et al. (2008) Ranalli P., Comastri A., Origlia L., Maiolino R., 2008, MNRAS, 386, 1464
- Raymond (2005) Raymond J. C., 2005, in Smith R., ed., American Institute of Physics Conference Series Vol. 774, X-ray Diagnostics of Astrophysical Plasmas: Theory, Experiment, and Observation. pp 15–21, doi:10.1063/1.1960909
- Rivin (2004) Rivin I., 2004, ArXiv Mathematics e-prints,
- Samui et al. (2010) Samui S., Subramanian K., Srianand R., 2010, MNRAS, 402, 2778
- Saxton et al. (2001) Saxton C. J., Sutherland R. S., Bicknell G. V., 2001, ApJ, 563, 103
- Scannapieco & Brüggen (2015) Scannapieco E., Brüggen M., 2015, ApJ, 805, 158
- Schwartz & Martin (2004) Schwartz C. M., Martin C. L., 2004, ApJ, 610, 201
- Sharma & Nath (2012) Sharma M., Nath B. B., 2012, ApJ, 750, 55
- Shopbell & Bland-Hawthorn (1998) Shopbell P. L., Bland-Hawthorn J., 1998, ApJ, 493, 129
- Smith et al. (2001) Smith R. K., Brickhouse N. S., Liedahl D. A., Raymond J. C., 2001, ApJ, 556, L91
- Smith et al. (2012) Smith R. K., Foster A. R., Brickhouse N. S., 2012, Astronomische Nachrichten, 333, 301
- Smith et al. (2014) Smith R. K., Foster A. R., Edgar R. J., Brickhouse N. S., 2014, ApJ, 787, 77
- Stocke et al. (2013) Stocke J. T., Keeney B. A., Danforth C. W., Shull J. M., Froning C. S., Green J. C., Penton S. V., Savage B. D., 2013, ApJ, 763, 148
- Strickland & Heckman (2009) Strickland D. K., Heckman T. M., 2009, ApJ, 697, 2030
- Strickland & Stevens (2000) Strickland D. K., Stevens I. R., 2000, MNRAS, 314, 511
- Strickland et al. (1997) Strickland D. K., Ponman T. J., Stevens I. R., 1997, A&A, 320, 378
- Strickland et al. (2002) Strickland D. K., Heckman T. M., Weaver K. A., Hoopes C. G., Dahlem M., 2002, ApJ, 568, 689
- Strickland et al. (2004) Strickland D. K., Heckman T. M., Colbert E. J. M., Hoopes C. G., Weaver K. A., 2004, ApJS, 151, 193
- Suchkov et al. (1994) Suchkov A. A., Balsara D. S., Heckman T. M., Leitherer C., 1994, ApJ, 430, 511
- Sutherland & Dopita (1993) Sutherland R. S., Dopita M. A., 1993, ApJS, 88, 253
- Tanaka (2002) Tanaka Y., 2002, A&A, 382, 1052
- Tanaka et al. (1999) Tanaka Y., Miyaji T., Hasinger G., 1999, Astronomische Nachrichten, 320, 181
- Tao (1995) Tao L., 1995, MNRAS, 275, 965
- Tawara et al. (1985) Tawara H., Kato T., Nakai Y., 1985, Atomic Data and Nuclear Data Tables, 32, 235
- Thilker et al. (2004) Thilker D. A., Braun R., Walterbos R. A. M., Corbelli E., Lockman F. J., Murphy E., Maddalena R., 2004, ApJ, 601, L39
- Thom et al. (2008) Thom C., Peek J. E. G., Putman M. E., Heiles C., Peek K. M. G., Wilhelm R., 2008, ApJ, 684, 364
- Thompson et al. (2015) Thompson T. A., Fabian A. C., Quataert E., Murray N., 2015, MNRAS, 449, 147
- Tsuru et al. (2007) Tsuru T. G., et al., 2007, PASJ, 59, 269
- Tully et al. (2009) Tully R. B., Rizzi L., Shaya E. J., Courtois H. M., Makarov D. I., Jacobs B. A., 2009, AJ, 138, 323
- Tumlinson et al. (2017) Tumlinson J., Peeples M. S., Werk J. K., 2017, Annual Review of Astronomy and Astrophysics, 55, 389
- Uhlig et al. (2012) Uhlig M., Pfrommer C., Sharma M., Nath B. B., Enßlin T. A., Springel V., 2012, MNRAS, 423, 2374
- Veilleux et al. (2005) Veilleux S., Cecil G., Bland-Hawthorn J., 2005, ARA&A, 43, 769
- Wakker & van Woerden (1991) Wakker B. P., van Woerden H., 1991, A&A, 250, 509
- Wang & Liu (2012) Wang Q. D., Liu J., 2012, Astronomische Nachrichten, 333, 373
- Wang et al. (2001) Wang Q. D., Immler S., Walterbos R., Lauroesch J. T., Breitschwerdt D., 2001, ApJ, 555, L99
- Wargelin et al. (2008) Wargelin B. J., Beiersdorfer P., Brown G. V., 2008, Canadian Journal of Physics, 86, 151
- Werk et al. (2013) Werk J. K., Prochaska J. X., Thom C., Tumlinson J., Tripp T. M., O’Meara J. M., Peeples M. S., 2013, ApJS, 204, 17
- Yamasaki et al. (2009) Yamasaki N. Y., Sato K., Mitsuishi I., Ohashi T., 2009, PASJ, 61, S291
- Yoshida et al. (2011) Yoshida M., Kawabata K. S., Ohyama Y., 2011, PASJ, 63, 493
- Zhang (2018) Zhang D., 2018, Galaxies, 6, 114
- Zhang et al. (2014) Zhang S., Wang Q. D., Ji L., Smith R. K., Foster A. R., Zhou X., 2014, ApJ, 794, 61
Appendix A Surfaces areas of ellipsoids
The surface area of a triaxial ellipsoid specified by the the semi-axes , and (with ) is given by
| (51) |
where , . The incomplete elliptic integrals (of the first and second kind respectively) above are defined as
| (52) |
and they do not have a closed form that can be expressed in terms of elementary functions. However, it was shown that the surface area is left- and right-bounded, with
| (53) |
(Klamkin, 1971). An approximate formula
| (54) |
with was therefore proposed by Knud Thomsen, and it can achieve a very high accuracy (less than 1.061% error).121212See http://www.numericana.com/answer/ellipsoid.htm#thomsen for detailed discussions on the subject; see also Lehner (1950); Klamkin (1971); Dunkl & Ramirez (1994a, b) and Rivin (2004) for evaluating/computing the surface areas of 3D and nD ellipsoids.
Appendix B Surface area to volume ratios of convex objects with aspect ratios close to unity
Under an approximately constant gravitational field131313 The approximation is valid when , where is the linear size of the fluid droplets and is the local gravitational potential., droplets with a relative speed with respect to a background fluid flow could develop into shapes resembling a hamburger. An example of such is the shape of raindrops in the terrestrial atmosphere. In the absence of electric stress and internal fluid circulation, the three key factors that determine the shapes of the droplets are aerodynamic pressure, hydrostatic pressure and (effective) surface tension (Beard & Chuang, 1987). Thus, if the clumps and bubbles have a non-negligible surface tension, e.g. such as that provided by some locally divergence-free internal or external magnetic fields at the interfacing surface, they would develop shapes that resemble those of the raindrops. As an approximation, we may treat a hamburger shape as a hemisphere when calculating the surface area. We can then obtain an analytical expression for the enhancement of the surface-area to volume ratio with respect to a sphere with the same volume of these raindrop-like dense neutral clumps or ionised gas bubbles:
| (55) |
which implies
| (56) |
where is the hemisphere radius and is the equivalent radius of a sphere. In fact, any convex polyhedrons with aspect ratios , will give . Thus, if dense neutral clumps and ionised gas bubbles have aspect ratios and, if their surfaces have positive curvatures everywhere, then . This implies that clumps and bubbles with these geometrical properties cannot give a surface area to volume ratio significantly larger than a simple sphere. In other words, in order to have large surface-area to volume ratios, the clumps or bubbles must have large aspect ratios, or their surfaces interfacing with the external medium cannot have positive curvatures everywhere.
Appendix C Dense clumps and H filaments
Consider a cold gas cloud consisting of mainly hydrogen and a small amount of “metal”. Let be the hydrogen number density, be the number ratio of “metal” atoms and hydrogen atoms, and be the temperature of the cloud. The cloud is bathed in an ionising radiation field, of photon number density , and the radiation will photoionise some of the material in the cloud. With the presence of co-existing ions and neutral material, CX reactions will operate, and the CX reactions will in turn compete with the photoionisation process. In a back-of-the-envelope estimation, the condition that CX dominates over photoionisation is simply
| (57) |
where is the CX cross-section, is the photoionisation cross-section, is the speed of light, and is the effective velocity of the collision between the hydrogen and metal atoms/ions.
Assuming energy equipartition for the species, we can obtain the estimates of thermal velocities of the atoms:
| (58) |
where is the Boltzmann constant. The velocity of an atomic species with an atomic mass is therefore
| (59) |
For a two-species collision, we may set the effective velocity
| (60) |
(using the centre-of-momentum frame).
Without losing generality, take all the metals as oxygen, with atomic mass . Then, we have for hydrogen and for oxygen at . Hence, the effective velocity . The atomic fraction of hydrogen is about 910,000 parts per million and that of oxygen is about 477 parts per million in the solar system (see e.g. Arnett, 1996), i.e., . The criterion for CX dominating over photoionisation is therefore
| (61) |
where . In terms of (penetrative) column density, we have
| (62) |
where is the depth for the neutral hydrogen column density, and is the reference column density.
We may take , the Kramers cross-section, that is,
| (63) |
where is the energy of the photoionisation photons, and is the effective charge of the nucleus. For a starburst galaxy similar to M82, the production rate of ionisation photons is , corresponding to a radiative power of about (see Fig.1 in Leitherer, 2005). The ionisation photon number density in its galactic outflow is roughly of the order of . In order for CX to operate efficiently, the cloud needs to have a neutral hydrogen density significantly higher than , unless the ionisation-photon number density is strongly suppressed, or alternatively, the “metal” content is anomalously high (which is unlikely). Thus, the cold dense clumps are much more favourable than the geometrically thinner, less dense and less opaque H filaments as the sites for the production of CX emission.
Note that we have used K for the velocity estimates for the atoms and ions in the dense clumps. The temperature would be higher if the free electrons, which are products of photoionisation, transfer some of their energy to the atoms and ions through collisions.
Finally, we remark on additional conditions for the survival of the H emitting filaments. Visual inspection of the images of galactic outflows, such as those in M82, indicates that filaments could have lengths of order 100 pc. Theoretical modelling of galactic outflows driven by starbursts, e.g. Chevalier & Clegg (1985), has shown the terminal speed of a flow can reach as high as . Suppose we take an initial discrepancy of, say , between the speed of a clump and the material around it. It would then take less than 1 Myr to stretch a filament to a length of 100 pc from the torn off material from the cold dense clump. Such a filament would become a H emitter if it is warmed up to K on a similar or shorter timescale. A further condition is that the filaments are not vaporised or disrupted during their warming process. This would require that the evaporation timescale and the turbulence disruption time scale of the filament be greater than 1 Myr.