Imaging the 44 AU Kuiper Belt-analogue debris ring around HD 141569A with GPI polarimetry
Abstract
We present the first polarimetric detection of the inner disk component around the pre-main sequence B9.5 star HD 141569A. Gemini Planet Imager -band (1.65m) polarimetric differential imaging reveals the highest signal-to-noise ratio detection of this ring yet attained and traces structure inwards to (28 AU at a distance of 111 pc). The radial polarized intensity image shows the east side of the disk, peaking in intensity at (44 AU) and extending out to (100 AU). There is a spiral arm-like enhancement to the south, reminiscent of the known spiral structures on the outer rings of the disk. The location of the spiral arm is coincident with 12CO J=3–2 emission detected by ALMA, and hints at a dynamically active inner circumstellar region. Our observations also show a portion of the middle dusty ring at 220 AU known from previous observations of this system. We fit the polarized -band emission with a continuum radiative transfer Mie model. Our best-fit model favors an optically thin disk with a minimum dust grain size close to the blow-out size for this system: evidence of on-going dust production in the inner reaches of the disk. The thermal emission from this model accounts for virtually all of the far-infrared and millimeter flux from the entire HD 141569A disk, in agreement with the lack of ALMA continuum and CO emission beyond 100 AU. A remaining 8–30 thermal excess a factor of 2 above our model argues for a yet-unresolved warm innermost 5–15 AU component of the disk.
1 Introduction
Debris disks are established laboratories to study planet formation and evolution. Planetesimals and infant planets interact with the dusty disk, and create gaps, asymmetries, offsets and local enhancements through various dynamical mechanisms that help infer their presence (e.g., Pictoris disk and planet, Lagage & Pantin 1994, Kalas & Jewitt 1995, Lagrange et al. 2010). Of special interest are those young disks (up to 40 Myr) transitioning between the protoplanetary disk and debris disk stage. These “hybrid disks” contain gas that can be either primordial or secondary (e.g., moor_etal17), and often show a significant deficit in near-IR or mid-IR emission, or an inner clearing in resolved images (e.g., HD 163296, doucet_etal06; 49 Ceti, Hughes et al. 2008; HD 21997, Kóspál et al. 2013). The study of hybrid disks is attractive because of the implications for gas giant planet formation and gas-dust interaction models in nascent planetary systems.
The star HD 141569A ( mag, Høg et al. 2000; mag, Cutri et al. 2003) is a well-known hybrid disk host. HD 141569A is a young Myr (Weinberger et al., 2000) B9.5V star (Jaschek & Jaschek, 1992) at a distance of pc (Gaia Collaboration et al., 2018) with (Sylvester et al., 1996) and two low mass stellar companions, and , at roughly 9″ (Weinberger et al., 2000). Early 12–100 m photometry with IRAS indicated a population of K circumstellar dust at an estimated distance of 47–60 AU (Jaschek et al., 1986; Walker & Wolstencroft, 1988).
The first high-contrast coronographic images in scattered light with HST/NICMOS at m (F160W) revealed a bright dusty disk inclined at and position angle (PA) of (Augereau et al., 1999a; Weinberger et al., 1999). Weinberger et al. (1999) reported a disk extending out to 4″ with two conspicuous nested rings peaking at 20 (220 AU) and 33 (360 AU; along the semi-major axis of the disk), separated by a -wide gap devoid of scattering material. In this work, we refer to the 220 AU and 360 AU rings as the middle and outer rings, respectively. The brighter eastern side of the system is likely nearer to us under the assumption of preferentially forward scattering by dust (Weinberger et al., 1999). Subsequently, HST optical coronagraphic observations with STIS (365–806 µm, 50CCD; Mouillet et al., 2001) and with ACS at 430 nm (F435W), 590 nm (F606W) and 830 nm (F814W; Clampin et al., 2003) revealed asymmetries, and two prominent tightly wound spiral substructures: an inner arm between – (200 AU–240 AU) and an outer broad ring at 3–0 (330 AU–440 AU). In a new analysis of archival Gemini/NICI and HST/NICMOS data, Mazoyer et al. (2016) report a split in two fine rings in the eastern part of the disk and show that the ring shows a small 003 offset relative to the central star.
Marsh et al. (2002) were the first to suggest a peak in the dust optical depth inwards of AU from mid-IR imaging with Keck/MIRLIN (Ressler et al., 1994). High-contrast coronagraphic observations in the near-IR with VLT/SPHERE further revealed the presence of a third inner ring at AU (Perrot et al., 2016). This resolved inner disk component is also seen as an arc-like rim by Konishi et al. (2016) in optical broadband light with HST/STIS, and marginally detected by Currie et al. (2016) with Keck/NIRC2 at L. Mawet et al. (2017) confirm the detection of the inner disk component around HD 141569A in L-band scattered light with a vortex coronagraph in Keck/NIRC2. The combination of optical/near-IR scattered light and 870m/2.9 mm ALMA observations (White et al., 2016, 2018) limit the outer radius of the inner disk to 55 AU.
HD141559A is also known to be a gas-rich disk on large scales, with a total estimated mass in the 13–200 (0.39–) range (Zuckerman et al., 1995; Jonkheid et al., 2006; Thi et al., 2014; Flaherty et al., 2016). CO ro-vibrational emission lines trace the existence of the gas between 17–500 AU (Brittain et al., 2003; Goto et al., 2006; Flaherty et al., 2016; White et al., 2016). However, spatially-resolved ALMA 12CO () observations reveal that the 210 AU region of the disk may contain only a fraction, 1.5 (), of this gas mass (White et al., 2016), and that the inner 50 AU hold only tenuous amounts of CO gas.
We present the first -band polarimetric observations of the inner disk of HD 141569A (Section 2). We use polarimetric differential imaging (PDI) with the Gemini Planet Imager (GPI, Macintosh et al., 2014). PDI excels in high-contrast sensitivity to polarized circumstellar emission, as it eliminates the need of further PSF subtraction that can hamper the detection of extended emission. Our PDI observations resolve the inner disk into a ring with polarized intensity peaking at 44 AU and extending inwards to 025 (28 AU; Section 3). We model the linear polarized intensity image to derive the physical parameters of the disk (Section 4). We also compare the predicted thermal emission from our best-fit model against the SED assembled from previous studies (Section 5). We present our conclusions in Section 6.
2 Observations and Data Reduction
We observed HD 141569A on 2014 March 22 UT in polarimetry mode at band during GPI commissioning at the Gemini South Telescope. We acquired 50 frames of 60 seconds each over of parallactic field rotation at an average airmass of 1.12. Between each observation the half wave plate (HWP) modulator was rotated in 22.5∘ steps. The HWP introduces modulation in the signal and thereby allows for reconstruction of the Stokes vector later in the reduction steps. During these observations, the average Gemini Differential Image Motion Monitor (DIMM) seeing at Cerro Pachón was 070.
We reduced the data with the GPI Data Reduction Pipeline (GPI DRP; Maire et al., 2014; Perrin et al., 2014) following the procedure described in Perrin et al. (2015) and Millar-Blanchaer et al. (2015). This starts with dark subtraction, correction for instrument flexure, microphonics noise, and bad pixels. Each frame is then assembled into a polarization datacube, where the third dimension comprises two image slices, each containing one of the two orthogonal polarization states yielded by the Wollaston prism analyzer. Each datacube is divided by a Gemini Facility Calibration Unit (GCAL) flat field, for throughput correction across the field. We correct for instrumental polarization as outlined in Millar-Blanchaer et al. (2015).
The position of the central star is determined using GPI’s four fiducial satellite spots (Wang et al., 2014). In broad-band images the satellite spots are smeared radially outwards from the central star and form bright elongated streaks that can be used to estimate the location of the obscured star (Pueyo et al., 2015). Following Wang et al. (2014), we use a technique that implements a Radon transform of the flux distribution in each polarized image to compute the line integral over all lines passing through an initial guess for the position of the star. We sum the squares of all line integrals, and repeat the procedure for the next guess for the stellar position within a small search box. The point within the search box that contains the most light pointing towards it corresponds to the stellar position. This way, we attain the position of the obscured central star to 1 mas precision (Wang et al., 2014). We then perform a double differencing between the two polarization states to correct for non-common path errors (Perrin et al., 2015).
We use the series of differenced datacubes obtained at different HWP angles to construct a single Stokes datacube, the 2D slices of which hold the total intensity, linear and circular polarization information for the entire observation sequence. The details of this procedure are presented in Appendix B.2 of Perrin et al. (2015). Because GPI’s HWP is not exactly one half wave at all wavelengths, GPI is only weakly sensitive to circular polarization, Stokes . Thus we disregard the Stokes cube slice. Afterwards, following Schmid et al. (2006), the Stokes cube was transformed into the radial Stokes convention . In this formalism, positive values of Stokes represent linear polarization perpendicular to the radial direction from the star, while negative values represent polarization parallel to the radial direction. For Rayleigh-like scatterers in an optically thin debris disk, no flux is expected in the Stokes image as only the perpendicular macroscopic polarization state (azimuthal polarization) prevails (Millar-Blanchaer et al., 2015). Thus, light from single scattering events by dust grains will lead to positive values in Stokes . However, we note that multiple scattering in optically thick disks could have a Stokes signal of a few percent of the Stokes signal (Canovas et al., 2015), which is below the sensitivity of our observations.
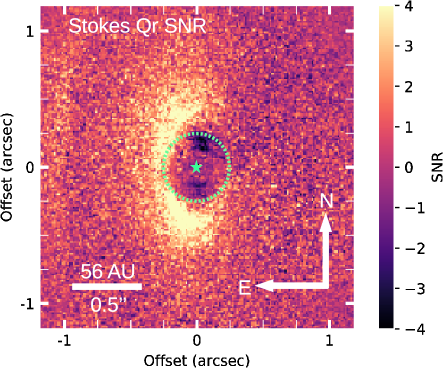
Our final reduction step it to flux-calibrate the data. Following the procedure outlined in Hung et al. (2016), and adopting Jy as the band flux of HD 141569A from 2MASS (Cutri et al., 2003), we obtain a conversion factor of Jy ADU-1 coadd-1. The final and images are shown in Figure 1, and an SNR map of the image is shown in Figure 2.
In addition to the Stokes image, we also reduced the total intensity image (Stokes slice) for the entire sequence with pyKLIP (Wang et al., 2015) which implements the Karhunen-Loève Image Projection algorithm (KLIP, Soummer et al., 2012) for optimal PSF subtraction. That reduced image is shown in Figure 3.
Immediately after the polarimetry sequence was completed we also acquired integral field spectroscopic (IFS; non-polarimetric) observations of HD 141569A with GPI in the band. The IFS data contain an independent measurement of the total intensity flux from the disk. The sequence comprised 32 frames of 60 seconds each. The sequence started at an airmass of 1.13, with an average Gemini DIMM seeing of 101 and of cumulative field rotation. We reduced the data and assembled the spectral datacubes with the standard recipes provided in the GPI DRP. The entire reduced dataset was then processed with pyKLIP. However, unlike our polarimetric observations, this shorter IFS sequence did not reveal the disk, and is not shown here.
3 Results
We present the imaging results in polarized and total intensity in Section 3.1 and 3.2, respectively. We revisit these further in Sections 5.1-5.2 in the context of previous observations and a scattered-light model of the disk (Section 4).
3.1 Polarized Intensity H-band Image
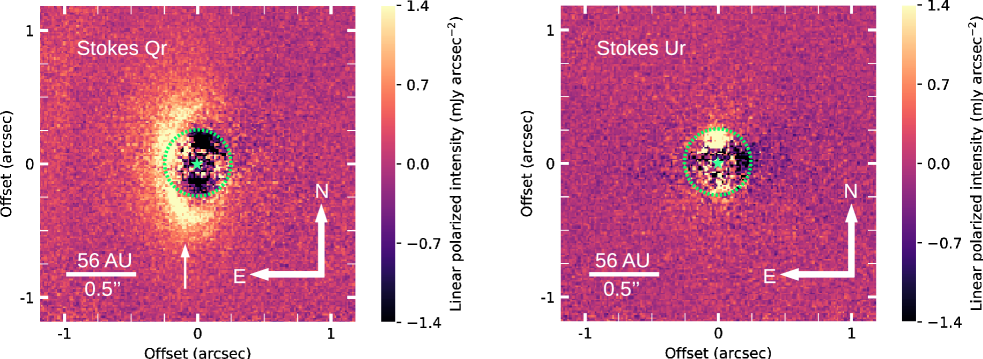
The -band Stokes image in Figure 1 shows the first polarized light detection of the HD 141569A inner disk. We clearly resolve the eastern portion of the disk: likely the result of predominantly forward scattering by micron-size dust grains. This is dictated by the combined effects of phase function and polarization dependence with scattering angle. Most known dust compositions preferentially scatter light in the forward direction for dust particles a few times larger than the wavelength of the scattered light (van de Hulst, 1957). For such particles, optically-thin Mie models also suggest that polarized intensity curves peak at scattering angles (Perrin et al., 2015).
The emission peaks to the east at a semi-major axis of (44 AU) and extends out to (100 AU), where it blends into the background. At to the east the Stokes surface brightness increases again revealing the previously detected middle dusty ring at AU. The clearing between the inner disk and the middle ring indicates a region deficient in scattering material, assuming that the disk is optically thin.
The western part of the Stokes image shows no significant emission. We set a one-sigma lower limit of 4.0 on the ratio of forward to backward scattering in polarized intensity. If the polarization phase function is symmetric around 90, then this also sets a lower limit on the forward to backward scattering intensity. However, we do not anticipate this to generally be true, as evidenced by the unusual case of the HR 4796A debris disk (Perrin et al., 2015; Milli et al., 2017), and by theoretical projections for polarization phase functions in Canovas et al. (2015).
In Section 5.2 we further discuss a residual arc-like structure to the south, which is also detectable as a brightness enhancement in the Stokes image (Figure 1, left panel). Uncorrected instrumental polarization affects the signal within of the star. We have delimited this region by a dashed circle in Figures 1–3, and have excluded it from our analysis.
No coherent structures are observed in the Stokes image to indicate significant optical depth. Hence, the Stokes image can be used as a noise map for our measurements and it reassures the astrophysical nature of the Stokes emission: specifically the polarized morphology exterior to and the middle ring near the edge to the east. Figure 2 shows an SNR map created by dividing the image at every position by local noise estimated as the standard deviation of pixels within a 3 pixel-wide annulus in the Stokes image at the same angular separation from the star.
3.2 Total Intensity H-band Image
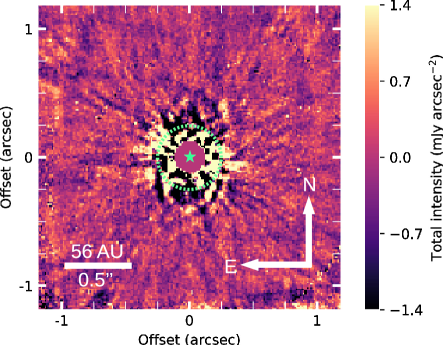
We attempted to detect the total intensity emission from the inner ring in two different ways: from the combined polarization states in our PDI observations, and from the unpolarized IFS observations. Figure 3 shows the result of the PSF subtraction of the Stokes image after applying pyKLIP (Wang et al., 2015) and Angular Differential Imaging (ADI, Marois et al., 2006). Our shorter IFS sequence with GPI did not reveal neither the inner disk detected in Stokes nor the previously known middle ring.
Our inability to detect the inner ring in total intensity is not entirely surprising. In extracting the Stokes signal from high-contrast observations we lose the differential imaging advantage of PDI. Moreover, the PSF subtraction process in total intensity also removes the smooth structure of the disk. Hence, we expect greater sensitivity to scattered light in our polarized light Stokes image. In view of the low-SNR detection in total intensity we use only the polarimetric detection in Stokes in the remainder of this study.
4 Disk Modeling
| Fixed stellar parameters | |||||
| Distance | 111 | ||||
| Stellar Radius | ) | 1.66 R⊙ | |||
| Effective Temperature | 10000 | ||||
| Extinction | 0.144 | ||||
| 3.1 | |||||
| Disk model fixed parameters | |||||
| Inner Radius | (AU) | 20 | |||
| Outer Radius | (AU) | 110 | |||
| Inner exponent | 14 | ||||
| Reference Radius | (AU) | 45 | |||
| Solid material dust density | (g cm-3) | 3.5 | |||
| Flaring exponent | 1 | ||||
| Vertical exponent | 1 | ||||
| Disk model free parameters | Sampling | Range | Number of values | Best Fit Value | |
| Inclination | ) | lin. in cosine | [40, 80] | 10 | |
| Position Angle | lin. | [, 15] | 9 | ||
| Reference Scale Height | (AU) | lin. | [2.2, 36] | 9 | |
| Dust mass | (M⊙) | lin. | [0.2, 2.0] | 10 | |
| Outer exponent | lin. | [, ] | 8 | ||
| (AU) | lin. | [24, 64] | 11 | ||
| Minimum grain size | (m) | log. | [0.5, 16] | 6 | |
| Porosity | (%) | lin. | [0, 20, 40, 60, 80] | 5 | 0 |
| Minimum reduced | 0.93 | ||||
We model the resolved polarized Stokes image of the inner disk with a radiative transfer model to determine the disk geometry (Section 4.1) and dust properties (Section 4.2). The same modeling tool can predict the SED for the disk models, but since the SED is dominated by emission from dust outside the GPI field of view, we only compute model SED as a test to check against gross inconsistency (Section 4.3).
4.1 Parameterization of the Dust Model
We use the Monte-Carlo continuum radiative transfer and ray-tracing code MCFOST (Pinte et al., 2006, 2009) to compute synthetic observations of the SED and the Stokes images of the disk around HD 141569A. MCFOST computes the scattering, absorption and re-emission events by dust grains by propagating photon packets throughout a cylindrical spatial grid in accordance with Mie theory.
Dust grains are assumed to be in radiative equilibrium embedded in the radiation field from the host star. The sampling of our synthetic images is defined to cover the entire field of view of observations using GPI’s pixel scale of mas lenslet-1 (De Rosa et al., 2015). The star is located at the center of the computational grid and the disk is centered on the star. To obtain the stellar luminosity, we fit the optical to near-IR SED of HD 141569A (Høg et al., 2000; Mendigutía et al., 2012; Cutri et al., 2003), keeping the stellar radius and foreground extinction as variables. We assumed a fixed distance of 111 pc with an effective temperature of K for the star (Merín et al., 2004) and used NextGen photospheric models from Hauschildt et al. (1999). We obtain L⊙ for the stellar luminosity. It agrees within uncertainties with the previous estimate of L⊙ by Merín et al. (2004) .
The disk geometry in cylindrical coordinates is described by the radial extent of the disk, with inner and outer radii and , inclination , position angle and dust density distribution . Following Augereau et al. (1999b), the dust distribution in the vertical direction is parameterized within the MCFOST framework as an exponential with a shape parameter :
| (1) |
where the scale height is defined as at a fixed reference radius =45 AU, and is a disk flaring parameter. Radially, the dust distribution follows a smooth combination of two power laws:
| (2) |
where , , and is the radial distance of the peak density of the grain distribution. The surface density of dust grains is represented as:
| (3) |
where for . The maximum of the surface density is not at , but at
| (4) |
where and , which in our case is nearly identical to .
We assume a disk with a constant opening angle, thus no flaring (), and adopt . Without better initial constrains on these parameters our assumption is reasonable for an optically-thin debris disk.
The surface brightness and thermal flux of the disk is controlled by the total mass in grains in the disk. To characterize the dust content in the disk, we adopt a power-law grain size distribution with as is commonly assumed for debris disks in a steady-state collisional cascade (Dohnanyi, 1969). The size distribution has limits and and grain porosity . We fix mm and leave as a free parameter in the model. Within the MCFOST framework, the refractive index of porous grains is approximated from a mixture of solid grains with void particles following the Bruggeman mixing rule. Modeling is limited to a stellocentric disk populated by a single dust grain composition of amorphous magnesium-rich olivine with a dust grain density g cm-3. We adopted this dust grain composition to match the composition used by Thi et al. (2014) and Mawet et al. (2017).
Our disk model parameterization thus comprises: , , , , , , , , , and . To reduce the burden of an 11 dimensional parameter exploration, we fixed and at 20 AU and 110 AU respectively. These disk boundaries are motivated by our inability to detect the inner disk within and beyond 1 from the star (Figure 2). We also set as motivated by preliminary modeling that pointed to high values. Such a steep profile implies a sharp drop in density inside of . The probability density distribution for in those models plateaued at .
By exploring each of the variable parameters at 5 to 11 discrete values, we construct a model grid with over grid points for the remaining eight free parameters. Table 1 details the full set of parameters involved in the modeling, including additional fixed parameters for the star and disk.
4.2 Polarized Scattered Light Modeling and Best Fit Estimates
In preparation for the fitting procedure, we first binned the images in pixels to reduce the effects of correlated errors. GPI’s resolution element is about 3 pixels in the band, and therefore, the binning should not lead to loss of spatial information. Following Millar-Blanchaer et al. (2015), we used the binned Stokes to derive the uncertainties used to fit the binned Stokes image. For each position in the binned Stokes image, the uncertainty is calculated as the standard deviation of a 3 pixel-wide annulus on the binned image. These steps return the uncertainty map to use in the minimization procedure:
| (5) |
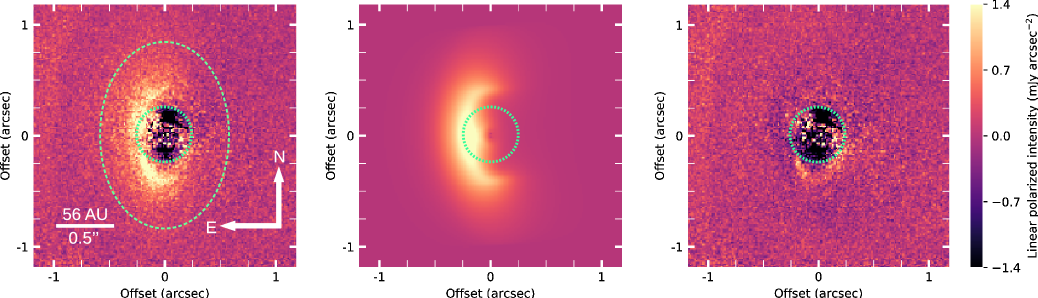
The fitting occurs within an (radius) elliptical region centered on the star and excludes the central -radius circular region to avoid PSF subtraction residuals (Figure 4, left). The fitting region in the binned image has 767 resolution elements. We opt for an elliptical fitting region rather than a circular one because Poisson noise from the disk rather than the stellar halo is the main limiting factor for our sensitivity.
The outcome of our modeling strategy is presented in Figure 4 which shows the Stokes image (left), the best-fit model (center), and the residuals (right): all displayed on the same color and intensity scale as the Stokes image in Figure 1. Our best-fit model returns a reduced and so provides a good match to the Stokes image. Our best-fit model Stokes image contains very little flux, on the order of of the model Stokes . This indicates that the disk is optically thin with an inferred mid-plane optical depth of from MCFOST.
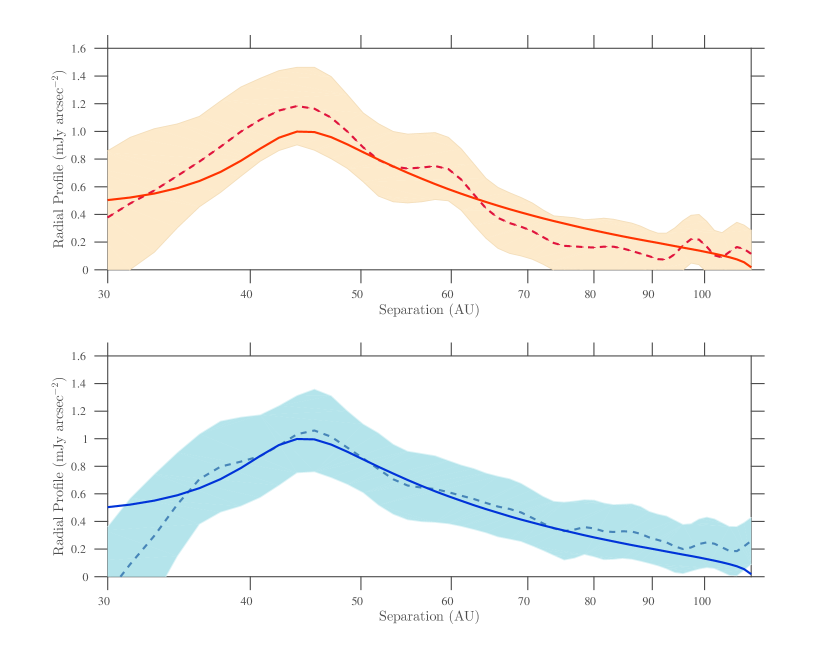
As a consistency check on our best-fit solution, we plot radial profiles of the polarized emission along the semi-major axis of the disk, and compare them to the prediction from the model (Figure 5). We see that the model follows the radial profile well, and stays within the 1- uncertainty band at most separations, except inwards of 31 AU to the north, where it overestimates the observed emission. There is also residual emission to the south around that has no counterpart to the north (Figure 4, right), and that we discuss in Section 5.1 and 5.2.
The overall consistency of the model and image radial profiles give us confidence that we have an adequate understanding of the dust disk parameters. Assuming that our observational errors are approximately Gaussian, and adopting a flat prior for each parameter, the Bayesian probability of our model given the data is:
| (6) |
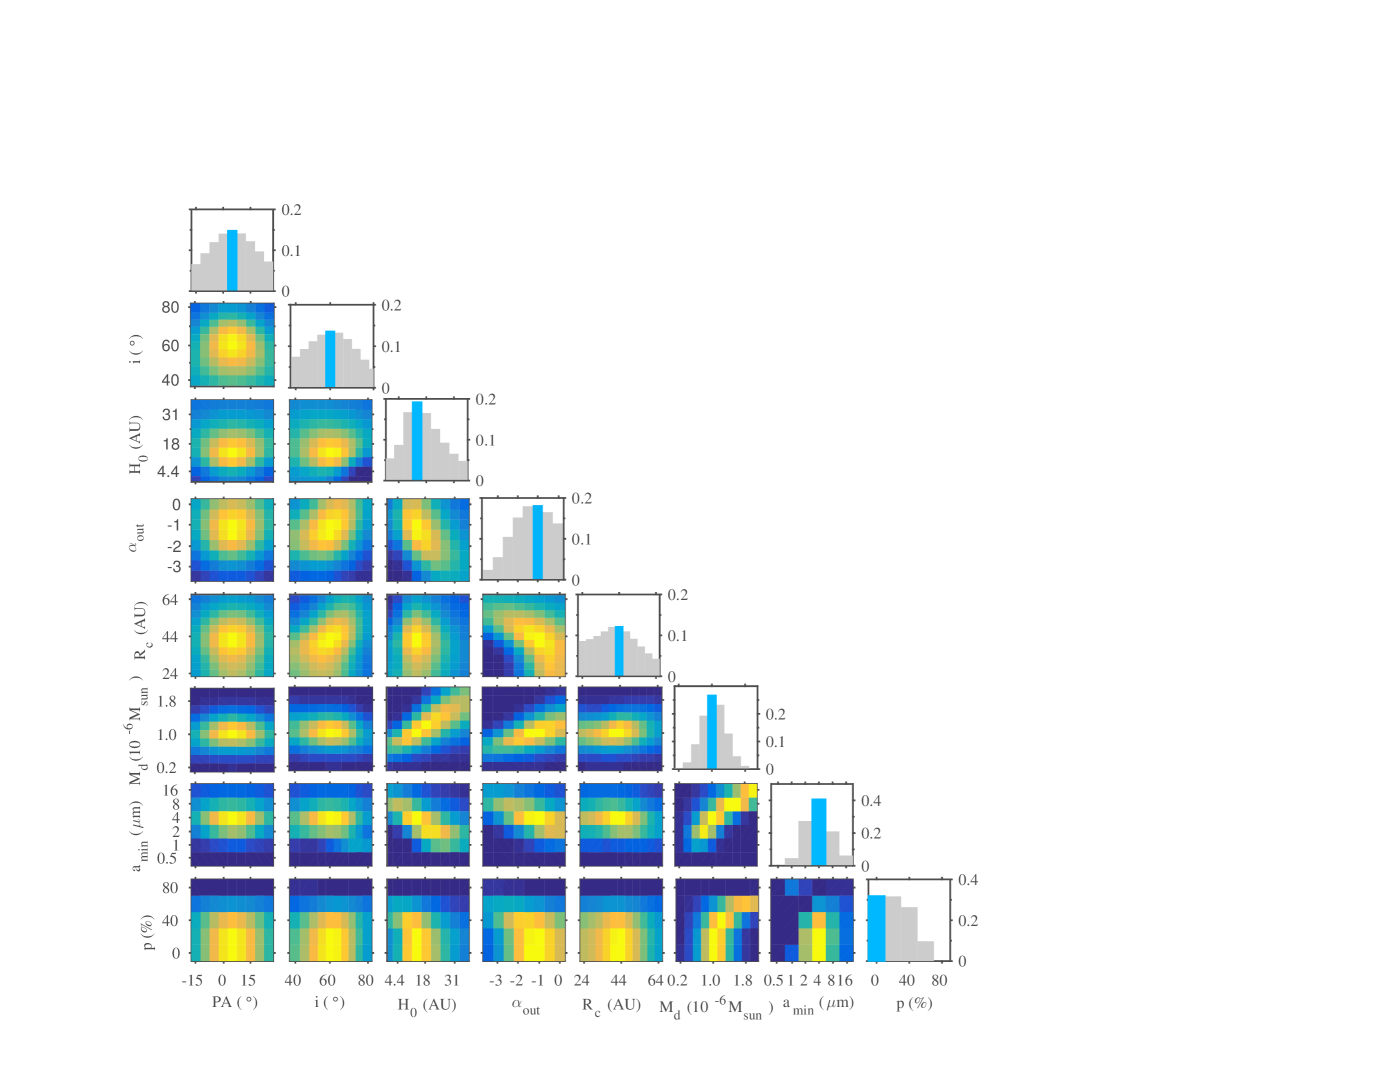
To estimate the probability density distribution for any parameter, we marginalize over the remaining parameters as shown in Figure 6.
We obtain good constraints for , and , whose probability density distributions are approximately Gaussian. Unfortunately, our modeling returns poor constrains on the viewing geometry of the disk and on some of the parameters that describe the spatial distribution of the dust. The posterior distributions for and in Figure 6 are broader than we anticipated. Hence, we cannot establish a proper uncertainty. This suggests that polarized intensity alone is not adequate for determining the geometry, since only the Eastern half of the disk is detected. In addition, for and our modeling returns non-symmetric skewed distributions. We use the 68% confidence intervals as estimates for the uncertainties on the best-fit parameter values for , , , , and . For and , we use the 90% confidence interval instead, as motivated by our coarser sampling in these parameters.
Our best-fit disk model has , position angle , scale radius AU, a rather large reference scale height AU (which at a reference radius of AU gives an opening angle of 17∘), and a shallow outer exponent . The total dust mass of M⊙ is within the range M⊙ estimated from SED modeling (Zuckerman et al., 1995; Sylvester et al., 1996; Merín et al., 2004; Thi et al., 2014). The best-fit minimum grain size is m (90% confidence interval). The minimum grain size agrees with the blow-out grain radius (Burns et al., 1979) in a gas-poor disk, with m for spherical silicate grains of density g cm-3, assuming a radiation pressure efficiency factor of . We discuss the blow-out radius with respect to the gas content of the inner disk further in Section 5.4. The best-fit model favors a population of solid dust grains, porosity , although it is consistent with porosity up to within the 90% confidence limit.
As seen in Figure 6, the total dust mass is strongly degenerate with several disk parameters, notably the minimum grain size , the outer exponent and, surprisingly, the disk scale height . There is no evident mechanism by which the scale height would be degenerate with the disk mass for an optically thin disk. A third parameter could set this correlation but the relationship remains unclear. All of these degeneracies preclude us from placing fully independent constraints on , or . In Section 5.4 we discuss an independent and more stringent constraint on the minimum grain size , arising from the lack of measurable signal in the Stokes image.
4.3 Comparison of the Scattered Light Model to the SED
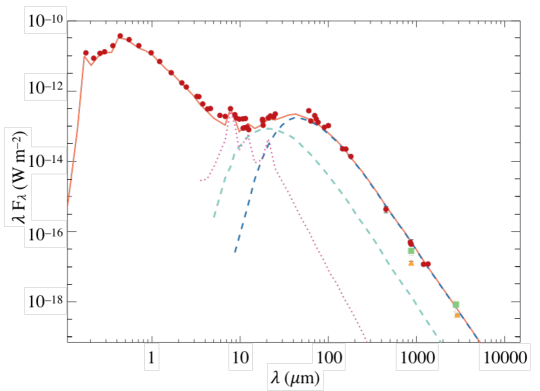
We compare the predicted thermal emission from our best-fit model to the Stokes image against the SED of HD 141569A in Figure 7. Fitting the SED is not a part of our search for the model that best matches the scattered light emission. It is merely a consistency check on our scattered light modeling assuming that the same dust population is responsible for both disk tracers.
We use the compendium of photometric data from Thi et al. (2014) with updated photometry in the optical (Høg et al., 2000; Mendigutía et al., 2012). We expand this dataset by including recent sub-millimeter and millimeter photometry with ALMA (White et al., 2018) and with the Submillimeter Array (SMA; Flaherty et al., 2016). We note that the photometric measurements in Thi et al. (2014), Flaherty et al. (2016) and White et al. (2018) come from instruments with different resolutions and beam sizes. These range from FWHW seeing-limited optical/near-IR measurements, to a beam of for the 2.8 mm SMA photometry, and up to for 60 photometry from the Infrared Astronomical Satellite (IRAS).
We also include a PAH component, motivated by resolved (FWHM = 0.26″) observations with the VLT Imager and Spectrometer for the mid-IR (VISIR; Lagage et al., 2004) in the PAH1 filter (m, ). These reveal a disk out to along the semi-major axis (Thi et al., 2014). PAHs in the circumstellar environment of HD 141569A are responsible for the emission features in the mid-IR at 7.7, 8.7, 11.3 and 12.7m (Sylvester et al., 1996). We include the PAH component (magenta dotted line) with the sole goal of approximating the emission features in the mid-IR modeled in previous studies (Li & Lunine, 2003; Thi et al., 2014). PAHs were added with the adopted single molecule size of 6.84 Å and fixed mass of M⊙ from Thi et al. (2014).
The thermal emission from our scattered light model of the 44 AU disk reproduces the observed 50 fluxes adequately. The emission peaks at a wavelength of 45 (and so has a characteristic dust temperature of 67 K) and a flux of W m-2. This is within factors of 1.0–1.8 of the observed 60–100 far-IR fluxes measured with IRAS, Spitzer, and Herschel (Thi et al., 2014, and references therein). The range is entirely due to the scatter in the flux measurements from different instruments.
At 140 wavelengths the predicted thermal emission from the 44 AU disk matches the SED unexpectedly well, considering that we did not include any SED information in our modeling. The published far-IR and millimeter flux measurements are obtained from much wider beams that incorporate the outer two debris rings, so we expect that the fluxes should be higher than the predicted brightness of the 44 AU ring. While an SED analysis of HD 141569A is relegated to a future study, there are two independent lines of evidence that suggest that the 44 AU ring dominates the 100 thermal emission. First, the emission resolved in the ALMA 870 continuum and CO maps in White et al. (2016) is consistent with origin in a 50 AU ring: likely the same dust ring as resolved by GPI. ALMA shows no evidence of significant millimeter emission associated with the middle (220 AU) dust ring. Second, with the middle dust ring being 5 times wider than the inner 44 AU ring, its characteristic dust temperature will be cooler, so 30 K. A strong 30 K dust component will produce a notable bump in the SED around 100. However, the observed 60 fluxes closely follow a Rayleigh-Jeans distribution. Hence, we believe that the 44 AU dust disk resolved by GPI accounts for most of the long-wavelength flux from the HD 141569A circumstellar disk.
Finally, we note that even while it reproduces the observed fluxes adequately, the combined SED of our scattered light and PAH emission model is underluminous between 8–30µm. A fourth component, interior to the one seen by GPI, is likely present around the star. To correct for this flux deficit in the mid-IR, we model an innermost 5–15 AU dust disk (light blue dashed line in Figure 7) in MCFOST. We discuss this innermost disk further in Section 5.5.
4.4 The Effect of Mie Scattering Assumptions on Disk Modeling Results
The synthetic models in our modeling procedure rely on Mie scattering theory to compute the scattering, opacity and absorption cross sections of dust grains in the circumstellar environment of HD 141569A. Although Mie theory has been extensively used in numerous debris disk studies, it has limitations.
In Mie scattering, individual dust grains are idealized as uniform solid spheres, an assumption likely not applicable to dust grains growing through agglomeration in debris disks. Hence, Mie theory could struggle to accurately predict the light scattering and thermal processes in debris disks. More elaborate models with irregularly shaped dust grain aggregates indicate that Mie theory does not reproduce well the scattering phase function at angles (Min et al., 2016). Accordingly, Milli et al. (2017) show that Mie models fail to reproduce the scattering phase function for the HR 4796A dusty debris ring. Such discrepancies likely bias the determination of certain model parameters, in particular the viewing geometry, minimum grain size, dust composition, dust mass, and porosity.
While we have adopted Mie theory-based models for our analysis for the sake of comparison with previous radiative transfer modeling on the dust-scattered light from the HD 141569A debris disk (Jonkheid et al., 2006; Thi et al., 2014; Mawet et al., 2017), we note the above limitations ahead of the ensuing discussion.
5 Discussion
5.1 Morphology of the HD 141569A Inner Disk in Polarized Scattered Light: Comparison to Previous Observations
PDI with GPI has revealed the clearest view of the inner disk around HD 141569A inwards to an inner working angle (IWA) of (28 AU). The IWA achieved with GPI shows the 44 AU ring morphology that supersedes any lower-SNR detections from images with larger IWAs.
The highest SNR obtained on the 44 AU ring previously in scattered light is through -band AO and vortex coronagraphy with Keck/NIRC2 (FWHM , effective IWA 016) by Mawet et al. (2017), and also reported with Keck/NIRC2 in -band by Currie et al. (2016) down to 025. Perrot et al. (2016) report even higher angular resolution -band AO observations with VLT/SPHERE (FWHM , IWA=0093), as do Konishi et al. (2016) with HST/STIS (FWHM=004, IWA=040). Compared to our PDI with GPI, all of these previous non-polarimetric observations have lower SNR because of the inability to employ simultaneous differential imaging through polarimetry, but relying solely on ADI instead. Diffuse structures with significant axial symmetry, such as debris disk seen at low to moderate inclinations, are challenging to extract with ADI/KLIP. PDI with GPI has produced a high-SNR detection of the disk with much lower reduction-dependent systematics.
Our GPI polarized light image confirms the clearing within the 44 AU ring first reported by Perrot et al. (2016). Thi et al. (2014), Konishi et al. (2016) and Mawet et al. (2017) report PAH emission or scattered light emission from dust at similar separations, but describe its radial dependence with a single-exponent power law that decreases with separation. As seen in Figure 5, we clearly resolve the peak at 44 AU that is well modeled with exponential drop-offs on either side. The width of the ring in polarized light (FWHM 30 AU) is greater than reported (FWHM 10 AU) from the unpolarized VLT/SPHERE observation of Perrot et al. (2016), which we attribute to self-subtraction in the various KLIP reductions of the SPHERE images.
Consistent with Perrot et al. (2016) and Mawet et al. (2017), we find a north-south asymmetry in the brightness of the 44 AU ring, which we now reveal as a high-SNR arc-like structure to the south. We do not see evidence of the other clumps reported in these studies, and suspect they may be related to image artifacts.
The viewing geometry of our best-fit model, and , is similar to previous findings from scattered light total intensity observations at lower SNR. Perrot et al. (2016) report that the inner ring has an inclination of and a of from observations with VLT/SPHERE, while Mawet et al. (2017) report and from observations with Keck/NIRC2. However, unlike all previous direct imaging (non-polarimetric) observations, which point to a relatively well-constrained slightly W of due N orientation of the semi-major axis of the inner ring, our polarimetric observation produces a less well constrained, slightly E of due N PA. Our values for and follow broad distributions in Figure 6 that suggest uncertainties of about 10∘. Our own lower-SNR -band total intensity image (Figure 3) suggests a slightly clockwise () orientation of the scattered light emission: in agreement with Perrot et al. (2016) and Mawet et al. (2017), and contrary to our polarized image. Effectively, the orientation of the inner disk from previous total intensity observations is in good alignment with the outer disk, whereas the PDI observations are less conclusive.
It is at first surprising that our polarimetric image does not produce better constraints on the geometry. The SNR of all of our own and of the previously published total intensity observations is much lower. The reduced total intensity images also suffer from the typical PSF-subtraction systematics for extended emission around bright stars: the result of ADI mode observations and image reduction with the KLIP algorithm. Thus, it is possible that the uncertainties in Perrot et al. (2016) have been underestimated, and our values are closer to agreement with theirs because of larger uncertainties (as in Mawet et al., 2017). Nonetheless, the discrepancy between the polarized and the total intensity geometry is still unusual, as is the inability to get better geometric constraints from our polarized intensity images.
We suspect that the failure of our modeling to produce better viewing geometry constraints may be a consequence of detecting only half of a radially extended disk in polarized intensity. The detection of this non-axi-symmetric half disk, combined with the broader arc-like feature to the south (§ 4.2, Figure 4, right), may favor models with ’s flipped around the north-south axis. In addition, as discussed in Section 4.4, it is possible that the scattering phase function derived in our Mie-based radiative transfer MCFOST model may not agree well with the behavior of debris disk dust grains. The detected side of the debris ring is seen at a 90∘ scattering phase angle, and as in the case of the HR 4796A debris ring (Milli et al., 2017), the polarization and intensity of the scattered light may not be well represented by Mie theory.
5.2 The Arc-like Structure: a Spiral Arm?
The arc-like asymmetry spans between in . This feature is not an outcome of the data reduction process because the PDI image requires no further PSF subtraction, but is rather a true brightness enhancement in the ring. A disk with a stellocentric offset could offer a possible explanation for the enhanced emission from the arc-like structure to the south. The portion of the disk closer to the star would appear brighter than the other side, leading to pericenter glow (Wyatt et al., 1999). Our modeling procedure did not include stellocentric offsets, and so we cannot check for pericenter glow. Perrot et al. (2016) find that the inner ring has a stellocentric offset of mas ( AU) to the west, but only a negligible one, mas ( AU), to the north. Therefore a north-south stellocentric offset is not the likely cause of the brightness enhancement to the south.
For a clearer view of the morphology of the asymmetry, we mirror and subtract the northern portion of the disk from the southern half. Given the ambiguity of the disk’s orientation, we perform two different subtractions. In the first case we mirror around the semi-minor axis of the best-fit model of the polarized emission seen with GPI; i.e., the of the semi-major axis is 5 (Figure 8, middle panel). In the second case we use the geometry inferred from the total intensity image from SPHERE, with semi-major axis of 353.7 (Figure 8, right panel). Both subtractions show the excess emission to the south as a remnant arc at SNR levels of 4–5 per GPI pixel along the peak of the emission. The residuals in the case are closer to zero, which is why our modeling of the polarized light emission prefers that geometry. In this case the arc contributes up to 40% of the surface brightness of the debris disk between , and has a net integrated surface brightness of 5 mJy within a 10 AU-wide region centered on the peak emission at 44 AU. In the semi-major axis case the residuals are more uniform, and also more positive. The arc contributes 50% of the disk surface brightness at , and wraps counter-clockwise to at least , where it is still at 40% of the disk’s total brightness before the signal diffuses into the residual noise. The net integrated surface brightness of the arc in the same region is 15 mJy, and 25 mJy if extended up to .
Without a higher-SNR total intensity image of the disk, we can not decide in favor of one disk PA vs. the other. However, both point to the existence of an arc on the inner ring of the HD 141569A disk that contributes between 40%–50% of the total disk flux to the south-east. Such arc-like structures are known on the outer two rings of HD 141569A (Mouillet et al., 2001; Clampin et al., 2003; Perrot et al., 2016; Mawet et al., 2017). We believe this to be the first convincing detection of such an arc on the inner ring. The location and extent of the feature match the observed brightness enhancement in the SE section of the inner ring in Perrot et al. (2016) and the enhancement in the CO zeroth moment map in White et al. (2016). Our best-fit model indicates an average temperature of K at the location of the arc, well above the sublimation point of CO. The CO production mechanism may thus be linked to the dust over-density: pointing to ongoing destruction of CO ice-rich planetesimals. The destruction cascade itself may be triggered by an unseen body that is also responsible for producing the arc: as a spiral arm.
Spiral arm structures have been discovered in near-IR scattered light imaging observations of a few circumstellar disks (e.g., AB Aur, Hashimoto et al. 2011; HD 142527, Avenhaus et al. 2014; SAO 206462, Muto et al. 2012; MWC 758, Grady et al. 2013; HD 100453, Wagner et al. 2015). Two mechanisms are capable of driving such arms in gas-rich protoplanetary (and transition) disks: gravitational instability (e.g., Dong et al., 2015a), and interaction between the disk and a planetary or stellar companion (e.g., Dong et al., 2015b, 2016b). In optically thin debris disks with much lower gas-to-dust ratios, photoelectric instability (Klahr & Lin, 2005; Besla & Wu, 2007) may also lead to clumping of dust into structures. Spiral density waves are one of the hypotheses invoked for explaining the radially moving dust enhancements in the edge-on AU Mic debris disk (Boccaletti et al., 2015). However, typically multiple rings and arcs (i.e., broken rings), instead of one or two spiral arms, are seen in simulations (Lyra & Kuchner, 2013; richert18). While the HD 141569A disk is almost certainly too low in mass to be gravitationally unstable, the possibility that the detected spiral-arm-like feature is driven by an unseen planet is exciting. Dong et al. (2016a) showed that spiral arms driven by giant planets in disks at modest to high inclinations may appear very close to, or be part of, the disk ring sculpted by the planet. In particular, the 50∘ and 60∘ inclination panels in Figure 8 of Dong et al. (2016a) show intriguing similarities with the HD 141569A inner-disk spiral arm in Fig. 7. The weak contrast of the arm in HD 141569A indicates that if it is planet-driven, the planet is most likely Jovian or smaller (Dong & Fung, 2017).

5.3 Disk Opening Angle
While it is much less powerful a constraint than it is in (optically thick) protoplanetary disks, our modeling allows us to place approximate constraints on the opening angle or scale height of the resolved inner disk. The best-fit model indicates a rather large reference scale height of AU at the AU reference radius, so an opening angle of . This is above expectations even for a transitional disk, although values as small as 10% are within the 84% confidence limit. With such a large disk opening angle, the best-fit model incorporates significant scattering at angles smaller than the expected from a perfectly flat disk (given inclination of ). However, if our Mie theory-derived scattering phase function is wrong, this constraint is not to be trusted.
Previous determinations of the opening angle range from 5%–10% (Thi et al., 2014) to 23% (Merín et al., 2004). The latter is from SED fitting alone, and while consistent with our finding, it is not very well constrained. The Thi et al. determination pertains to the gas disk geometry and is constrained from Herschel measurements of the [C II]/CO line flux ratio, which traces the efficiency of CO photodissociation as a function of gas scale height. However, without having spatially resolved the inner disk, Thi et al. adopt a model with a gas surface density peak at 28 AU (Fig. 6 in that paper), whereas we resolve the brightness peak of the inner dust disk at 44 AU (Fig. 5). If the gas and the dust are well-mixed, as assumed by Thi et al., then a cooler gas disk would require a greater scale height to produce the same [C II]/CO line flux ratio. It is therefore likely that under the joint constraints from the Herschel gas abundances and the GPI resolved dust disk morphology, the gas disk has a 10% opening angle consistent with the wide dust disk opening angle found here.
5.4 Independent Constraint on the Minimum Grain Size from Polarimetry
Our model of the polarized scattered light (Section 4.2) produced a minimum grain size of , consistent with the 4.2 blow-out grain radius around HD 141569A. The result for the blow-out radius is meaningful as long as the inner disk remains gas-poor. Conversely, in gas-rich disks with interstellar medium-like gas-to-dust ratios of 100, gas drag dominates the dynamics of small grains.
Based on a total gas mass estimate of 200 (), Thi et al. (2014) find an average gas-to-dust ratio of 50–100 over the full extent of the 500 AU disk. This would preclude a meaningful radiation-pressure estimate of the blow-out radius. However, White et al. (2016) find a much lower (H2) gas mass of within 210 AU, and observed that the inner 50 AU region shows only tenuous CO emission. Hence, the inner disk that we resolved with GPI is substantially more deprived of gas. Adopting the White et al. (2016) gas mass, and our best-fit dust mass of for the 44 AU ring (Table 1), yields a gas-to-dust ratio of 5. The actual gas-to-dust ratio in the 44 AU ring is likely lower, since the White et al. (2016) gas mass estimate encompasses both the inner 44 AU and parts of the middle 220 AU ring. Therefore, we expect that the smallest grains in the inner ring are more strongly affected by radiation pressure than by gas drag.
Our best-fit value of for the minimum grain size is marginally consistent with previous findings from scattered light observations (Marsh et al., 2002; Mawet et al., 2017) but differ from values inferred from SED modeling (Thi et al., 2014; Mawet et al., 2017). The resolved Keck II mid-IR observations of Marsh et al. (2002) yield a best-fit () minimum grain size of 1–3—in agreement with our findings—although fits with either ISM-sized 0.1m () or large (30) blackbody grains () are also satisfactory. Using Mie scattering assumptions and MCFOST for modeling, Mawet et al. (2017) find that a population of dust particles of pure olivine with m provides the best fit to the resolved -band scattered light emission between 20–90 AU. At the same time, Mawet et al. also find that a minimum grain size of 0.5 best fits the SED, echoing the findings from SED model fitting by Thi et al. (2014). The combined best fit to the image and SED in Mawet et al. (2017) yields an even smaller minimum grain size: .
The preference for very small (0.1–0.5m) grains in SED modeling points to the presence of a warm dust component that may not be well represented by an extrapolation of an index (collisionally-dominated) grain size distribution below 1 m. The collisional cascade may not be equally efficient at all grain sizes, or at all radial separations in the disk. Such is the case at least for large grains around HD 141569A, as multi-band 0.9–9 mm ALMA and VLA observations show that at millimeter sizes the index is (White et al., 2018).
Our polarization observations are uniquely diagnostic of the presence of sub-micron grains because of their polarization properties. Specifically, scattered light models with a significant population of m are rejected because they produce negative polarization in Stokes that is not observed by GPI. We similarly rule out highly porous () materials. Thus, with the added power of near-IR polarimetry, we conclude that the population of 1.0m grains in the 44 AU dust ring is not significant enough to be detectable in polarized light. A trace population may nonetheless exist, and could be responsible for the observed PAH emission. We use this result to argue for a fourth, innermost and unseen component of the HD 141569A debris disk in Section 5.5.
We again caution that this analysis is rooted in Mie theory, that may not yield the correct ratio of scattered to absorbed (and emitted) flux. A non-Mie treatment, could yield different constraints on the minimum grain size from the observed polarization signatures. However, an additional argument against the presence of a large reservoir of sub-micron grains is the lack of a 10 silicate feature in the Spitzer IRS spectrum of HD 141569A (Sloan_etal05), as also argued by Thi et al. (2014). Hence, we find that a warm ring of dust grains several microns in size and lying interior to the one resolved with GPI offers the simplest explanation for the extra 8–30 emission from HD 141569A.
5.5 An Unseen Innermost (Fourth) Ring
Our best-fit model to the light-polarizing dust offers a good match to the m SED (Figure 7). However, there is remnant excess emission between 8–30 m that is not reproduced by our dust model. The presence of warm circumstellar material well within 100 AU has been inferred not only from the above-mentioned SED fitting by Thi et al. (2014) and Mawet et al. (2017), but also from CO observations (Merín et al., 2004; Goto et al., 2006; Fisher et al., 2000; Thi et al., 2014; Flaherty et al., 2016; White et al., 2016). Our detection of an inner clearing within the 44 AU ring, and the lack of polarization signal from sub-micron-sized grains (Section 5.4), imposes new constraints on the spatial extent of the warm dust responsible for the excess thermal emission at shorter wavelengths.
To account for this missing flux, we employ a simple model in MCFOST assuming the same grain size distribution, m, mm, porosity of 0% and magnesium-rich olivines from our best-fit model. Motivated by Thi et al. (2014), the dust is characterized by a radial density distribution with , no flaring () and an inner disk radius of AU. We keep the outer radius , and dust mass of the innermost disk as free parameters.
The best-fit thermal model for the innermost disk (light blue dashed line in Figure 7) indicates 300 K dust with a mass of () ranging from AU up to AU. This is well within the coronagraph IWA of GPI, and so presently undetectable in scattered light.
6 Conclusion
We have presented the first polarimetric detection of the inner 44 AU disk component of the pre-main sequence star HD 141569A. -band polarimetric differential imaging with GPI has revealed a non-uniform ring-shaped optically-thin dusty disk inwards to 025, at the highest signal-to-noise ratio attained to date. We find that the disk can be described radially with a combination of two power laws that peaks at AU and extends out to AU. The disk also features an arc-like overdensity along the southern part that is reminiscent of the spiral arm structures previously known at larger scales in this system. The existence of this inner spiral arm structure and its co-location with CO emission detected by ALMA indicates that this may be a site of on-going icy grain destruction, perhaps driven by an unseen planetary perturber. The best-fit model to our polarimetry data indicates an optically-thin disk with a maximum surface density of AU, a steep inner gradient (), and a shallower outer exponent (). The polarimetric observations are best described by a dust population model with a minimum size of m and a mass of for non-porous grains up to 1 mm in size. A significant population of sub-micron grains is independently excluded by the lack of negative signal in the -band Stokes image. We use the thermal emission from our best-fit Mie model to estimate the amount of unseen dust inwards of 28 AU. We find that a fourth innermost dust population, potentially a 5–15 AU belt, is required to fully reproduce the 8–30µm SED under Mie theory assumptions.
With our new high-SNR polarimetric detection of the 44 AU ring, the richness of the circumstellar environment around HD 141569A can be appreciated under a new light. Considering resolved imaging data from other high-contrast facilities, the HD 1415169A debris disk shapes up to be made of at least three, and potentially four nested rings, with spiral structures on the three spatially resolved rings. As such, it is an excellent laboratory for studying dynamically perturbed disks.
References
- Arenou et al. (2017) Arenou, F., Luri, X., Babusiaux, C., et al. 2017, A&A, 599, A50
- Augereau et al. (1999a) Augereau, J. C., Lagrange, A. M., Mouillet, D., & Ménard, F. 1999a, A&A, 350, L51
- Augereau et al. (1999b) Augereau, J. C., Lagrange, A. M., Mouillet, D., Papaloizou, J. C. B., & Grorod, P. A. 1999b, A&A, 348, 557
- Avenhaus et al. (2014) Avenhaus, H., Quanz, S. P., Schmid, H. M., et al. 2014, ApJ, 781, 87
- Besla & Wu (2007) Besla, G., & Wu, Y. 2007, ApJ, 655, 528
- Boccaletti et al. (2015) Boccaletti, A., Thalmann, C., Lagrange, A.-M., et al. 2015, Nature, 526, 230
- Brittain et al. (2003) Brittain, S. D., Rettig, T. W., Simon, T., et al. 2003, ApJ, 588, 535
- Burns et al. (1979) Burns, J. A., Lamy, P. L., & Soter, S. 1979, Icarus, 40, 1
- Canovas et al. (2015) Canovas, H., Ménard, F., de Boer, J., et al. 2015, A&A, 582, L7
- Clampin et al. (2003) Clampin, M., Krist, J. E., Ardila, D. R., et al. 2003, AJ, 126, 385
- Currie et al. (2016) Currie, T., Grady, C. A., Cloutier, R., et al. 2016, ApJ, 819, L26
- Cutri et al. (2003) Cutri, R. M., Skrutskie, M. F., van Dyk, S., et al. 2003, VizieR Online Data Catalog, 2246
- De Rosa et al. (2015) De Rosa, R. J., Nielsen, E. L., Blunt, S. C., et al. 2015, ApJ, 814, L3
- Dohnanyi (1969) Dohnanyi, J. S. 1969, J. Geophys. Res., 74, 2531
- Dong & Fung (2017) Dong, R., & Fung, J. 2017, ApJ, 835, 38
- Dong et al. (2016a) Dong, R., Fung, J., & Chiang, E. 2016a, ApJ, 826, 75
- Dong et al. (2015a) Dong, R., Hall, C., Rice, K., & Chiang, E. 2015a, ApJ, 812, L32
- Dong et al. (2016b) Dong, R., Zhu, Z., Fung, J., et al. 2016b, ApJ, 816, L12
- Dong et al. (2015b) Dong, R., Zhu, Z., Rafikov, R. R., & Stone, J. M. 2015b, ApJ, 809, L5
- Fisher et al. (2000) Fisher, R. S., Telesco, C. M., Piña, R. K., Knacke, R. F., & Wyatt, M. C. 2000, ApJ, 532, L141
- Flaherty et al. (2016) Flaherty, K. M., Hughes, A. M., Andrews, S. M., et al. 2016, ApJ, 818, 97
- Gaia Collaboration et al. (2018) Gaia Collaboration, Brown, A. G. A., Vallenari, A., et al. 2018, ArXiv e-prints, arXiv:1804.09365
- Goto et al. (2006) Goto, M., Usuda, T., Dullemond, C. P., et al. 2006, ApJ, 652, 758
- Grady et al. (2013) Grady, C. A., Muto, T., Hashimoto, J., et al. 2013, ApJ, 762, 48
- Hashimoto et al. (2011) Hashimoto, J., Tamura, M., Muto, T., et al. 2011, ApJ, 729, L17
- Hauschildt et al. (1999) Hauschildt, P. H., Allard, F., & Baron, E. 1999, ApJ, 512, 377
- Høg et al. (2000) Høg, E., Fabricius, C., Makarov, V. V., et al. 2000, A&A, 355, L27
- Hughes et al. (2008) Hughes, A. M., Wilner, D. J., Kamp, I., & Hogerheijde, M. R. 2008, ApJ, 681, 626
- Hung et al. (2016) Hung, L.-W., Bruzzone, S., Millar-Blanchaer, M. A., et al. 2016, Gemini planet imager observational calibration XII: photometric calibration in the polarimetry mode, , , doi:10.1117/12.2233665
- Jaschek & Jaschek (1992) Jaschek, C., & Jaschek, M. 1992, A&AS, 95, 535
- Jaschek et al. (1986) Jaschek, M., Jaschek, C., & Egret, D. 1986, A&A, 158, 325
- Jonkheid et al. (2006) Jonkheid, B., Kamp, I., Augereau, J.-C., & van Dishoeck, E. F. 2006, A&A, 453, 163
- Kalas & Jewitt (1995) Kalas, P., & Jewitt, D. 1995, AJ, 110, 794
- Klahr & Lin (2005) Klahr, H., & Lin, D. N. C. 2005, ApJ, 632, 1113
- Konishi et al. (2016) Konishi, M., Grady, C. A., Schneider, G., et al. 2016, ApJ, 818, L23
- Kóspál et al. (2013) Kóspál, Á., Moór, A., Juhász, A., et al. 2013, ApJ, 776, 77
- Lagage & Pantin (1994) Lagage, P. O., & Pantin, E. 1994, Nature, 369, 628
- Lagage et al. (2004) Lagage, P. O., Pel, J. W., Authier, M., et al. 2004, The Messenger, 117, 12
- Lagrange et al. (2010) Lagrange, A.-M., Bonnefoy, M., Chauvin, G., et al. 2010, Science, 329, 57
- Li & Lunine (2003) Li, A., & Lunine, J. I. 2003, ApJ, 594, 987
- Lyra & Kuchner (2013) Lyra, W., & Kuchner, M. 2013, Nature, 499, 184
- Macintosh et al. (2014) Macintosh, B., Graham, J. R., Ingraham, P., et al. 2014, Proceedings of the National Academy of Science, 111, 12661
- Maire et al. (2014) Maire, J., Ingraham, P. J., De Rosa, R. J., et al. 2014, in Society of Photo-Optical Instrumentation Engineers (SPIE) Conference Series, Vol. 9147, Society of Photo-Optical Instrumentation Engineers (SPIE) Conference Series, 85
- Marois et al. (2006) Marois, C., Lafrenière, D., Doyon, R., Macintosh, B., & Nadeau, D. 2006, ApJ, 641, 556
- Marsh et al. (2002) Marsh, K. A., Silverstone, M. D., Becklin, E. E., et al. 2002, ApJ, 573, 425
- Mawet et al. (2017) Mawet, D., Choquet, É., Absil, O., et al. 2017, AJ, 153, 44
- Mazoyer et al. (2016) Mazoyer, J., Boccaletti, A., Choquet, É., et al. 2016, ApJ, 818, 150
- Mendigutía et al. (2012) Mendigutía, I., Mora, A., Montesinos, B., et al. 2012, A&A, 543, A59
- Merín et al. (2004) Merín, B., Montesinos, B., Eiroa, C., et al. 2004, A&A, 419, 301
- Millar-Blanchaer et al. (2015) Millar-Blanchaer, M. A., Graham, J. R., Pueyo, L., et al. 2015, ApJ, 811, 18
- Milli et al. (2017) Milli, J., Vigan, A., Mouillet, D., et al. 2017, A&A, 599, A108
- Min et al. (2016) Min, M., Rab, C., Woitke, P., Dominik, C., & Ménard, F. 2016, A&A, 585, A13
- Mouillet et al. (2001) Mouillet, D., Lagrange, A. M., Augereau, J. C., & Ménard, F. 2001, A&A, 372, L61
- Muto et al. (2012) Muto, T., Grady, C. A., Hashimoto, J., et al. 2012, ApJ, 748, L22
- Perrin et al. (2014) Perrin, M. D., Maire, J., Ingraham, P., et al. 2014, in Proc. SPIE, Vol. 9147, Ground-based and Airborne Instrumentation for Astronomy V, 91473J
- Perrin et al. (2015) Perrin, M. D., Duchene, G., Millar-Blanchaer, M., et al. 2015, ApJ, 799, 182
- Perrot et al. (2016) Perrot, C., Boccaletti, A., Pantin, E., et al. 2016, A&A, 590, L7
- Pinte et al. (2009) Pinte, C., Harries, T. J., Min, M., et al. 2009, A&A, 498, 967
- Pinte et al. (2006) Pinte, C., Ménard, F., Duchêne, G., & Bastien, P. 2006, A&A, 459, 797
- Pueyo et al. (2015) Pueyo, L., Soummer, R., Hoffmann, J., et al. 2015, ApJ, 803, 31
- Ressler et al. (1994) Ressler, M. E., Werner, M. W., Van Cleve, J., & Chou, H. A. 1994, Experimental Astronomy, 3, 277
- Richert et al. (2017) Richert, A. J. W., Lyra, W., & Kuchner, M. 2017, ArXiv e-prints, arXiv:1709.07982
- Schmid et al. (2006) Schmid, H. M., Joos, F., & Tschan, D. 2006, A&A, 452, 657
- Soummer et al. (2012) Soummer, R., Pueyo, L., & Larkin, J. 2012, ApJ, 755, L28
- Sylvester et al. (1996) Sylvester, R. J., Skinner, C. J., Barlow, M. J., & Mannings, V. 1996, MNRAS, 279, 915
- Thi et al. (2014) Thi, W.-F., Pinte, C., Pantin, E., et al. 2014, A&A, 561, A50
- van de Hulst (1957) van de Hulst, H. C. 1957, Light Scattering by Small Particles
- Wagner et al. (2015) Wagner, K., Apai, D., Kasper, M., & Robberto, M. 2015, ApJ, 813, L2
- Walker & Wolstencroft (1988) Walker, H. J., & Wolstencroft, R. D. 1988, PASP, 100, 1509
- Wang et al. (2015) Wang, J. J., Ruffio, J.-B., De Rosa, R. J., et al. 2015, pyKLIP: PSF Subtraction for Exoplanets and Disks, Astrophysics Source Code Library, ,
- Wang et al. (2014) Wang, J. J., Rajan, A., Graham, J. R., et al. 2014, in Proc. SPIE, Vol. 9147, Ground-based and Airborne Instrumentation for Astronomy V, 914755
- Weinberger et al. (1999) Weinberger, A. J., Becklin, E. E., Schneider, G., et al. 1999, ApJ, 525, L53
- Weinberger et al. (2000) Weinberger, A. J., Rich, R. M., Becklin, E. E., Zuckerman, B., & Matthews, K. 2000, ApJ, 544, 937
- White et al. (2016) White, J. A., Boley, A. C., Hughes, A. M., et al. 2016, ApJ, 829, 6
- White et al. (2018) White, J. A., Boley, A. C., MacGregor, M. A., Hughes, A. M., & Wilner, D. J. 2018, MNRAS, 474, 4500
- Wyatt et al. (1999) Wyatt, M. C., Dermott, S. F., Telesco, C. M., et al. 1999, ApJ, 527, 918
- Zuckerman et al. (1995) Zuckerman, B., Forveille, T., & Kastner, J. H. 1995, Nature, 373, 494