Measurements of the Absolute Branching Fractions of
J. P. Lees
V. Poireau
V. Tisserand
Laboratoire d’Annecy-le-Vieux de Physique des Particules (LAPP), Université de Savoie, CNRS/IN2P3, F-74941 Annecy-Le-Vieux, France
E. Grauges
Universitat de Barcelona, Facultat de Fisica, Departament ECM, E-08028 Barcelona, Spain
A. Palano
INFN Sezione di Bari and Dipartimento di Fisica, Università di Bari, I-70126 Bari, Italy
G. Eigen
University of Bergen, Institute of Physics, N-5007 Bergen, Norway
D. N. Brown
Yu. G. Kolomensky
Lawrence Berkeley National Laboratory and University of California, Berkeley, California 94720, USA
M. Fritsch
H. Koch
T. Schroeder
Ruhr Universität Bochum, Institut für Experimentalphysik 1, D-44780 Bochum, Germany
R. CheaibbC. HeartyabT. S. MattisonbJ. A. McKennabR. Y. SobInstitute of Particle Physics; University of British Columbiab, Vancouver, British Columbia, Canada V6T 1Z1
V. E. BlinovabcA. R. BuzykaevaV. P. DruzhininabV. B. GolubevabE. A. KozyrevabE. A. KravchenkoabA. P. OnuchinabcS. I. SerednyakovabYu. I. SkovpenabE. P. SolodovabK. Yu. TodyshevabBudker Institute of Nuclear Physics SB RAS, Novosibirsk 630090a, Novosibirsk State University, Novosibirsk 630090b, Novosibirsk State Technical University, Novosibirsk 630092c, Russia
A. J. Lankford
University of California at Irvine, Irvine, California 92697, USA
B. Dey
J. W. Gary
O. Long
University of California at Riverside, Riverside, California 92521, USA
A. M. Eisner
W. S. Lockman
W. Panduro Vazquez
University of California at Santa Cruz, Institute for Particle Physics, Santa Cruz, California 95064, USA
D. S. Chao
C. H. Cheng
B. Echenard
K. T. Flood
D. G. Hitlin
J. Kim
Y. Li
T. S. Miyashita
P. Ongmongkolkul
F. C. Porter
M. Röhrken
California Institute of Technology, Pasadena, California 91125, USA
Z. Huard
B. T. Meadows
B. G. Pushpawela
M. D. Sokoloff
L. Sun
Now at: Wuhan University, Wuhan 430072, China
University of Cincinnati, Cincinnati, Ohio 45221, USA
J. G. Smith
S. R. Wagner
University of Colorado, Boulder, Colorado 80309, USA
D. Bernard
M. Verderi
Laboratoire Leprince-Ringuet, Ecole Polytechnique, CNRS/IN2P3, F-91128 Palaiseau, France
D. BettoniaC. BozziaR. CalabreseabG. CibinettoabE. FioravantiabI. GarziaabE. LuppiabV. SantoroaINFN Sezione di Ferraraa; Dipartimento di Fisica e Scienze della Terra, Università di Ferrarab, I-44122 Ferrara, Italy
A. Calcaterra
R. de Sangro
G. Finocchiaro
S. Martellotti
P. Patteri
I. M. Peruzzi
M. Piccolo
M. Rotondo
A. Zallo
INFN Laboratori Nazionali di Frascati, I-00044 Frascati, Italy
S. Passaggio
C. Patrignani
Now at: Università di Bologna and INFN Sezione di Bologna, I-47921 Rimini, Italy
INFN Sezione di Genova, I-16146 Genova, Italy
B. J. Shuve
Harvey Mudd College, Claremont, California 91711, USA
H. M. Lacker
Humboldt-Universität zu Berlin, Institut für Physik, D-12489 Berlin, Germany
B. Bhuyan
Indian Institute of Technology Guwahati, Guwahati, Assam, 781 039, India
U. Mallik
University of Iowa, Iowa City, Iowa 52242, USA
C. Chen
J. Cochran
S. Prell
Iowa State University, Ames, Iowa 50011, USA
A. V. Gritsan
Johns Hopkins University, Baltimore, Maryland 21218, USA
N. Arnaud
M. Davier
F. Le Diberder
A. M. Lutz
G. Wormser
Université Paris-Saclay, CNRS/IN2P3, IJCLab, F-91405 Orsay, France
D. J. Lange
D. M. Wright
Lawrence Livermore National Laboratory, Livermore, California 94550, USA
J. P. Coleman
E. Gabathuler
D. E. Hutchcroft
D. J. Payne
C. Touramanis
University of Liverpool, Liverpool L69 7ZE, United Kingdom
A. J. Bevan
F. Di Lodovico
R. Sacco
Queen Mary, University of London, London, E1 4NS, United Kingdom
G. Cowan
University of London, Royal Holloway and Bedford New College, Egham, Surrey TW20 0EX, United Kingdom
Sw. Banerjee
D. N. Brown
C. L. Davis
University of Louisville, Louisville, Kentucky 40292, USA
A. G. Denig
W. Gradl
K. Griessinger
A. Hafner
K. R. Schubert
Johannes Gutenberg-Universität Mainz, Institut für Kernphysik, D-55099 Mainz, Germany
R. J. Barlow
Now at: University of Huddersfield, Huddersfield HD1 3DH, UK
G. D. Lafferty
University of Manchester, Manchester M13 9PL, United Kingdom
R. Cenci
A. Jawahery
D. A. Roberts
University of Maryland, College Park, Maryland 20742, USA
R. Cowan
Massachusetts Institute of Technology, Laboratory for Nuclear Science, Cambridge, Massachusetts 02139, USA
S. H. RobertsonabR. M. SeddonbInstitute of Particle Physics; McGill Universityb, Montréal, Québec, Canada H3A 2T8
N. NeriaF. PalomboabINFN Sezione di Milanoa; Dipartimento di Fisica, Università di Milanob, I-20133 Milano, Italy
L. Cremaldi
R. Godang
Now at: University of South Alabama, Mobile, Alabama 36688, USA
D. J. Summers
University of Mississippi, University, Mississippi 38677, USA
P. Taras
Université de Montréal, Physique des Particules, Montréal, Québec, Canada H3C 3J7
G. De Nardo
C. Sciacca
INFN Sezione di Napoli and Dipartimento di Scienze Fisiche, Università di Napoli Federico II, I-80126 Napoli, Italy
G. Raven
NIKHEF, National Institute for Nuclear Physics and High Energy Physics, NL-1009 DB Amsterdam, The Netherlands
C. P. Jessop
J. M. LoSecco
University of Notre Dame, Notre Dame, Indiana 46556, USA
K. Honscheid
R. Kass
Ohio State University, Columbus, Ohio 43210, USA
A. GazaM. MargoniabM. PosoccoaG. SimiabF. SimonettoabR. StroiliabINFN Sezione di Padovaa; Dipartimento di Fisica, Università di Padovab, I-35131 Padova, Italy
S. Akar
E. Ben-Haim
M. Bomben
G. R. Bonneaud
G. Calderini
J. Chauveau
G. Marchiori
J. Ocariz
Laboratoire de Physique Nucléaire et de Hautes Energies,
Sorbonne Université, Paris Diderot Sorbonne Paris Cité, CNRS/IN2P3, F-75252 Paris, France
M. BiasiniabE. ManoniaA. RossiaINFN Sezione di Perugiaa; Dipartimento di Fisica, Università di Perugiab, I-06123 Perugia, Italy
G. BatignaniabS. BettariniabM. CarpinelliabAlso at: Università di Sassari, I-07100 Sassari, Italy
G. CasarosaabM. ChrzaszczaF. FortiabM. A. GiorgiabA. LusianiacB. OberhofabE. PaoloniabM. RamaaG. RizzoabJ. J. WalshaL. ZaniabINFN Sezione di Pisaa; Dipartimento di Fisica, Università di Pisab; Scuola Normale Superiore di Pisac, I-56127 Pisa, Italy
A. J. S. Smith
Princeton University, Princeton, New Jersey 08544, USA
F. AnulliaR. FacciniabF. FerrarottoaF. FerroniaAlso at: Gran Sasso Science Institute, I-67100 L’Aquila, Italy
A. PilloniabG. PireddaaINFN Sezione di Romaa; Dipartimento di Fisica, Università di Roma La Sapienzab, I-00185 Roma, Italy
C. Bünger
S. Dittrich
O. Grünberg
M. Heß
T. Leddig
C. Voß
R. Waldi
Universität Rostock, D-18051 Rostock, Germany
T. Adye
F. F. Wilson
Rutherford Appleton Laboratory, Chilton, Didcot, Oxon, OX11 0QX, United Kingdom
S. Emery
G. Vasseur
IRFU, CEA, Université Paris-Saclay, F-91191 Gif-sur-Yvette, France
D. Aston
C. Cartaro
M. R. Convery
J. Dorfan
W. Dunwoodie
M. Ebert
R. C. Field
B. G. Fulsom
M. T. Graham
C. Hast
W. R. Innes
P. Kim
D. W. G. S. Leith
S. Luitz
D. B. MacFarlane
D. R. Muller
H. Neal
B. N. Ratcliff
A. Roodman
M. K. Sullivan
J. Va’vra
W. J. Wisniewski
SLAC National Accelerator Laboratory, Stanford, California 94309 USA
M. V. Purohit
J. R. Wilson
University of South Carolina, Columbia, South Carolina 29208, USA
A. Randle-Conde
S. J. Sekula
Southern Methodist University, Dallas, Texas 75275, USA
H. Ahmed
St. Francis Xavier University, Antigonish, Nova Scotia, Canada B2G 2W5
M. Bellis
P. R. Burchat
E. M. T. Puccio
Stanford University, Stanford, California 94305, USA
M. S. Alam
J. A. Ernst
State University of New York, Albany, New York 12222, USA
R. Gorodeisky
N. Guttman
D. R. Peimer
A. Soffer
Tel Aviv University, School of Physics and Astronomy, Tel Aviv, 69978, Israel
S. M. Spanier
University of Tennessee, Knoxville, Tennessee 37996, USA
J. L. Ritchie
R. F. Schwitters
University of Texas at Austin, Austin, Texas 78712, USA
J. M. Izen
X. C. Lou
University of Texas at Dallas, Richardson, Texas 75083, USA
F. BianchiabF. De MoriabA. FilippiaD. GambaabINFN Sezione di Torinoa; Dipartimento di Fisica, Università di Torinob, I-10125 Torino, Italy
L. Lanceri
L. Vitale
INFN Sezione di Trieste and Dipartimento di Fisica, Università di Trieste, I-34127 Trieste, Italy
F. Martinez-Vidal
A. Oyanguren
IFIC, Universitat de Valencia-CSIC, E-46071 Valencia, Spain
J. AlbertbA. BeaulieubF. U. BernlochnerbG. J. KingbR. KowalewskibT. LueckbI. M. NugentbJ. M. RoneybR. J. SobieabN. TasneembInstitute of Particle Physics; University of Victoriab, Victoria, British Columbia, Canada V8W 3P6
T. J. Gershon
P. F. Harrison
T. E. Latham
Department of Physics, University of Warwick, Coventry CV4 7AL, United Kingdom
R. Prepost
S. L. Wu
University of Wisconsin, Madison, Wisconsin 53706, USA
Abstract
A study of the two body decays X, where X refers to one charmonium state, is reported by the BABAR collaboration
using a data sample of 424 . The absolute determination of branching fractions for these decays are significantly improved compared to previous BABAR measurements. Evidence is found for the decay at the level. The absolute branching fraction (stat)0.3(syst)) is measured for the first time. It follows that %, supporting the hypothesis of a molecular component for this resonance.
In two-body decays , the particle is predominantly a
system with large available
phase space. Many charmonium states are thus produced, with approximately equal rates when no strong selection rules apply quigg .
They have mostly been
observed using an exclusive reconstruction of the charmonium state
(, , , , , ), with possibly the associated observation of the decay babar1 ; belle2 . The exotic charmonium state , also known as , has also been reconstructed in this way bellex38 ; babarx38 .
The determination of the absolute branching fraction ( ) leads to the absolute ( ), bringing useful information regarding the complex nature of the . The original tetraquark model maiani predicts this branching fraction to be about 50%. A more refined tetraquark model maiani2 can accommodate a much smaller branching fraction, but requires another particle, , not yet observed. Various molecular models braaten ; barnes ; ortega predict this branching fraction to be %.
Using the total width determination based on its line shape, or an upper limit on this quantity, information is provided on the partial width ), for which a wide range of predictions exist, from 1.3 MeV in the case of a pure charmonium state swanson , to about 100 keV for molecular models braaten .
In this study, we adopt a technique, pioneered by BABARcharmo2005 and re-used by Belle belle:similar , based on the measurement in the rest frame of the kaon momentum spectrum, where each
two-body decay is identified by its monochromatic kaon. Taking advantage of the decay to a meson pair, the center-of-mass frame is determined event-by-event by fully reconstructing the other meson. The branching fractions
for the two-body decays X can thus be measured
independently of any a priori knowledge of the decay properties.
We use a data sample with an integrated luminosity of 424 fb-1babarlumi , collected with the
BABAR detector at the PEP-II storage ring, at a center-of-mass energy corresponding to the
mass.
Charged tracks are reconstructed with a 5-layer silicon vertex
tracker (SVT) and a 40-layer drift chamber (DCH), located in a 1.5 T
magnetic field generated by a superconducting solenoidal magnet.
The energies of photons and electrons are
measured with a CsI(Tl) electromagnetic calorimeter (EMC).
Charged hadron identification is performed using ionization measurements
in the SVT and DCH and using a ring-imaging Čerenkov detector (DIRC).
The instrumented flux return of the solenoid (IFR) is used to identify muons.
A detailed description of the BABAR detector can be found in Ref. babardet1 ; babardet2 .
The analysis method is similar to that presented in Ref. charmo2005 . The complete reconstruction of one of the two mesons provides access to the rest frame of the other meson. For signal events, two-body decays to , the kaon momentum in the center-of-mass frame, , exhibits a peak for each particle, with mass , where
and are the masses of the and mesons and is the kaon energy in the rest frame.
The spectrum contains, besides a series of signal peaks,
a background due to kaons from non-two-body decays or
from decays of charmed mesons. We determine the observed number of each charmonium resonance
from a fit to the kaon momentum distribution.
Event selection requires the reconstruction of a tagging meson (-tag) from decays, where the seed is a fully reconstructed , , , or meson, and
represents a combination of , , , and hadrons fullreco . For each mode, a purity (defined as , where is the number of signal events and the number of background events) larger than 0.08 is required.
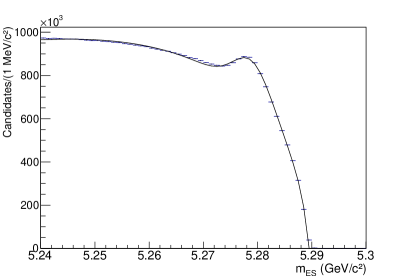
The number of candidates is determined with a fit, shown in Fig. 1, to the
distribution of the -energy-substituted mass, . Here,
is the total center-of-mass energy, determined from the beam parameters, and is the measured momentum of the reconstructed in the rest frame.
The fit function is the sum of a Crystal Ball function crystalball describing the
signal and an ARGUS function argus for the background.
Figure 1: The distribution of the exclusively reconstructed , with the fit result superimposed.
The number of fully reconstructed decays found by the fit is . The systematic uncertainty is dominated by the background shape near the kinematic end point. This event yield is mentioned for reference but is not used in the determination of the branching ratios, except for the cross-check on BR( ).
If more than one candidate is found in an event, all candidates are retained. This is an important difference compared to Refs. charmo2005 and belle:similar , where only one candidate per event is retained. This method increases the efficiency and provides better decoupling between the signal and tag sides. Events not considered before, where the candidate selected as the best one was not the correct one, are now retained, including those where it belonged to the signal side. This point is important for the measurement because the probability to reconstruct a candidate from the signal side is enhanced for particles decaying to mesons. The new method provides efficiency gains up to a factor 3.
The mean number of -tag candidates per event is 1.85 and 39% of events have more than one candidate.
Event selection criteria are as follows: Each -tag candidate should have GeV/
and be accompanied by an opposite-sign kaon candidate (charge conjugation is always implied), passing a tight particle identification selection. The pion contamination in this kaon sample is below 2%. A neural network (NN) is then used to suppress the continuum background.
The inputs to the NN are seven variables related to the reconstructed
characteristics, to its production kinematics, to the topology of the full
event, and to the angular correlation between the reconstructed and the
rest of the event.
The NN selection has an 80% efficiency for generic events and a factor 10 rejection against non- background events coming from , or quark-antiquark pairs.
A second NN is used to reject secondary kaons produced in -daughter meson decays. This is a large background that increases rapidly with decreasing kaon momentum.
In the rest frame, the secondary kaons are embedded in the decay products, which, given the boost of the meson and its mass, are bounded in a cone and form a wide jet, whereas signal-kaons recoil against a
massive (3 to 4 GeV/) state and tend to be more isolated, with the rest of the decay products being more spherical. The input variables to this NN are: the energy contained in a cone around the kaon track, the sphericity of the system recoiling against the kaon, the angle between the kaon and the thrut axis of the recoiling system, the minimum mass formed with the kaon and the recoiling particles supplement .
The two NN are then combined in a single neural net, called SuperNN, to optimize further the signal to background.
Because of the non-negligible variation of the event topology with the mass of the charmonium particle, the SuperNN is trained separately in the and signal region, and in the and region, with kaon background taken from simulation in the momentum ranges 1.6–1.9 and 1.2–1.5 GeV/, respectively.
The SuperNN performance corresponds to a 72% signal efficiency at the peak and a background rejection factor varying between three in the and region to 4.5 in the region.
To analyze the kaon momentum spectrum we first determine the background shape and second perform a fit to the background-subtracted spectrum.
The shape of the background spectrum is determined by interpolating through regions where no signal is expected, below 1.1 and above 1.9 GeV/. Because the use of only these two regions leads to large uncertainty in the background parameters, we add data points in the two regions 1.34–1.36 GeV/ and 1.53–1.57 GeV/, where there is no peak, as indicated on Fig. 2.
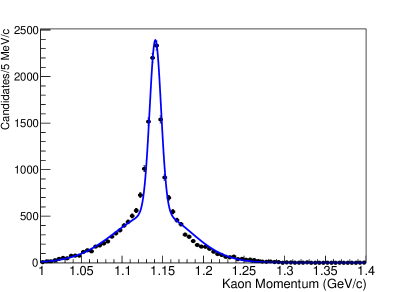
Figure 2 also shows the fit to the simulated signal momentum spectrum for all charmonia peaks in the simulation. A good description is obtained when using, for each peak, a narrow Gaussian, whose width depends on momentum varying from 13 MeV/ for the to 9 MeV/ for the , and a two-piece Gaussian, 100 MeV/ wide on the left and 60 MeV/ wide on the right. A similar fit is performed for the with a dedicated Monte Carlo sample (Fig. 3). The narrow Gaussian width is measured to be 7 MeV/ and the wide Gaussian tails are 47 MeV/ on each side. All parameters describing the shapes of the signal peaks are fixed to these values in the fit to data. The wide Gaussian is associated with candidates where the -tag has a reconstructed in the signal region but is not built with the correct set of decay products and, therefore, provides an incorrect boost. The presence of mesons in or leads to a higher background under the peak, leading to a large wide gaussian component, and a higher efficiency for the : the MC efficiency is found to be (482)% and (250.7)% for using the low and high mass training, respectively, (512)% for , (563)% for , (613)% for , and (772)% for .
When using the intermediate points to interpolate the background, the tails from the and peaks extending into these intermediate regions are subtracted using the simulation with the known branching fractions PDG .
The fit function is a product of fifth-order Chebyshev polynomials and an exponential function.
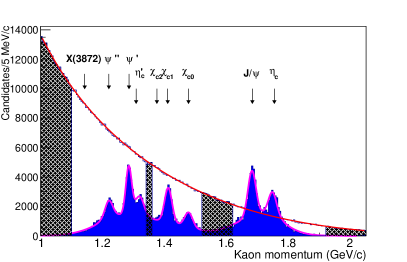
Figure 2: The momentum spectrum for simulated events where no signal kaons are present. The MC statistics represent 3.5 times BABAR integrated luminosity. The hatched areas correspond to the
zones used to fit the polynomial background. The filled blue histogram is the signal-only momentum spectrum in simulated events. The purple line represents the fit to this distribution.
Small deviations are observed in the simulation between the background kaon momentum distribution and the fit function supplement . These defects in background shape do not affect the visibility of narrow peaks, such as that of the since the expected width of 7 MeV/ is much smaller than the MeV/ typical width of the local deviations. The observed residuals in the 1.1 to 1.2 GeV/ region are corrected for, and the resulting uncertainty taken into account.
Figure 3: Fit to the signal-only momentum spectrum in simulated events.
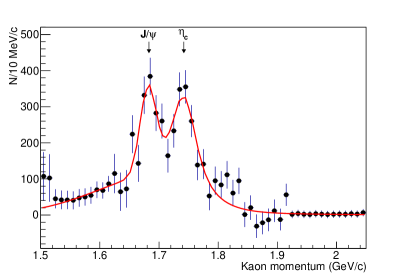
The kaon spectrum between 1.5 and 2 GeV/ is expected to exhibit two peaks, one at GeV/ corresponding to the and a second at GeV/ for the . The SuperNN is trained in the – region and the SuperNN output is required to be with a purity larger than 0.08.
A fit to the background-subtracted spectrum is performed with the two signal functions determined above, the only free parameters being the charmonia yields. Fig. 4 displays the results, with the yields: and . The statistical precision is 8%, a factor of about two improvement compared to Ref. charmo2005 .
Figure 4: The background-subtracted kaon momentum spectrum for data in the region with fit result superimposed.
The branching fraction is computed using the world average PDG and the ratio of the yields quoted above, to obtain:
where the systematic uncertainty is detailed in Table 1, and “ref” refers to the uncertainty in ( PDG .
This result agrees with the world average, PDG . As a cross-check, is also extracted from the ratio of observed events obtained in data and simulation: , in agreement with the world average.
The higher-mass region was blinded during the initial part of the analysis. Here, the SuperNN is trained in the region and the SuperNN output is required to be 0.6 with a purity larger than 0.10. The spectrum is fitted using the same procedure as above. The background shape is determined using a fit
to the signal-free region after correction for the small residual signal in that region estimated from MC simulation.
The kaon spectrum before (after) background subtraction is displayed in Fig. 5 (Fig. 6).
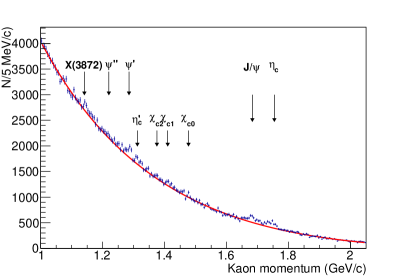
Figure 5: The kaon momentum spectrum after applying final selection criteria and before background subtraction. The red line is the interpolated function describing the background shape. The arrows indicate the values at which a signal for each resonance is expected.
The fit to the background-subtracted signal spectrum (Fig. 6) is a sum of nine signal-peak functions corresponding to the , , , , , , , , and . The peak locations are taken from Ref. PDG and the widths from fits to MC signal samples and include both detector resolution and the natural width of each resonance. The peak labelled refers to both and since these two states cannot be distinguished from each other in this analysis. A binned maximum
likelihood fit is performed, with the nine charmonium yields as free parameters.
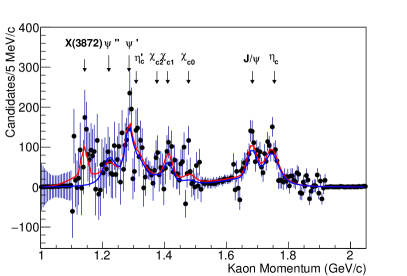
Table 2 contains the fit results. Signal peaks are visible for , , , supplement , and . A separate fit in which the signal is forced to 0 has a larger than that of the nominal fit by 11.1 units, which reduces to 9.0 when accounting for the uncertainty in the background shape in the 1.1 to 1.2 GeV/ region. Thus, there is 3 evidence of the decay , detected for the first time using this recoil technique.
Figure 6: The background-subtracted kaon momentum spectrum between 1 and 2.05 GeV/. The fit function (red) includes signal peaks for nine particles, indicated by the arrows. The fit function where the X(3872) yield is forced to 0 is drawn in blue.
Systematic uncertainties mainly stem from the imperfect description of the data by the simulation, and are computed for the five particles having significance . An extra uncertainty is added for the X(3872) for the limited knowledge of its decay modes.
•
Peak position.
A deviation from the known peak position can induce an uncertainty in the number of events from the fit integral, estimated at 1%.
•
Signal shape. Four parameters are used to describe the signal shape: the main narrow width of the signal peak, the widths of the left-hand side and right-hand side Gaussian tails, and the fraction under the narrow Gaussian. The uncertainty resulting from the uncertainty in the signal shape is estimated using the fit to the simulation sample containing only true kaons from two-body decays by comparing the fit results with the true numbers of events.
When the resonance has a non-negligible natural width, as for the , the uncertainty in this width is included.
•
Background subtraction. The statistical uncertainty of the background fit is propagated, including correlations, into the statistical uncertainty and is not a systematic uncertainty. The systematic uncertainties stem from different background parametrizations and from the correction due to the signal subtraction in the 1.1 to 1.2 GeV/ region. This latter uncertainty is determined as the change to the yield introduced by a one-sigma deviation of the correction function.
•
Efficiency determination. Uncertainties in detection efficiency arise in the kaon reconstruction and particle identification, and in the SuperNN-based selection. These uncertainties cancel to a good approximation in the ratios of the branching fractions of all resonances to the .
•
X(3872) decay model. The signal shape is not the same for and X decays and this effect induces a small change in the signal yield in the fit. Varying the ratio between these two types of decays leads to a 5% additional uncertainty.
Table 1 summarizes the various systematic uncertainties, and Table 2 summarizes the branching fraction results.
Uncertainty source
identification
1
2
2
2
5
Decay model
-
-
1
-
5
Efficiency
0
2
2
2
5
: peak position
2
2
8
2
2
: signal narrow width
1
1
1
1
1
: signal wide width
5
5
5
5
5
: narrow width fraction
2
2
2
2
2
: background shape
-
13
12
13
13
Decay width
1
-
1
-
-
Correction in signal-free regions
-
-
-
-
4
Total
6
14.5
15.1
14.6
16.3
Table 1: Summary of relative systematic uncertainties (in %) for the , , , , and branching fractions, relative to .
Table 2: Results from fits to the kaon momentum spectrum. stands for the branching fraction for X. An additional 3% uncertainty must be added to these results, reflecting the present knowledge of the reference ( ). The significance of each peak refers to the increase of the fit when removing each resonance in turn.
The number of events is converted into an absolute branching fraction using the number of observed events, its absolute branching fraction, and the relative efficiency ratio, with the result:
.
Using the measured product branching fraction PDG , this translates into . From this, an upper limit on the partial width can be set in the 100 keV range, using 3 MeV as an upper limit for the total width, as measured in its decay channel babardd ; belledd .
Our measurement therefore suggests that the has a significant molecular component.
We report an update to our first analysis charmo2005 with the full BABAR statistics. Two new features are introduced: the inclusion of all candidates has led to an increase of efficiency and a better separation between signal and tag sides of an event; the fit to a polynomial background in regions where no signal is present reduces the statistical and systematic uncertainties related to the background subtraction. We obtain the following results:
This result will certainly contribute to the determination of the complex nature of the X(3872) particle.
We are grateful for the
extraordinary contributions of our PEP-II colleagues in
achieving the excellent luminosity and machine conditions
that have made this work possible.
The success of this project also relies critically on the
expertise and dedication of the computing organizations that
support BABAR.
The collaborating institutions wish to thank
SLAC for its support and the kind hospitality extended to them.
This work is supported by the
US Department of Energy
and National Science Foundation, the
Natural Sciences and Engineering Research Council (Canada),
Institute of High Energy Physics (China), the
Commissariat à l’Energie Atomique and
Institut National de Physique Nucléaire et de Physique des Particules
(France), the
Bundesministerium für Bildung und Forschung and
Deutsche Forschungsgemeinschaft
(Germany), the
Istituto Nazionale di Fisica Nucleare (Italy),
the Foundation for Fundamental Research on Matter (The Netherlands),
the Research Council of Norway, the
Ministry of Science and Technology of the Russian Federation, and the
Particle Physics and Astronomy Research Council (United Kingdom).
Individuals have received support from
CONACyT (Mexico),
the A. P. Sloan Foundation,
the Research Corporation,
and the Alexander von Humboldt Foundation.
References
(1)
C. Quigg, FERMILAB-Conf-04/033-T, and hep-ph/0403187, and references therein.
(2)
B. Aubert et al. (BABAR Collaboration), Phys. Rev. D 67, 032002 (2003).
(3)
S. K. Choi et al. (Belle Collaboration), Phys. Rev. Lett. 89, 102001 (2002).
(4)
S. K. Choi et al. (Belle Collaboration), Phys. Rev. D 84, 052004 (2011).
(5)
B. Aubert et al. (BABAR Collaboration), Phys. Rev. D 77, 111101 (2008).
(6)
L. Maiani et al., Phys. Rev. D 71, 014028 (2005).
(7)
L. Maiani et al., Phys. Rev. Lett. 99, 182003 (2007).
(8)
E. Braaten et al., Phys. Rev. D 72, 054022 (2005).
(9)
T. Barnes, S. Godfrey, Phys. Rev. D 69, 054008 (2004).
(10)
P. G. Ortega, E. R. Arriola, Chin.Phys. C43 12, 124107 (2019).
(11)
E. Swanson, Phys. Lett. B 588, 189 (2004).
(12)
B. Aubert et al. (BABAR Collaboration), Phys. Rev. Lett. 96, 052002 (2006).
(13)
Y. Kato et al. (Belle Collaboration), Phys. Rev. D 97, 012005 (2018).
(14)
J.P. Lees et al. (BABAR Collaboration), Nucl. Instr. and Methods A 726, 203 (2013).
(15)
B. Aubert et al. (BABAR Collaboration), Nucl. Instum. and Meth. A 479, 1 (2002).
(16)
B. Aubert et al. (BABAR Collaboration), Nucl. Instr. Meth. A 729, 615 (2013).
(17)
B. Aubert et al. (BABAR Collaboration), Phys. Rev. Lett. 109, 101802 (2012).
(18)
T. Skwarnicki et al., DESY-F31-86-02.
(19)
H. Albrecht et al. (ARGUS Collaboration),
Phys. Lett. B318, 397 (1993).
(20)
See Supplemental Material at [URL will be inserted by publisher] for the performance of the topological NN (Fig. 1), for the distribution of the residues to the fit in MC, as function of kaon momentum (Fig. 2), for the analysis results, when optimized in the - region, as function of momentum (Fig.3), and of recoil mass (Fig. 4).
(21)
M. Tanabashi et al. (Particle Data Group), Phys. Rev. D 98, 030001 (2018) and 2019 update.
(22)
B. Aubert et al. (BABAR Collaboration), Phys. Rev. D 77, 011102 (2008).
(23)
T. Aushev et al. (Belle Collaboration), Phys. Rev. D 81, 031103 (2010).