Asymmetry between galaxies with different spin patterns: A comparison between COSMOS, SDSS, and Pan-STARRS
Abstract
Previous observations of a large number of galaxies show differences between the photometry of spiral galaxies with clockwise spin patterns and spiral galaxies with counterclockwise spin patterns. In this study the mean magnitude of a large number of clockwise galaxies is compared to the mean magnitude of a large number of counterclockwise galaxies. The observed difference between clockwise and counterclockwise spiral galaxies imaged by the space-based COSMOS survey is compared to the differences between clockwise and counterclockwise galaxies imaged by the Earth-based SDSS and Pan-STARRS around the same field. The annotation of clockwise and counterclockwise galaxies is a fully automatic process that does not involve human intervention or machine learning, and in all experiments both clockwise and counterclockwise galaxies are separated from the same fields. The comparison shows that the same asymmetry was identified by all three telescopes, providing strong evidence that the rotation direction of a spiral galaxy is linked to its luminosity as measured from Earth. Analysis of the luminosity difference using a large number of galaxies from different parts of the sky shows that the difference between clockwise and counterclockwise galaxies changes with the direction of observation, and oriented around an axis.
1 Introduction
The spin direction pattern of a spiral galaxy depends on the perspective of the observer, and therefore galaxies with clockwise spin patterns are expected to be identical in their other characteristics to galaxies with counterclockwise spin patterns. However, recent Earth-based observations based on large collections of galaxy images have shown evidence of statistically significant difference between the photometry of spiral galaxies that spin clockwise spiral galaxies that spin counterclockwise (Shamir,, 2013, 2016; Shamir, 2017a, ; Shamir, 2017c, ; Shamir, 2017b, ). The photometric difference between spiral galaxies with opposite spin directions was first observed by identifying subtle color differences between clockwise and counterclockwise galaxies (Shamir,, 2013). A stronger statistical significance of the photometric differences was measured by using machine learning (Shamir,, 2016). A machine learning system trained on the photometric variables of clockwise and counterclockwise galaxies was able to predict the spin direction of a galaxy in accuracy much greater than the expected 50% random accuracy. The probability of having such classification accuracy by mere chance is much smaller than . The experiment was repeated with manually and automatically annotated sets of spiral galaxies, leading to very consistent results, with very strong statistical significance (Shamir,, 2016). The almost perfect agreement between experiments done with manually classified galaxies and experiments that used automatically annotated galaxies (Shamir,, 2016) substantially reduces the possibility that the asymmetry is driven by human bias or by a computer error. The dataset was too small to identify specific photometric variables that differentiate between galaxies with opposite spin directions, but it provided strong evidence of a link between the photometry of a galaxy and its spin direction (Shamir,, 2016).
Experiments with galaxies (Kuminski and Shamir,, 2016; Paul et al.,, 2018) showed significant difference (P) between the brightness of galaxies with clockwise spin patterns and the brightness galaxies with counterclockwise spin patterns (Shamir, 2017c, ). The experiments also showed that the photometric differences changed with the direction of observation (Shamir, 2017c, ). These observations are consistent across SDSS and Pan-STARRS, both showing the same profile of the asymmetry (Shamir, 2017b, ). Repeating the same experiment with manually classified galaxies also showed the same results, providing additional evidence that the asymmetry is not likely the result of a computer error (Shamir, 2017b, ). The fact that two different telescopes and two different analysis methods provide the same profile of the asymmetry indicates that the asymmetry is not a feature of an anomaly in a specific instrument or photometric pipeline. The most likely axis around which the asymmetry is oriented is (), which is roughly aligned with the galactic pole at (). Data for all of these experiments are publicly available (Shamir,, 2016; Shamir, 2017a, ; Shamir, 2017c, ; Shamir, 2017b, ).
Identifying differences between clockwise and counterclockwise galaxies requires large databases of thousands of galaxies, which became available in the post-information era of astronomy. The first attempts to study a possible asymmetry between clockwise and counterclockwise galaxies using large datasets were done by manual annotation of the galaxy images by their spin patterns (Iye and Sugai,, 1991; Land et al.,, 2008; Longo,, 2011). An experiment by Iye and Sugai, (1991) was based on manual galaxy classification of 8,287 galaxies, 6,525 of them had an identifiable spin pattern. Comparison of the number of galaxies of each spin pattern did not show statistically significant difference. Another attempt to compare the number of galaxies of each spin pattern was done by the Galaxy Zoo citizen science campaign. By using the substantial human labor available through citizen science, the experiment focused on counting the number of galaxies manually classified by their spin pattern, and did not show statistically significant difference between the number of clockwise and counterclockwise galaxies (Land et al.,, 2008). However, like in (Iye and Sugai,, 1991), the experiment was limited by a relatively small dataset of galaxies. The manual annotation of clockwise and counterclockwise galaxies also led to substantial bias, as humans tend to misidentify galaxies that spin counterclockwise as elliptical galaxies (Hayes et al.,, 2016), leading to a systematic bias in the dataset. Analysis (Shamir, 2017b, ) of the average brightness of the clockwise and counterclockwise galaxies classified by Galaxy Zoo as “superclean” labels (meaning that 95% or more of the voters agreed on the annotation) showed that the difference was in agreement with the direction and magnitude of the difference observed in (Shamir, 2017c, ), but due to the small size of the Galaxy Zoo “superclean” dataset no statistically significant difference or indifference could be determined (Shamir, 2017b, ). Longo, (2011) used four undergraduate students to sort SDSS galaxies by their spin pattern, and showed possible differences between the number of clockwise and counterclockwise galaxies in the dataset, that responds to the direction of observation. Computer annotation of galaxies provided much larger and more consistent datasets, showing differences in the population of clockwise and counterclockwise galaxies in different parts and the sky (Shamir,, 2012) and different redshift ranges (Shamir, 2019a, ), also showing multipole alignment of the asymmetry (Shamir, 2019b, ).
While the previous experiments showed that the brightness and color differences between galaxies with opposite spin patterns exist in the entire sky as observed from Earth (Shamir,, 2013, 2016; Shamir, 2017a, ; Shamir, 2017c, ; Shamir, 2017b, ), this paper is focused on a certain part of the sky, but imaged by three different telescopes. Two of these telescopes are ground-based, and one is space-based. The results show that all three telescopes show the same asymmetry.
2 Data
The dataset is galaxies imaged by the Cosmic Evolution Survey (COSMOS) survey of the Hubble Space Telescope (HST), as well as data collected by the Panoramic Survey Telescope and Rapid Response System (Pan-STARRS) and the Sloan Digital Sky Survey (SDSS). The COSMOS field (Scoville et al.,, 2007; Koekemoer et al.,, 2007; Capak et al.,, 2007) is the largest Hubble Space Telescope survey, covering a field of 2 square degrees, centered at (, ). It is a mosaic of 575 neighboring images taken in a total exposure time of 1000 hours.
Because the experiment is focused on galaxies with clear identifiable morphology, just extended sources with 5 magnitude or brighter were used. Each galaxy image was separated from the F814W band images using Montage (Berriman et al.,, 2004). That provided a dataset of 114,630 galaxies. The galaxy images were then classified by their spin pattern (clockwise and counterclockwise) as was done in (Shamir,, 2016; Shamir, 2017a, ; Shamir, 2017b, ; Shamir, 2017c, ). The classification was done by first applying the Ganalyzer algorithm (Shamir, 2011a, ). Ganalyzer works by converting each galaxy image into its radial intensity plot, and then detecting the peaks of pixel intensities at different radii from the galaxy center. These peaks correspond to the arms of the galaxy. The sign of the linear regression of these peaks at different radial distances from the center is sensitive to the shape of the arm, and therefore determines the spin pattern of the galaxy. Detailed information about Ganalyzer and its application to the identification of spin patterns of spiral galaxies can be found in (Shamir, 2011a, ; Hoehn and Shamir,, 2014; Shamir,, 2016), and the source code is available through the Astrophysics Source Code Library (Shamir, 2011b, ). An important advantage of Ganalyzer is that it is a model-driven algorithm that works in an intuitive manner that is easy to understand, and it is not based on machine learning methods such as deep convolutional neural networks (DCNN). DCNNs are effective methods in image classification, and have been becoming popular for image classification tasks in the past few years. However, DCNNs are based on non-intuitive automatically-generated set of rules that are difficult to understand. Because these networks are trained with manually annotated “ground truth” data, they can capture human biases and result in systematically biased classifiers, leading to a consistent error in the annotation when a high number of galaxies are classified.
After the galaxies were classified automatically, a thorough manual process was applied to ensure that all galaxies are classified correctly (Shamir,, 2016). The process of manual classification was repeated twice, such that in the second pass the galaxies were mirrored to ensure that the dataset is not affected by a possible human bias. In the end of that long labor-intensive process, a random set of 200 galaxies were selected randomly, and careful examination of the galaxies showed that all classifications were correct. It is therefore very reasonable to assume that the dataset is clean, and that the galaxies are classified correctly.
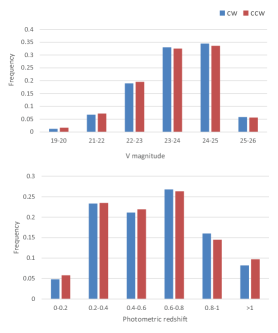
Since the dataset contained just spiral galaxies with clear spin patterns, the majority of the galaxies were rejected during the process of galaxy classification, as most of them did not have identifiable spin patterns, or were not spiral galaxies. When the process was completed, the dataset contained 5122 galaxies with identifiable spin patterns. These galaxies have mean g magnitude of 23.1 (), V magnitude of 22.58 (), and mean redshift of 0.6 (). These galaxies are clearly brighter than the general COSMOS galaxy population (Hasinger et al.,, 2018), since only galaxies with clear morphology that allows the identification of the spin pattern are used. Fig. 1 shows the distribution of the V magnitude as well as the photometric redshift of all galaxies in the dataset. The photometric redshift was taken from the photometric redshift catalog of COSMOS (Mobasher et al.,, 2007).
The dataset of COSMOS galaxies used in this experiment is publicly and freely available at http://people.cs.ksu.edu/~lshamir/data/assym_COSMOS/. The dataset is separated into two files in the CSV (comma separated values) file format. The first file contains information about clockwise galaxies and the other contains information about counterclockwise galaxies. Each file provides the right ascension and declination coordinates of each galaxy, as well as photometry information.
3 Results
The mean magnitudes of the different bands were computed for the 2,607 clockwise COSMOS and for the 2,515 counterclockwise galaxies. Table 1 shows the means and standard errors of the magnitude of the clockwise and counterclockwise galaxies. The table also shows the one-tail P value of the t-test of the difference between the means. The magnitudes are the Subaru AB magnitudes B, V, g, r, i, and z taken from the COSMOS photometry catalog (Capak et al.,, 2007). A one-tail P value is used here since previous Earth-based observations of SDSS showed difference in the magnitude of clockwise and counterclockwise galaxies in the part of the sky of the COSMOS field (Shamir, 2017c, ; Shamir, 2017b, ).
| Band | mean clockwise | mean counterclockwise | P (t-test) |
|---|---|---|---|
| B | 23.0520.018 | 230.018 | 0.024 |
| V | 22.6030.020 | 22.5530.02 | 0.042 |
| g | 23.1310.019 | 23.0770.019 | 0.023 |
| r | 22.2660.019 | 22.2180.02 | 0.045 |
| i | 21.7190.018 | 21.6800.018 | 0.065 |
| z | 21.3580.017 | 21.3230.018 | 0.087 |
To ensure that no error occurred in the galaxy annotation process, the galaxies were annotated again such that the galaxy images were mirrored, as was done in previous experiments (Shamir,, 2012, 2016; Shamir, 2017a, ; Shamir, 2017c, ). The galaxy images were mirrored using the ImageMagick (Still,, 2006) image processing open source tool. Table 2 shows the results, which are symmetric to the initial experiment with the non-mirrored galaxy images shown in Table 1.
| Band | mean clockwise | mean counterclockwise |
|---|---|---|
| B | 22.9980.018 | 23.0520.018 |
| V | 22.5510.020 | 22.6030.020 |
| g | 23.0720.019 | 23.1300.019 |
| r | 22.2160.020 | 22.2630.019 |
| i | 21.6600.018 | 21.7180.018 |
| z | 21.3210.018 | 21.3550.017 |
The mean is sensitive to the distribution of the galaxies, and therefore a small number of bright galaxies in one set can shift the mean and make it different from the mean in the other set. Table 3 shows the median values of the magnitude in each of the bands. The table shows that the median magnitude of counterclockwise galaxies is smaller than the median magnitude of clockwise galaxies, in agreement with the differences between the means.
| Band | median clockwise | median counterclockwise |
|---|---|---|
| B | 23.1440 | 23.1182 |
| V | 22.7483 | 22.7367 |
| g | 23.2456 | 23.2105 |
| r | 22.3602 | 22.3533 |
| i | 21.7858 | 21.7814 |
| z | 21.4497 | 21.4323 |
Another experiment was done with the same data, such that the values in each set were ordered, and the 5% smallest values and 5% largest values of each set were removed. That provided a dataset of 4,610 galaxies, which excludes the 5% lowest and highest values that can potentially shift the means. Table 4 shows the means, standard error of the means, and the one-tailed P value of the difference between the means. The results show that removing the 5% lowest and highest values from both datasets does not change the results significantly, and the difference remains statistically significant.
| Band | mean clockwise | mean counterclockwise | P (t-test) |
|---|---|---|---|
| B | 23.0710.014 | 23.0290.015 | 0.027 |
| V | 22.6330.017 | 22.5860.017 | 0.033 |
| g | 23.1560.015 | 23.1090.016 | 0.023 |
| r | 22.2900.017 | 22.2420.017 | 0.031 |
| i | 21.7380.015 | 21.6970.015 | 0.039 |
| z | 21.3820.014 | 21.3410.015 | 0.031 |
The asymmetry detected in COSMOS galaxies was compared to the asymmetry of the galaxies around the same field in SDSS and Pan-STARRS. Since SDSS and Pan-STARRS are less deep than COSMOS, the field was extended to 20o from the center of the COSMOS field. Therefore, the corners of the field used in SDSS and Pan-STARRS are , and , .
The SDSS data were taken from previous work (Shamir, 2017c, ). The number of SDSS galaxies in that field is 5447 counterclockwise galaxies and 5774 clockwise galaxies. The means and standard errors of the exponential magnitude of the clockwise and counterclockwise galaxies in that field in the different bands are shown in Table 5.
| Band | mean clockwise | mean counterclockwise | P (t-test) |
|---|---|---|---|
| u | 18.83140.013 | 18.80040.012 | 0.043 |
| g | 17.53660.012 | 17.50320.012 | 0.032 |
| r | 16.93640.012 | 16.90600.013 | 0.045 |
| i | 16.61140.012 | 16.58200.012 | 0.05 |
| z | 16.43570.013 | 16.41460.014 | 0.142 |
The table shows statistically significant differences between the exponential magnitude of clockwise galaxies and counterclockwise galaxies, except for the z band. The direction of the difference is aligned with the direction observed in the COSMOS field, in which galaxies with counterclockwise spin patterns were also brighter than galaxies with clockwise spin patterns.
A similar experiment was done with Pan-STARRS galaxies, using clockwise and counterclockwise galaxies that were used in a previous experiment (Shamir, 2017b, ). The number of Pan-STARRS galaxies in the same field was 1444 clockwise galaxies and 1438 counterclockwise galaxies, and 21% of them are also present in the SDSS dataset of the same field. The average Kron magnitudes of the galaxies with clockwise spin patterns and counterclockwise spin patterns are shown in Table 6. Like COSMOS and SDSS, Pan-STARRS also shows statistically significant differences between the brightness of galaxies with clockwise spin patterns and galaxies with counterclockwise spin patterns.
| Band | mean clockwise | mean counterclockwise | P (t-test) |
|---|---|---|---|
| g | 16.97740.022 | 16.91330.021 | 0.017 |
| r | 16.37080.021 | 16.31180.020 | 0.021 |
| i | 16.03700.021 | 15.97750.019 | 0.018 |
| z | 15.87570.021 | 15.81170.019 | 0.012 |
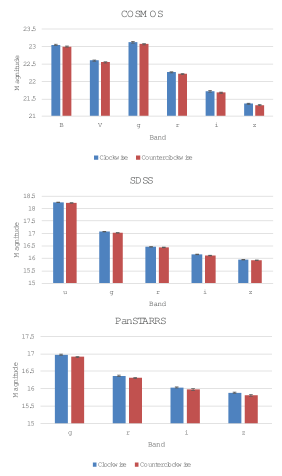
Figure 2 displays the differences between the magnitudes of clockwise and counterclockwise galaxies in each band. The observation that three different telescopes show similar asymmetry reduces the probability that the asymmetry is the result of an anomaly related to a certain telescope or photometric pipeline. Also, the statistical significance of the asymmetry when observed by three telescope is substantially stronger than the asymmetry observed in a single telescope. The mere chance probability that the g magnitude means are different in all three telescopes is . Similarly, the mere chance probabilities that the means are different in all three telescopes in the other bands are , , , for the r, i, and z bands, respectively.
4 Discussion
This paper shows that galaxy image data from SDSS, Pan-STARRS, and COSMOS (HST) exhibit photometric differences between spiral galaxies the spin clockwise and spiral galaxies that spin counterclockwise. The SDSS and Pan-STARRS galaxies used in this study are positioned around the center of the COSMOS field, to allow comparison with the COSMOS galaxies. When using galaxies from the entire sky footprint of Pan-STARRS and SDSS, the difference between the brightness of galaxies that spin clockwise and galaxies that spin counterclockwise changes with the direction of observation (Shamir, 2017b, ; Shamir, 2017a, ; Shamir, 2017c, ).
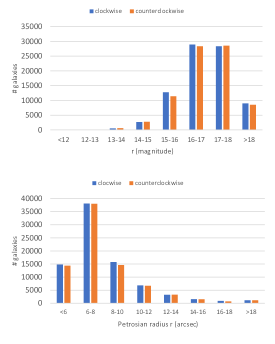
The largest dataset in that experiment was a dataset of 162,516 SDSS galaxies labeled automatically. Figure 3 shows the distribution of the radius and exponential r magnitude of the SDSS galaxies. In addition to that dataset, a separate dataset of 40,739 manually labeled spiral galaxies was also used, as well as a dataset of 29,013 Pan-STARRS galaxies labeled automatically.
Tables 7 and 8 show the mean magnitude of clockwise galaxies and counterclockwise galaxies in the RA range of , as well as the corresponding RA range in the opposite hemisphere . The tables also show the t-test P value of the difference between the means of the magnitude of clockwise and counterclockwise galaxies in all three datasets.
| Dataset | Band | Mean | Mean | t-test P |
|---|---|---|---|---|
| clockwise | counterclockwise | |||
| SDSS automatically annotated | u | 18.7820.006 | 18.7570.006 | 0.004 |
| SDSS automatically annotated | g | 17.5030.006 | 17.4820.006 | 0.016 |
| SDSS automatically annotated | r | 16.9130.006 | 16.8920.006 | 0.008 |
| SDSS automatically annotated | i | 16.5970.006 | 16.5780.006 | 0.021 |
| SDSS automatically annotated | z | 16.4350.006 | 16.4160.006 | 0.033 |
| SDSS manually annotated | u | 18.5510.008 | 18.5260.008 | 0.033 |
| SDSS manually annotated | g | 17.2730.007 | 17.2470.008 | 0.022 |
| SDSS manually annotated | r | 16.6830.007 | 16.6570.008 | 0.013 |
| SDSS manually annotated | i | 16.3590.007 | 16.3330.008 | 0.014 |
| SDSS manually annotated | z | 16.1930.008 | 16.1610.008 | 0.003 |
| Pan-STARRS | g | 17.0540.01 | 16.9860.01 | |
| Pan-STARRS | r | 16.5380.01 | 16.4710.01 | |
| Pan-STARRS | i | 16.2360.01 | 16.1710.01 | |
| Pan-STARRS | z | 16.1060.01 | 16.0380.01 | |
| Pan-STARRS | y | 15.9310.01 | 15.8970.01 |
| Dataset | Band | Mean | Mean | t-test P |
|---|---|---|---|---|
| clockwise | counterclockwise | (two tails) | ||
| SDSS automatically annotated | u | 18.8300.007 | 18.8830.007 | 3.3 |
| SDSS automatically annotated | g | 17.5080.006 | 17.5640.006 | 1.3 |
| SDSS automatically annotated | r | 16.8860.006 | 16.9370.006 | 2.1 |
| SDSS automatically annotated | i | 16.5490.006 | 16.6010.006 | 2 |
| SDSS automatically annotated | z | 16.3600.006 | 16.4150.006 | 2.43 |
| SDSS manually annotated | u | 18.6390.02 | 18.6480.02 | 0.80 |
| SDSS manually annotated | g | 17.3380.02 | 17.3470.02 | 0.76 |
| SDSS manually annotated | r | 16.7180.02 | 16.7380.02 | 0.52 |
| SDSS manually annotated | i | 16.3740.02 | 16.3980.02 | 0.44 |
| SDSS manually annotated | z | 16.1930.02 | 16.2190.02 | 0.43 |
| Pan-STARRS | g | 17.0390.01 | 17.0720.01 | 0.085 |
| Pan-STARRS | r | 16.5210.01 | 16.5500.01 | 0.092 |
| Pan-STARRS | i | 16.1950.01 | 16.2220.01 | 0.097 |
| Pan-STARRS | z | 16.0580.01 | 16.0810.01 | 0.187 |
| Pan-STARRS | y | 15.8700.01 | 15.8960.01 | 0.125 |
The exponential magnitude model was used, but other magnitude models show similar asymmetry (Shamir, 2017b, ). The Student t-test P values are very low in the RA range due to the much higher number of galaxies. In the RA range there are just 6,597 Pan-STARRS galaxies and 2,889 manually annotated SDSS galaxies, and the P values in that RA ranges are not statistically significant, possibly due to the low number of galaxies. But the automatically annotated SDSS dataset contains 51,053 galaxies, allowing stronger statistical significance. The Pan-STARRS galaxies show a statistically significant difference in the RA range of . The distribution of the clockwise and counterclockwise galaxies in different r exponential magnitudes is shown by Figure 4.
Figures 5 shows the asymmetry measured using the exponential magnitude in different RA ranges. In the manually annotated SDSS dataset the RA ranges (270o, 300o) and (60o, 90o) were not used because the dataset included galaxies with spectra, which in SDSS are rare in these RA ranges. The figure shows that in all three datasets, the asymmetry changes with the RA, and peaks around the RA range of ,180.
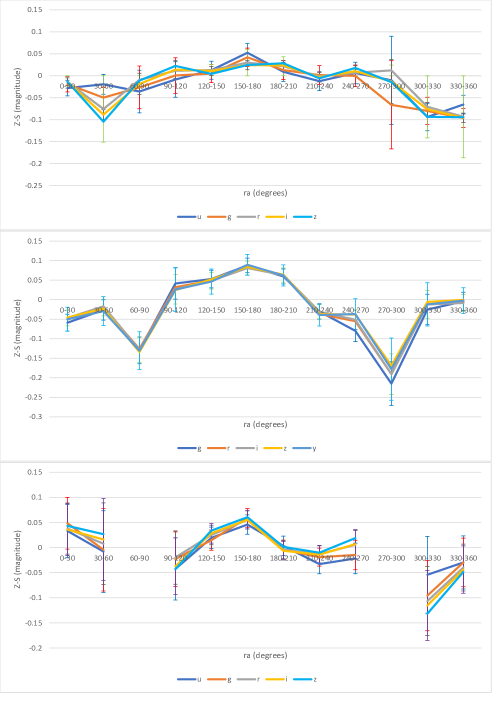
Since the asymmetry changes with the direction of observation, a flaw in the program that classifies the galaxies (Shamir, 2011b, ) is not likely, as such error is expected to exhibit itself in a consistent manner, in the form of similar asymmetry in all parts of the sky. Also, the galaxies that were classified manually showed results similar to the results of the automatic classification. These results are also aligned with the experiments described in (Shamir,, 2016), where automatically and manually classified galaxies showed nearly identical differences between the magnitude of clockwise and counterclockwise galaxies.
A possible error in the photometric measurements also cannot explain the observed asymmetry. To explain the asymmetry by a photometric measurement error, the error needs to affect clockwise galaxies differently than it effects galaxies with counterclockwise spin patterns. Moreover, the error needs to be systematic, such that the average magnitude of a large number of galaxies is changed by it. Also, since the asymmetry has a very strong and statistically significant correlation with the direction of observation, explaining that observation by a photometric measurement error requires the error to change with the direction of observation. The possibility that all of these three conditions are satisfied is extremely low, and there is no known evidence that even one of these conditions is satisfied.
All three telescopes (SDSS, Pan-STARRS, and HST) show the same asymmetry. Since the imaging conditions might be different for different exposures and different parts of the sky, galaxies imaged at one part of the sky might have different magnitude than galaxies imaged in a different part of the sky or by a different instrument. However, all experiments described here were done such that the comparisons were always done between galaxies within the same part of the sky, imaged by the same instrument, and at the same time. For instance, in the COSMOS field the magnitude of the clockwise galaxies in the degrees field centered at is compared to the magnitude of the counterclockwise galaxies in the degrees field centered at . The same is done with SDSS and Pan-STARRS: First the galaxy images are downloaded, and only then they are annotated, separated to clockwise and counterclockwise galaxies, and the magnitudes are compared. Therefore, all comparisons of the magnitudes are done between galaxies in the same field, and no attempt to compare magnitudes in different fields, different instruments, or different exposures is made. Since both the clockwise and the counterclockwise galaxies of each telescope were collected from the exact same field, the difference cannot be the result of cosmic variance (Driver and Robotham,, 2010).
As shown in (Shamir, 2017a, ; Shamir, 2017c, ; Shamir, 2017b, ), the photometric difference between clockwise and counterclockwise spiral galaxies can be observed in other parts of the sky, but the agreement between Earth-based and space-based observations shows that the asymmetry is not the result of atmospheric effects. The COSMOS field was also imaged in a relatively short time of 1000 hours, as opposed to SDSS and Pan-STARRS, in which data were acquired over a much longer period of time.
The differences in magnitude between clockwise and counterclockwise spiral galaxies can also be related to previous observations of asymmetry between the number of clockwise galaxies and the number of counterclockwise galaxies (Shamir,, 2012). When galaxies are brighter, more galaxies can be identified and counted. If the apparent magnitude of one type of galaxies is brighter than the other type, that can lead to different frequencies of the two types of galaxies as observed from Earth.
To further examine the link between the possible difference in magnitude and the distribution of clockwise and counterclockwise galaxies, the mean absolute exponential magnitude of clockwise galaxies was compared to the mean absolute exponential magnitude of counterclockwise galaxies. Since COSMOS and Pan-STARRS are not spectroscopic surveys, the comparison was done using the subset of SDSS galaxies used in (Shamir, 2017b, ) that have spectra. In that dataset, 34,761 galaxies had spectra. Of these galaxies, 17,332 had clockwise spin patterns, and 17,429 had counterclockwise spin patterns. Table 9 shows the differences between the absolute exponential magnitude of SDSS clockwise and counterclockwise galaxies with spectra.
| Band | Mean clockwise | Mean counterclockwise | P (t-test) |
|---|---|---|---|
| u | -18.7480.009 | -18.7370.008 | 0.373 |
| g | -20.0350.008 | -20.0240.008 | 0.344 |
| r | -20.6300.009 | -20.6180.009 | 0.358 |
| i | -20.9530.009 | -20.9390.009 | 0.286 |
| z | -21.1270.010 | -21.1140.009 | 0.346 |
The table shows that the differences in the subset of SDSS galaxies with spectra that cover the entire sky imaged by SDSS are not statistically significant. Since the highest asymmetry is observed in the RA range , a comparison was made with just galaxies in that part of the sky. The subset of SDSS galaxies with spectra in that sky region included 9,501 galaxies with clockwise spin patterns, and 9,642 galaxies with counterclockwise spin patterns. Table 10 shows the difference in the absolute exponential magnitude of these galaxies. Like with the subset of SDSS galaxies shown in Table 9, the differences between the absolute magnitude of clockwise and counterclockwise galaxies is not statistically significant.
| Band | Mean clockwise | Mean counterclockwise | P (t-test) |
|---|---|---|---|
| u | -18.7900.012 | -18.7940.011 | 0.808 |
| g | -20.0630.011 | -20.0670.011 | 0.800 |
| r | -20.6510.012 | -20.6540.012 | 0.8617 |
| i | -20.9700.013 | -20.9710.012 | 0.955 |
| z | -21.1430.013 | -21.1420.013 | 0.957 |
The 19,143 SDSS galaxies with spectra in the RA range make a relatively small subset of the entire dataset of SDSS galaxies. To examine the distribution of that subset compared to the entire dataset of SDSS galaxies, the apparent exponential magnitude of clockwise and counterclockwise galaxies in that dataset was compared. Table 11 shows the differences in the exponential magnitude of clockwise and counterclockwise galaxies of that subset. As the table shows, the differences are also much smaller compared to the differences observed with the entire dataset of SDSS galaxies in the RA range, and the galaxies in that subset are generally brighter than the galaxies in the entire dataset, but due to the much smaller number of galaxies with spectra it is difficult to make a solid comparison between all SDSS galaxies and the subset of SDSS galaxies with spectra.
| Band | Mean clockwise | Mean counterclockwise | P (t-test) |
|---|---|---|---|
| u | 18.5320.009 | 18.5330.009 | 0.93 |
| g | 17.2590.009 | 17.2590.009 | 1 |
| r | 16.6710.008 | 16.6730.009 | 0.87 |
| i | 16.3510.009 | 16.3560.009 | 0.69 |
| z | 16.1790.009 | 16.1840.009 | 0.69 |
To examine the same part of the sky in the opposite hemisphere, the subset of SDSS galaxies with spectra was used to compare the absolute exponential magnitude of clockwise and counterclockwise galaxies in the RA range , and the results are shown in Table 12. The table shows that the clockwise galaxies are somewhat brighter than the counterclockwise galaxies, but the difference is not statistically significant. The dataset is much smaller than the subset of galaxies with spectra in RA range , and contains just 1,880 clockwise galaxies and 1,907 counterclockwise galaxies.
| Band | Mean clockwise | Mean counterclockwise | P (t-test) |
|---|---|---|---|
| u | -18.6250.027 | -18.5940.027 | 0.41 |
| g | -19.9510.026 | -19.8870.026 | 0.08 |
| r | -20.5620.028 | -20.4950.027 | 0.08 |
| i | -20.8960.029 | -20.8230.029 | 0.07 |
| z | -21.0740.031 | -21.0030.030 | 0.1 |
Using the subset of SDSS galaxies with spectra also allows to observe the distribution of the clockwise and counterclockwise galaxies in different redshift ranges. Tables 13 through 16 show the number of clockwise and counterclockwise galaxies in different redshift ranges and different parts of the sky. The P values show the binomial probability to have equal or stronger asymmetry between the number of galaxies by chance. The tables do not show statistically significant differences between the distribution of clockwise and counterclockwise galaxies, possibly due to the small size of the sample. The tables show a higher number of counterclockwise galaxies in the RA ranges and , and higher number of clockwise galaxies in the RA ranges and . These differences are not statistically significant, and additional work will be required to analyze the distribution of clockwise and counterclockwise galaxies. It should also be noted that the objects with spectra are selected by an algorithm, are are therefore not necessarily a randomly selected sample.
| z | cw | ccw | P |
|---|---|---|---|
| 0-0.05 | 2566 | 2615 | 0.25 |
| 0.05-0.1 | 4167 | 4230 | 0.25 |
| 0.1-0.15 | 2023 | 2036 | 0.42 |
| 0.15-0.2 | 598 | 614 | 0.33 |
| 0.2-0.25 | 124 | 121 | 0.39 |
| 0.25- | 23 | 26 | 0.38 |
| Total | 9501 | 9642 | 0.15 |
| z | cw | ccw | P |
|---|---|---|---|
| 0-0.05 | 428 | 462 | 0.13 |
| 0.05-0.1 | 919 | 890 | 0.25 |
| 0.1-0.15 | 386 | 376 | 0.37 |
| 0.15-0.2 | 117 | 136 | 0.13 |
| 0.2-0.25 | 20 | 35 | 0.03 |
| 0.25- | 0 | 8 | 0.004 |
| Total | 1880 | 1907 | 0.33 |
| z | cw | ccw | P |
|---|---|---|---|
| 0-0.05 | 332 | 314 | 0.25 |
| 0.05-0.1 | 396 | 378 | 0.27 |
| 0.1-0.15 | 208 | 214 | 0.48 |
| 0.15-0.2 | 75 | 59 | 0.09 |
| 0.2-0.25 | 14 | 23 | 0.09 |
| 0.25- | 6 | 4 | 0.37 |
| Total | 1031 | 992 | 0.2 |
| z | cw | ccw | P |
|---|---|---|---|
| 0-0.05 | 1315 | 1355 | 0.22 |
| 0.05-0.1 | 2215 | 2212 | 0.49 |
| 0.1-0.15 | 1047 | 963 | 0.03 |
| 0.15-0.2 | 275 | 294 | 0.22 |
| 0.2-0.25 | 59 | 58 | 0.5 |
| 0.25- | 9 | 6 | 0.3 |
| Total | 4920 | 4888 | 0.37 |
As Figure 5 shows, the asymmetry between the brightness of galaxies with opposite directions of rotation changes based on the direction of observation. To identify the axis in which the asymmetry peaks, the two SDSS datasets were combined into a single dataset of galaxies, and the sky was separated into non-overlapping regions with half-width size of 10o (Shamir, 2017b, ). Then, the cosine dependence between the asymmetry in each sky region and the direction of observation was tested for each possible integer combination of (,).
The highest Pearson correlation coefficient was observed at (=172o,=50o), with 1 error range (132o,224o) for the right ascension, and (-26o,74o) for the declination (Shamir, 2017b, ). The position of the most likely axis is roughly aligned with the galactic pole at (, ). While it has been proposed that the Cosmic Microwave Background (CMB) is circularly polarized (Hu and White,, 1997; Cooray et al.,, 2003), the RA of the most likely axis of asymmetry is interestingly close to the RA of the Planck CMB dipole (Aghanim et al.,, 2014) at 166o. However, there is somewhat substantial difference in the declination (50o compared to -27o), which is just on the edge of the 1 error range.
The physical nature of galaxy rotation is still not fully understood. Preeminent early astronomers proposed that the galaxy rotation was aligned with Newtonian physics (De Vaucouleurs,, 1959; Schwarzschild,, 1954), which was in agreement with theory of that time, and played a role in ignoring other observations (Slipher,, 1914; Wolf,, 1914; Pease,, 1918; Babcock,, 1939; Mayall,, 1951) that showed results that disagreed with the Newtonian physics model of galaxy rotation (Sofue and Rubin,, 2001). Some early astronomers considered the nature of galaxy rotation as evidence of the existence of nonluminous (“dark”) matter (Oort,, 1940), but it was only four decades later that the observation became part of “mainstream” astronomy (Rubin,, 2000), accepting the fact that the rotation of galaxies is not driven by Newtonian physics. Since substantial part of the mass of galaxies is not luminous, galaxy rotation is also a tool to measure galaxy mass (Sofue,, 2016, 2017). Alternative models to the physics of galaxy rotation such as Conformal Gravity and Modified Newtonian Dynamics (MOND) have also been proposed, and show good agreement with observations (O’Brien et al.,, 2017; Wojnar et al.,, 2018).
While it is difficult to identify the source of the asymmetry or explain the nature of the observation with current knowledge, the physics of galaxy rotation is not yet understood. One possible explanation could be linked to the large-scale structure of the universe. If the properties of the universe change based on the direction of observation, that would be a violation of the cosmological principle, as such structures that are far larger than any known supercluster violate the isotropy and homogeneity assumptions of the cosmological principle. The clear cosine-dependence between the asymmetry and the direction of observation might be an indication of a rotating universe (Gödel,, 2000). The asymmetry between galaxies with opposite spin patterns can be also used as an additional messenger and source of information about the large-scale structure, in addition to other sources of information related to galaxies such as stellar mass growth (Alpaslan et al.,, 2016), the density distribution, galaxy shape, and the frequency of rare objects (Biagetti,, 2019). The indifference in the absolute magnitude of the galaxies might indicate on differences in the distribution of clockwise and counterclockwise galaxies in different redshift ranges, which can be related to chiral gravitational waves (Biagetti and Orlando,, 2020). However, the absolute magnitude was measured with a much smaller subset of the galaxies, and no strong conclusions can therefore be made using that smaller dataset.
However, the source of the asymmetry is not necessarily related to the large-scale structure of the universe, as it can also be related to the internal structure of galaxies or galaxy rotation. One possible explanation for a link between galaxy rotation and the observed asymmetry described in this paper is relativistic beaming. Let be a face-on spiral galaxy rotating at the same direction as the Milky Way, and is a face-on spiral galaxy identical to Galaxy , but rotating in the opposite direction of the Milky Way. Both galaxies are in the same hemisphere compared to the Milky Way.
A star moving at rotational velocity relative to the observer will have a Doppler shift of its bolometric flux of , where is the flux of the star when it is stationary relative to the observer, and is the speed of light (Loeb and Gaudi,, 2003; Rybicki and Lightman,, 2008). Assuming of the Sun of 0.001, stars in Galaxy will have a flux of , where is the flux of the stars in Galaxy . Therefore, when measuring a large population of galaxies similar to and , the mean magnitude of the galaxies will be different from the mean magnitude of the galaxies.
Let galaxy be a face-on spiral galaxy rotating in the same direction as galaxy , but located in the opposite hemisphere to relative to the Milky Way. The spin patterns of a galaxy is normally expected to agree with its actual direction of rotation (Iye et al.,, 2019). While galaxies and rotate in the same direction, their spin pattern will seem opposite to an Earth-based observer. For instance, if galaxy would seem a clockwise galaxy to an Earth-based observer, galaxy would look to an Earth-based observer as a counterclockwise galaxy. Therefore, if clockwise galaxies seem brighter than counterclockwise galaxies in one hemisphere, they are expected to seem dimmer to an Earth-based observer in the opposite hemisphere, since in the opposite hemisphere clockwise galaxies are galaxies that rotate in the opposite direction of clockwise galaxies in the first hemisphere. The asymmetry is expected to peak at the galactic pole, where the rotational velocity relative to observed face-on galaxies peaks.
If the asymmetry is indeed driven by the relative rotation directions of the observed galaxies compared to the rotation of the Milky Way, the observed differences in the magnitude of each galaxy is relative to the location of the observer. That is, from any galaxy in the universe, face-on spiral galaxies located close to its galactic pole will exhibit different brightness between clockwise and counterclockwise galaxies. That asymmetry is driven by the rotation of these galaxies relative to the galaxy of the observer. Therefore, no cosmological axis that passes through the Earth is needed to explain the observation. The axis where the asymmetry peaks will be located at around the galactic pole of the galaxy of the observer.
The calculated above is 1.008, and will lead to a maximum magnitude difference of . That difference, however, is smaller than the observed difference in SDSS, Pan-STARRS, and COSMOS. Therefore, while the asymmetry could be related to galaxy rotation, the difference corresponds to a much higher rotational velocity than the observed rotational velocity of galaxies. If the asymmetry is the result of relativistic beaming, it corresponds to a much higher rotational velocity than the actual measured rotational velocity of galaxies.
5 Acknowledgments
I would like to thank the two knowledgeable anonymous reviewers for their insightful comments and their help in improving the manuscript. This study was supported in part by NSF grants AST-1903823 and IIS-1546079.
This research is based on observations made with the NASA/ESA Hubble Space Telescope obtained from the Space Telescope Science Institute, which is operated by the Association of Universities for Research in Astronomy, Inc., under NASA contract NAS 5–26555.
Funding for the Sloan Digital Sky Survey IV has been provided by the Alfred P. Sloan Foundation, the U.S. Department of Energy Office of Science, and the Participating Institutions. SDSS-IV acknowledges support and resources from the Center for High-Performance Computing at the University of Utah. The SDSS web site is www.sdss.org.
SDSS-IV is managed by the Astrophysical Research Consortium for the Participating Institutions of the SDSS Collaboration including the Brazilian Participation Group, the Carnegie Institution for Science, Carnegie Mellon University, the Chilean Participation Group, the French Participation Group, Harvard-Smithsonian Center for Astrophysics, Instituto de Astrofísica de Canarias, The Johns Hopkins University, Kavli Institute for the Physics and Mathematics of the Universe (IPMU) / University of Tokyo, the Korean Participation Group, Lawrence Berkeley National Laboratory, Leibniz Institut für Astrophysik Potsdam (AIP), Max-Planck-Institut für Astronomie (MPIA Heidelberg), Max-Planck-Institut für Astrophysik (MPA Garching), Max-Planck-Institut für Extraterrestrische Physik (MPE), National Astronomical Observatories of China, New Mexico State University, New York University, University of Notre Dame, Observatário Nacional / MCTI, The Ohio State University, Pennsylvania State University, Shanghai Astronomical Observatory, United Kingdom Participation Group, Universidad Nacional Autónoma de México, University of Arizona, University of Colorado Boulder, University of Oxford, University of Portsmouth, University of Utah, University of Virginia, University of Washington, University of Wisconsin, Vanderbilt University, and Yale University.
The Pan-STARRS1 Surveys (PS1) and the PS1 public science archive have been made possible through contributions by the Institute for Astronomy, the University of Hawaii, the Pan-STARRS Project Office, the Max-Planck Society and its participating institutes, the Max Planck Institute for Astronomy, Heidelberg and the Max Planck Institute for Extraterrestrial Physics, Garching, The Johns Hopkins University, Durham University, the University of Edinburgh, the Queen’s University Belfast, the Harvard-Smithsonian Center for Astrophysics, the Las Cumbres Observatory Global Telescope Network Incorporated, the National Central University of Taiwan, the Space Telescope Science Institute, the National Aeronautics and Space Administration under Grant No. NNX08AR22G issued through the Planetary Science Division of the NASA Science Mission Directorate, the National Science Foundation Grant No. AST-1238877, the University of Maryland, Eotvos Lorand University (ELTE), the Los Alamos National Laboratory, and the Gordon and Betty Moore Foundation.
References
- Aghanim et al., (2014) Aghanim, N., Armitage-Caplan, C., Arnaud, M., Ashdown, M., Atrio-Barandela, F., Aumont, J., Baccigalupi, C., Banday, A., Barreiro, R., Bartlett, J., et al. (2014). Planck 2013 results. xxvii. doppler boosting of the cmb: Eppur si muove. Astronomy & Astrophysics, 571:A27.
- Alpaslan et al., (2016) Alpaslan, M., Grootes, M., Marcum, P. M., Popescu, C., Tuffs, R., Bland-Hawthorn, J., Brough, S., Brown, M. J., Davies, L. J., Driver, S. P., et al. (2016). Galaxy and mass assembly (gama): stellar mass growth of spiral galaxies in the cosmic web. Monthly Notices of the Royal Astronomical Society, 457(3):2287–2300.
- Babcock, (1939) Babcock, H. W. (1939). The rotation of the andromeda nebula. Lick Observatory Bulletin, 19:41–51.
- Berriman et al., (2004) Berriman, G., Good, J., Laity, A., Bergou, A., Jacob, J., Katz, D., Deelman, E., Kesselman, C., Singh, G., Su, M.-H., et al. (2004). Montage: a grid enabled image mosaic service for the national virtual observatory. In Astronomical Data Analysis Software and Systems (ADASS) XIII, volume 314, page 593.
- Biagetti, (2019) Biagetti, M. (2019). The hunt for primordial interactions in the large-scale structures of the universe. Galaxies, 7(3):71.
- Biagetti and Orlando, (2020) Biagetti, M. and Orlando, G. (2020). Primordial gravitational waves from galaxy intrinsic alignments. arXiv preprint arXiv:2001.05930.
- Capak et al., (2007) Capak, P., Aussel, H., Ajiki, M., McCracken, H., Mobasher, B., Scoville, N., Shopbell, P., Taniguchi, Y., Thompson, D., Tribiano, S., et al. (2007). The first release cosmos optical and near-ir data and catalog. Astrophysical Journal Supplement Series, 172(1):99.
- Cooray et al., (2003) Cooray, A., Melchiorri, A., and Silk, J. (2003). Is the cosmic microwave background circularly polarized? Physics Letters B, 554(1-2):1–6.
- De Vaucouleurs, (1959) De Vaucouleurs, G. (1959). General physical properties of external galaxies. In Astrophysik IV: Sternsysteme/Astrophysics IV: Stellar Systems, pages 311–372. Springer.
- Driver and Robotham, (2010) Driver, S. P. and Robotham, A. S. (2010). Quantifying cosmic variance. Monthly Notices of the Royal Astronomical Society, 407(4):2131–2140.
- Gödel, (2000) Gödel, K. (2000). Rotating universes in general relativity theory. General Relativity and Gravitation, 32(7):1419–1427.
- Hasinger et al., (2018) Hasinger, G., Capak, P., Salvato, M., Barger, A., Cowie, L., Faisst, A., Hemmati, S., Kakazu, Y., Kartaltepe, J., Masters, D., et al. (2018). The deimos 10k spectroscopic survey catalog of the cosmos field. Astrophysical Journal, 858(2):77.
- Hayes et al., (2016) Hayes, W. B., Davis, D., and Silva, P. (2016). On the nature and correction of the spurious s-wise spiral galaxy winding bias in galaxy zoo 1. Monthly Notices of the Royal Astronomical Society, 466(4):3928–3936.
- Hoehn and Shamir, (2014) Hoehn, C. and Shamir, L. (2014). Characteristics of clockwise and counterclockwise spiral galaxies. Astronomische Nachrichten, 335(2):189–192.
- Hu and White, (1997) Hu, W. and White, M. (1997). A cmb polarization primer. arXiv preprint astro-ph/9706147.
- Iye and Sugai, (1991) Iye, M. and Sugai, H. (1991). A catalog of spin orientation of southern galaxies. The Astrophysical Journal, 374:112–116.
- Iye et al., (2019) Iye, M., Tadaki, K., and Fukumoto, H. (2019). Spin parity of spiral galaxies i–corroborative evidence for trailing spirals. arXiv preprint arXiv:1910.10926.
- Koekemoer et al., (2007) Koekemoer, A. M., Aussel, H., Calzetti, D., Capak, P., Giavalisco, M., Kneib, J.-P., Leauthaud, A., Le Fevre, O., McCracken, H., Massey, R., et al. (2007). The cosmos survey: Hubble space telescope advanced camera for surveys observations and data processing. Astrophysical Journal Supplement Series, 172(1):196.
- Kuminski and Shamir, (2016) Kuminski, E. and Shamir, L. (2016). A computer-generated visual morphology catalog of 3̃,000,000 sdss galaxies. The Astrophysical Journal Supplement Series, 223(2):20.
- Land et al., (2008) Land, K., Slosar, A., Lintott, C., Andreescu, D., Bamford, S., Murray, P., Nichol, R., Raddick, M. J., Schawinski, K., Szalay, A., et al. (2008). Galaxy zoo: the large-scale spin statistics of spiral galaxies in the sloan digital sky survey. Monthly Notices of the Royal Astronomical Society, 388(4):1686–1692.
- Loeb and Gaudi, (2003) Loeb, A. and Gaudi, B. S. (2003). Periodic flux variability of stars due to the reflex doppler effect induced by planetary companions. Astrophysical Journal Letters, 588(2):L117.
- Longo, (2011) Longo, M. J. (2011). Detection of a dipole in the handedness of spiral galaxies with redshifts z 0.04. Physics Letters B, 699(4):224–229.
- Mayall, (1951) Mayall, N. (1951). In the structure of the galaxy. Ann Arbor: Univ. Mich. Press, 19.
- Mobasher et al., (2007) Mobasher, B., Capak, P., Scoville, N., Dahlen, T., Salvato, M., Aussel, H., Thompson, D., Feldmann, R., Tasca, L., Lefevre, O., et al. (2007). Photometric redshifts of galaxies in cosmos. Astrophysical Journal Supplement Series, 172(1):117.
- O’Brien et al., (2017) O’Brien, J. G., Chiarelli, T. L., Dentico, J., Stulge, M., Stefanski, B., Moss, R., and Chaykov, S. (2017). Alternative gravity rotation curves for the little things survey. The Astrophysical Journal, 852(1):6.
- Oort, (1940) Oort, J. H. (1940). Some problems concerning the structure and dynamics of the galactic system and the elliptical nebulae ngc 3115 and 4494. Astrophysical Journal, 91:273.
- Paul et al., (2018) Paul, N., Virag, N., and Shamir, L. (2018). A catalog of photometric redshift and the distribution of broad galaxy morphologies. Galaxies, 6(2):64.
- Pease, (1918) Pease, F. (1918). The rotation and radial velocity of the central part of the andromeda nebula. Proceedings of the National Academy of Sciences of the United States of America, 4(1):21.
- Rubin, (2000) Rubin, V. C. (2000). One hundred years of rotating galaxies. Publications of the Astronomical Society of the Pacific, 112(772):747.
- Rybicki and Lightman, (2008) Rybicki, G. B. and Lightman, A. P. (2008). Radiative processes in astrophysics. John Wiley & Sons.
- Schwarzschild, (1954) Schwarzschild, M. (1954). Mass distribution and mass-luminosity ratio in galaxies. The Astronomical Journal, 59:273.
- Scoville et al., (2007) Scoville, N., Abraham, R., Aussel, H., Barnes, J., Benson, A., Blain, A., Calzetti, D., Comastri, A., Capak, P., Carilli, C., et al. (2007). Cosmos: Hubble space telescope observations. Astrophysical Journal Supplement Series, 172(1):38.
- (33) Shamir, L. (2011a). Ganalyzer: A tool for automatic galaxy image analysis. Astrophysical Journal, 736(2):141.
- (34) Shamir, L. (2011b). Ganalyzer: A tool for automatic galaxy image analysis. The Astrophysics Source Code Library, page ascl:1105.011.
- Shamir, (2012) Shamir, L. (2012). Handedness asymmetry of spiral galaxies with z< 0.3 shows cosmic parity violation and a dipole axis. Physics Letters B, 715(1):25–29.
- Shamir, (2013) Shamir, L. (2013). Color differences between clockwise and counterclockwise spiral galaxies. Galaxies, 1(3):210–215.
- Shamir, (2016) Shamir, L. (2016). Asymmetry between galaxies with clockwise handedness and counterclockwise handedness. Astrophysical Journal, 823(1):32.
- (38) Shamir, L. (2017a). Colour asymmetry between galaxies with clockwise and counterclockwise handedness. Astrophysics & Space Science, 362(2):33.
- (39) Shamir, L. (2017b). Large-scale photometric asymmetry in galaxy spin patterns. Publications of the Astronomical Society of Australia, 34:e44.
- (40) Shamir, L. (2017c). Photometric asymmetry between clockwise and counterclockwise spiral galaxies in sdss. Publications of the Astronomical Society of Australia, 34:e011.
- (41) Shamir, L. (2019a). Cosmological-scale parity violation of galaxy spin patterns. arXiv:1912.05429.
- (42) Shamir, L. (2019b). Large-scale patterns of galaxy spin rotation show cosmological-scale parity violation and multipoles. arXiv:1912.05429v3.
- Slipher, (1914) Slipher, V. M. (1914). The detection of nebular rotation. Lowell Observatory Bulletin, 2:66–66.
- Sofue, (2016) Sofue, Y. (2016). Rotation curve decomposition for size–mass relations of bulge, disk, and dark halo components in spiral galaxies. Publications of the Astronomical Society of Japan, 68(1).
- Sofue, (2017) Sofue, Y. (2017). Rotation and mass in the milky way and spiral galaxies. Publications of the Astronomical Society of Japan, 69(1).
- Sofue and Rubin, (2001) Sofue, Y. and Rubin, V. (2001). Rotation curves of spiral galaxies. Annual Review of Astronomy and Astrophysics, 39:137–174.
- Still, (2006) Still, M. (2006). The definitive guide to ImageMagick. Apress.
- Wojnar et al., (2018) Wojnar, A., Sporea, C., and Borowiec, A. (2018). A simple model for explaining galaxy rotation curves. Galaxies, 6(3):70.
- Wolf, (1914) Wolf, M. (1914). Vierteljahresschr astron. Ges, 49:162.