X-RAY EMISSION AND DISK IRRADIATION OF HL TAU AND HD 100546
Abstract
We present new X-ray observations of the optically-obscured protostar HL Tau and the intermediate mass Herbig Be star HD 100546. Both objects are surrounded by spectacular disks showing complex morphology including rings and gaps that may have been sculpted by protoplanets. HL Tau was detected as a variable hard X-ray source by Chandra, typical of late-type magnetically-active coronal sources. No extended X-ray emission was seen along the HL Tau jet, or along the jet of the T Tauri binary system XZ Tau located 23′′ to its east. In contrast, HD 100546 was detected by XMM-Newton as a soft X-ray source (kT 1 keV) with no short-term (1 day) variability. Its X-ray properties are remarkably similar to the Herbig stars AB Aur and HD 163296, strongly suggesting that their X-ray emission arises from the same mechanism and is intrinsic to the Herbig stars themselves, not due to unseen late-type companions. We consider several possible emission mechanisms and conclude that the X-ray properties of HD 100546 are consistent with an accretion shock origin, but higher resolution grating spectra capable of providing information on individual emission lines are needed to more reliably distinguish between accretion shocks and alternatives. We show that X-ray ionization and heating are mainly confined to the upper disk layers in both HL Tau and HD 100546, and any exoplanets near the midplane at distances 1 au are well-shielded from X-rays produced by the central star.
1 Introduction
Observational studies of pre-main sequence (PMS) stars and their protoplanetary disks provide essential information on the environment in which exoplanets form that is needed to test different planet formation models. Young stars of ages a few Myr that are still accreting material exhibit a diverse range of phenomena which can affect disk physical and chemical properties, disk lifetimes, and planet formation and evolution. These include excess UV emission associated with accretion shocks, intense X-ray emission due to strong magnetic activity or shocks, and angular momentum dispersal via wide angle winds or collimated jets and ouflows. A review of these processes and their potential effects on protoplanetary disks and planet formation can be found in Alexander et al. (2014).
The X-ray luminosity of low and intermediate mass PMS stars is typically in the range Lx 1028 - 1031 ergs s-1, about 101-104 times that of the quiet Sun. As young solar-like stars age and spin down, their X-ray luminosity declines (Güdel, Guinan, & Skinner 1997). Stellar X-rays heat and ionize disk gas and the gaseous atmospheres of any close-in protoplanets, and must be taken into account in realistic models of planet formation. X-ray ionization of disk gas also promotes the magneto-rotational instability (Balbus & Hawley 1991) and can thereby affect accretion onto the central star. In magnetically-active class I protostars obscured by surrounding envelopes and optically-revealed T Tauri stars (TTS), very high plasma temperatures (T 100 MK) can be reached during powerful short-duration (minutes to hours) magnetic reconnection flares. In addition to flash-heating, such flares can produce high energy particles that bombard the inner disk and any close-in protoplanets (reviewed by Feigelson & Montmerle 1999; Feigelson 2010).
The photoelectric cross section for absorption of X-rays by gas scales inversely with photon energy as E-p, where 2.5 for solar-abundance gas. Soft X-rays (E 1 keV) are thus heavily absorbed in outer disk layers, whereas harder X-rays with energies of several keV penetrate deeper and can potentially reach the disk midplane, as can cosmic rays. As a young star evolves and its inner disk gas disperses, close-in protoplanets become more heavily exposed to stellar X-rays. Detailed discussions of X-ray heating and ionization of disk gas have been presented by Glassgold et al. (1997a, 1997b. 2004), Igea & Glassgold (1999), Shang et al. (2002), and Aresu et al. (2012). The effects of X-ray and EUV heating on exoplanet atmospheres have been studied by numerous authors including Lammer et al. (2003), Cecchi-Pestellini et al. (2006), and Owen & Jackson (2012).
Compared to the large number of main-sequence exoplanet host stars which have now been identified, there are relatively few examples of PMS exoplanet hosts. One of the first PMS stars showing evidence for one or more protoplanets was the TTS LkCa 15 (Kraus & Ireland 2012; Sallum et al. 2015). It is a bright X-ray source (Lx=1030.5 ergs s-1), but X-ray heating and ionization are largely confined to the outer disk layers and the innermost candidate protoplanet at 16-20 au is still well-shielded by disk gas (Skinner & Güdel 2017, hereafter SG17). More recently, the detection of a young protoplanet within the inner disk gap of the TTS PDS 70 has been reported (Keppler et al. 2018).
Of primary interest here are two other nearby PMS stars which may host protoplanets, namely the heavily-obscured low-mass protostar HL Tau and the intermediate-mass Herbig Be (HBe) star HD 100546. Their properties are summarized in Table 1 and discussed further below (Sec. 2). Both objects are surrounded by spectacular well-studied disks showing complex morphology including rings and gaps that may have been sculpted by protoplanets. However, the confirmed detection of protoplanets is still lacking for both stars and more direct observational evidence is needed.
Both stars are X-ray sources and their proximity (110 - 140 pc) makes them exemplary targets for quantifying the X-ray properties of PMS stars which may host exoplanets. In addition, the earlier B9Ve spectral type and higher mass of HD 100546 provide an informative X-ray comparison with the solar-mass protostar HL Tau. Class I protostars and T Tauri stars have convective envelopes capable of sustaining magnetic fields. They show multiple signatures of magnetic activity including hard and often variable X-ray emission (including powerful flares), analogous to coronal X-ray sources like the Sun. Magnetic fields are also thought to control accretion in these low mass young stellar objects by channeling infalling gas along field lines (Hartmann et al. 2016).
In contrast, Herbig stars are more massive (2 M⊙) and have higher effective temperatures (Teff 8000 K). Although X-ray emission is commonly detected in both Herbig Ae and Be stars, its origin is not yet understood and its effect on their circumstellar disks has not been thoroughly studied. It is believed that in some cases the X-rays may originate in unseen late-type companions (Skinner et al. 2004; Stelzer et al. 2006). However, as we show here, some Herbig stars such as AB Aur, HD 163296, and HD 100546 have remarkably similar X-ray luminosities and soft X-ray emission (kT 1 keV) that suggest intrinsic emission from the Herbig stars themselves, not late-type companions. A key unresolved question is what role, if any, magnetic fields play in Herbig star X-ray production. A solar-like dynamo with associated convection and magnetic activity is not anticipated in Herbig stars with radiative atmospheres. Nevertheless, young Herbig stars of ages a few Myr may still possess weak magnetic fields inherited from the progenitor molecular cloud and nonsolar mechanisms have also been proposed by which Herbig stars might produce magnetic fields. These mechanisms, along with other potential X-ray processes such as accretion shocks and shocked winds are discussed further in Sec. 5.2.
Comparisons of low and intermediate-mass PMS stars provide insight into similarities and differences in their planet-forming environments. Several factors can lead to harsher environments around intermediate-mass PMS stars including their higher effective temperatures, more intense stellar radiation fields (especially in the UV), and stronger winds (Stahler & Palla 2004). We present here a comparison of the X-ray properties of the class I protostar HL Tau and the Herbig Be star HD 100546 based on new pointed observations with the Chandra X-ray Observatory (CXO) and the XMM-Newton observatory, respectively (Table 2). Archive data are also discussed. Significant X-ray differences are found, with HL Tau showing harder, variable, and more heavily absorbed emission. We discuss the implications of these differences for X-ray production mechanisms and for X-ray irradiation of the disk.
We also take advantage of Chandra’s arcsecond angular resolution to search for X-ray emission along the HL Tau jet at small offsets from the star, as well that of its jet-driving TTS neighbor XZ Tau. Faint soft X-ray emission extending outward a few arcseconds along the optically-traced jets of a few PMS stars has been reported. These X-ray jet detections include DG Tau (Güdel et al.2008), RY Tau (Skinner et al. 2016), L1551 IRS 5 (Bally et al. 2003), and the close binary Z CMa (Stelzer et al. 2009). Since the sample of young stars with detected X-ray jets is small and the mechanism(s) by which the jets are heated to X-ray temperatures of a few MK are not understood, further searches are needed to clarify the ubiquity and origin of this unusual phenomenon. Chandra’s low detector background and high spatial resolution make it ideally suited for X-ray jet searches.
2 Summary of Stellar properties
2.1 HL Tau
HL Tau is an optically-obscured young star in the Taurus star-forming region which was classified as a class I protostar on the basis of its mid-IR spectral index by White & Hillenbrand (2004). The central star is not seen directly at optical wavelengths but is revealed in scattered light, so the stellar properties (Table 1) are somewhat uncertain. Stellar mass estimates suggest M∗ 1.2 - 1.3 M⊙ (Brogan et al. 2015; Robitaille et al. 2007; White & Hillenbrand 2004). Estimates of the accretion rate span a range from log = 7.06 to 5.05 M⊙ yr-1 (Hayashi et al. 1993; White & Hillenbrand 2004; Beck et al. 2010).
Infalling gas from an extended disk-shaped envelope was detected in 13CO observations by Hayashi et al. (1993). High spatial resolution Atacama Large Millimeter Array (ALMA) mm and sub-mm observations analyzed by the ALMA Partnership (Brogan et al. 2015) revealed dramatic disk structure dominated by a pattern of bright and dark rings. The ring gaps are dust-depleted (Pinte et al. 2016) and the presence of orbital resonances suggests that the rings may have been sculpted by planet formation. Molecular line velocities consistent with Keplerian disk motion around a 1.3 M⊙ central star were detected by ALMA, in good agreement with the previous mass estimates referenced above.
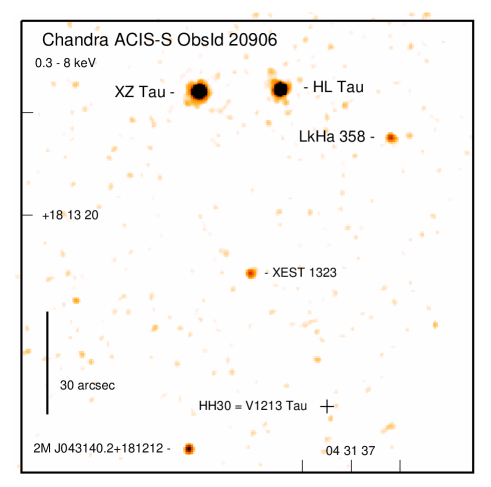
HL Tau drives a bipolar jet with several emission knots revealed in optical images (Mundt et al. 1990; Movsessian et al. 2012). Knots are traced in H outward to at least 35′′ along the blueshifted jet axis at P.A. 45∘ - 47∘. The inner jet is visible in H a few arcseconds from the star. The jet includes low and high radial velocity structures and the mean absolute jet velocity is 250 km s-1 (Movsessian et al. 2012). Interestingly, the blueshifted jet bends at a separation of 20′′ from the star, possibly due to the jet’s interaction with matter expelled by the wind of the young binary XZ Tau located 23′′ to the east (Movsessian et al. 2012). We discuss the X-ray properties of HL Tau and XZ Tau and describe our search for X-ray emission from their jets in Sections 4.1 and 4.2.
2.2 HD 100546
HD 100546 is a nearby Herbig Be star that has been extensively studied in the UV, optical, IR, and mm, as summarized by Sissa et al. (2018). Stellar parameters (Table 1) have been updated based on the recent Gaia DR2 distance of 110 pc by Pineda et al. (2019) and Vioque et al. (2018). Interstellar extinction is low with most studies giving a range Av = 0.1 - 0.28 mag (e.g. van den Ancker et al. 1998; Deleuil et al. 2004; Pineda et al. 2019). However, larger values Av 1 mag that probably include circumstellar extinction have been deduced from fitting the continuum spectral energy distribution over a broad wavelength range (Elia et al. 2004).
The IR spectrum of HD 100546 bears a remarkable resemblance to comet Hale-Bopp (Malfait et al. 1998), suggesting that the star is surrounded by a huge comet cloud (Grady et al. 1997). The HD 100546 circumstellar disk has complex morphology including a gap (Jamialahmadi et al. 2018; Sissa et al. 2018), spiral-shaped structures (Grady et al. 2001, 2005; Ardila et al. 2007), and rings (Sissa et al. 2018). Evidence for accreting gas based on UV spectral line profiles has been reported (Grady et al. 1997; Deleuil et al. 2004). P Cygni-type line absorption profiles provide solid evidence for a high-velocity wind (Grady et al. 2005).
Very Large Telescope (VLT) adaptive optics mid-IR and images revealed a source at a separation of 0′′.457 - 0′′.48 (50 - 53 au) from the star that was classified as a candidate giant protoplanet (HD 100546b; Quanz et al. 2013; 2015). This object was subseqently detected in -band Gemini Planet Imager (GPI) images by Currie et al. (2015), but they noted that it could be a locally bright region in the disk and not a protoplanet. The GPI observations of Rameau et al. (2017) detected no significant orbital motion of this source on a timescale of 4.6 years and found an H-band spectrum inconsistent with a low-temperature object, suggesting that the source may be scattered light. No H emission was detected from the candidate protoplanet using VLT data (Cugno et el. 2019) nor was any 870 m continuum emission detected by ALMA (Pineda et al. 2019). Thus, definitive confirmation of HD 100546b as a protoplanet is yet to be obtained.
A second candidate protoplanet referred to as HD 100546c located closer to the star at a projected separation of 10-14 au was inferred by Brittain et al. (2015) and Currie et al. (2015). However, neither H emission (Cugno et el. 2019) nor compact 870 m emission (Pineda et al. 2019) was detected from HD 100546c. Furthermore, its presence was not confirmed in the high-constrast near-IR study of Sissa et al (2018). Thus, the reality of HD 100546c as a protoplanet remains questionable.
| Name | Sp. Type | Age | M∗ | R∗ | Teff | L∗ | AV | distance | Refs.aa References: (1) White & Hillenbrand (2004) (2) Robitaille et al. (2007) (3) Beck et al. (2010) (4) Brogan et al. (2015 (5) van den Ancker et al. (1998) (6) Pineda et al. (2019) (7) Fairlamb et al. (2015) (8) Vioque et al. (2018) (9) Elia et al. (2004) (10) Gaia DR2 distance |
|---|---|---|---|---|---|---|---|---|---|
| (Myr) | (M⊙) | (R⊙) | (K) | (L⊙) | (mag) | (pc) | |||
| HL Tau | K51 | 2 | 1.2-1.3 | 2.1bbR∗ is the equivalent blackbody radius computed using L∗ = 1.53 L⊙, Teff = 4395 K for HL Tau (White & Hillenbrand 2004) and L∗ = 23.4 L⊙, Teff = 9750 K for HD 100546 (Vioque et al. 2018). | 4400 | 1.5-3.0ccLbol = 6.6 L⊙ (White & Hillenbrand 2004). | 7.4 | 140 | 1,2,3,4 |
| HD 100546 | B9Vne | 4.8-5.5 | 2.2ddRecent mass estimates based on the Gaia DR2 distance (110 pc) are M∗ = 2.05 M⊙ (Vioque et al. 2018) and M∗ = 2.20.2 M⊙ (Pineda et al. 2019). | 1.7bbR∗ is the equivalent blackbody radius computed using L∗ = 1.53 L⊙, Teff = 4395 K for HL Tau (White & Hillenbrand 2004) and L∗ = 23.4 L⊙, Teff = 9750 K for HD 100546 (Vioque et al. 2018). | 9750 | 24 | 0.1-1 | 110 | 5,6,7,8,9,10 |
3 X-ray Observations
3.1 HL Tau
Previous Observations: HL Tau has been serendipitously captured off-axis in a few previous Chandra observations. It was located closest to the aimpoint (but still 6′.15 off-axis) in a 65 ks ACIS-S observation of HH 154 in December 2009 (ObsId 11016). Because of the off-axis position, the image is blurred and not suitable for determining whether faint extended jet emission close to the star is present. However, we extracted a spectrum and X-ray light curve using tools provided in the Chandra Interactive Analysis of Observations (CIAO) software package, as described below for the new observations. The spectrum was acceptably fitted with a simple one-temperature (1T) APEC thermal plasma model. Fit results are included in Table 3 for comparison with the new observations. The spectrum shows very little flux below 1 keV. A faint Fe K complex (Fe XXV; E = 6.67 keV) emission line is detected, indicative of very hot plasma. No large-amplitude flares were detected but low-level variability may be present in the X-ray light curve. However, a large X-ray flare which reached temperatures of kT 7-8 kev and decayed over a two-day interval was detected in the 5-day XMM-Newton monitoring program discussed by Giardino et al. (2006). Excluding the large flare, they determined the quiescent spectral parameters to be absorption NH = 2.43 1022 cm-2 and plasma temperature kT = 3.1 keV. HL Tau was also brightly detected in the XMM-Newton Extended Survey of the Taurus Molecular Cloud (XEST), as discussed by Güdel et al. (2007). Spectral parameters given in the XEST catalog based on two-temperature thermal plasma fits are NH = 2.79 (2.55-3.21; 1) 1022 cm-2, kT1 = 1.93 keV, kT2 = 13.8 keV, emission-measure weighted temperature kTwgtd = 3.0 keV, and intrinsic (unabsorbed) X-ray luminosity log Lx(0.3-10 keV) = 30.52 ergs s-1.
New Observations: As summarized in Table 2, we observed HL Tau in two Chandra exposures acquired in Dec. 2017 (ObsId 20906) and Jan. 2018 (ObsId 18915) using the Advanced CCD Imaging Spectrometer (ACIS-S). In contrast to the previous Chandra observations, HL Tau was positioned on-axis to minimize the point-spread-function (PSF) broadening. This allowed us to perform image deconvolution to remove PSF blurring and search for faint X-ray emission from the jet at small offsets within a few arcseconds of the star. ACIS-S was configured in 1/4 subarray mode using a short 0.9 s CCD frame time to mitigate any photon pileup in the event of a large X-ray flare. No large flares occurred and pileup was negligible (2%).
Data were reduced using CIAO version 4.11 in combination with recent calibration data (CALDB vers. 4.8.2). X-ray spectra and associated response matrix files (RMF) and auxiliary response files (ARF) files were extracted using CIAO specextract. Energy-filtered light curves were produced using CIAO dmextract. Spectra and light curves were extracted from a circular region of radius 1′′.5 centered on the source for the new on-axis observations, but a larger radius of 7′′ was used for the off-axis archive observation to fully enclose the blurred source. Background was negligible and no time filtering to remove high background intervals was required. Spectra were analyzed using XSPEC vers. 12.10.1 (Sec. 4.1; Table 3). Image deconvolution was performed using CIAO arestore, which is based on the Lucy-Richardson method.
3.2 HD 100546
Previous Observations: HD 100546 was detected as an X-ray source in two short 2.6 ks Chandra observations obtained in 2002 (Feigelson et al. 2003). Their fit of the spectrum (59 cts, 0.5-8 keV) gave a plasma temperature kT = 2.5 keV and intrinsic X-ray luminosity log Lx(0.5-8 keV) = 29.46 ergs s-1, where we have adjusted their published Lx value slightly upward (0.06 dex) using the more recent Gaia DR2 distance of 110 pc.
New Observation: We observed HD 100546 in a single XMM-Newton observation of duration 76 ks in July 2015 (Table 2). The primary instrument was the European Photon Imaging Camera (EPIC) which provides CCD imaging spectroscopy from the pn camera (Strüder et al. 2001) and two nearly identical MOS cameras (MOS1 and MOS2; Turner et al. 2001).
Data were reduced using the XMM-Newton Science Analysis System (SAS vers. 17.0) with recent calibration data. Event files provided by the XMM-Newton Science Operations Center were filtered to select good event patterns. Time filtering was applied to the pn data to remove intervals of high background radiation, resulting in 66.3 ks of good time interval (GTI) pn exposure and 58.98 ks of pn livetime. No time filtering was required for the MOS cameras, which are less affected by high background radiation. Each MOS camera provided 74.7 ks of livetime. Energy filters were applied to the pn and MOS data for light curve extraction in order to improve signal-to-noise ratio.
Background-subtracted X-ray spectra and light curves were extracted
for HD 100546 using a circular region centered on the X-ray source of
radius 20′′.
Background was extracted from source-free regions near the source.
Observation-specific RMF and ARF files were created using SAS tools.
Spectra were analyzed using XSPEC vers. 12.10.1
| Parameter | |||
|---|---|---|---|
| Star | HD 100546 | HL Tau | HL Tau |
| Telescope | XMM-Newton | Chandra | Chandra |
| ObsId | 0761790101 | 20906 | 18915 |
| Start Date/Time (TT) | 2015 Jul. 10/14:14:43 | 2017 Dec. 27/16:21:32 | 2018 Jan. 6/13:31:51 |
| Stop Date/Time (TT) | 2015 Jul. 11/10:5024 | 2017 Dec. 28/03:17:50 | 2018 Jan. 6/22:08:20 |
| Instrument | EPICaaThe EPIC observation was obtained in Full Window mode using the thick optical filter. The energy range is E 0.2 - 12 keV with energy resolution (FWHM) at 1 keV of 100 eV (pn) and 70 eV (MOS). The spatial resolution at 1.5 keV is 6′′.6 (FWHM) for pn and 6′′.0 and 4′′.5 (FWHM) for MOS1 and MOS2. | ACIS-SbbData were obtained using ACIS-S 1/4 subarray in faint timed event mode. ACIS-S has a pixel size of 0′′.492 and the energy range is E 0.5 - 10 keV. For an on-axis point source the 90% encircled energy radius is R90 0′′.9. The energy resolution at 1.49 keV is 130 eV. | ACIS-SbbData were obtained using ACIS-S 1/4 subarray in faint timed event mode. ACIS-S has a pixel size of 0′′.492 and the energy range is E 0.5 - 10 keV. For an on-axis point source the 90% encircled energy radius is R90 0′′.9. The energy resolution at 1.49 keV is 130 eV. |
| Livetime (s)ccLivetime corresponds to the time during which source data were being collected and excludes overhead such as CCD readout times. | 58,980ddValues are for the EPIC pn camera. The pn livetime value of 58.98 ks takes into account time intervals that were removed due to high background count rate. Livetime values for the MOS cameras were 74,646 s (MOS1) and 74,770 s (MOS2). No high-background time filtering was needed for the MOS data. | 35,994 | 26,857 |
| Frame time (s) | 0.073ddValues are for the EPIC pn camera. The pn livetime value of 58.98 ks takes into account time intervals that were removed due to high background count rate. Livetime values for the MOS cameras were 74,646 s (MOS1) and 74,770 s (MOS2). No high-background time filtering was needed for the MOS data. | 0.9 | 0.9 |
4 Results
4.1 HL Tau
HL Tau was brightly detected in both Chandra observations, along with other nearby young stars such as the close TTS binary XZ Tau (Fig. 1-top). The peak X-ray position of HL Tau in the two observations agrees to within one ACIS pixel (0′′.492). Averaging the peak position for the two observations gives a Chandra J2000 position R.A. = 04 31 38.43, decl. = 18∘ 13′ 57.4′′. For comparison, the ALMA position is (Brogan et al. 2015) R.A. = 04 31 38.425, decl. = 18∘ 13′ 57.242′′.
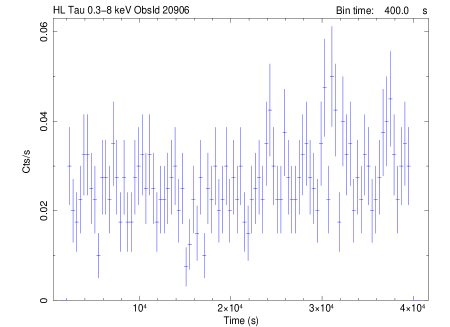
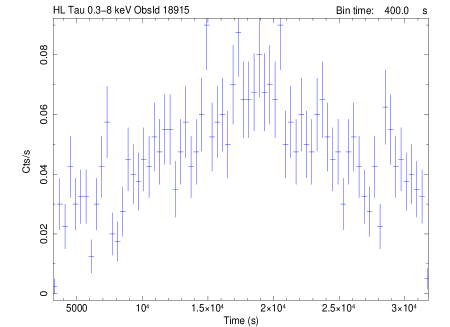
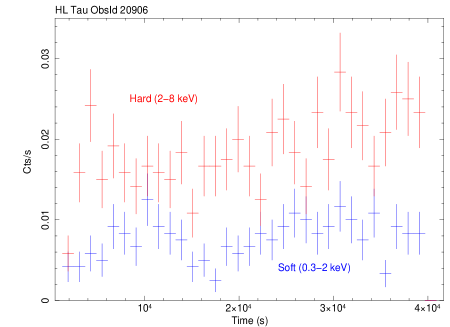
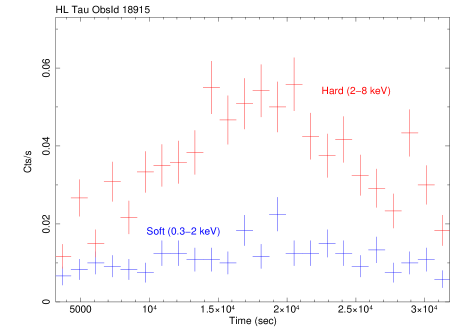
Its broad-band X-ray light curve (Fig. 2-top) is clearly variable in ObsId 18915. The CIAO statistical test applied to events in the hard 2-8 keV range gives a probability of variability Pvar 0.999, whereas events in the soft 0.3-2 keV band give Pvar = 0.20. The hard-band variability is apparent in Figure 2-bottom. By comparsion, the test for variability in ObsId 20906 does not show significant variability, with giving Pvar = 0.49 (0.3-2 keV) and 0.59 (2-8 keV). We generated plots of the hardness ratio (H.R.) for both observations showing the ratio of soft to hard-band count rates versus time. When binned at 1800 s intervals, a fit of the ObsId 18915 H.R. plot with a constant rate model gives a mean H.R = 0.300.02 (1) and ObsId 20906 gives H.R = 0.390.03 (1). This provides quantitative confirmation of the lower ratio of soft to hard band rates apparent for ObsId 18915 in Fig. 2-bottom.
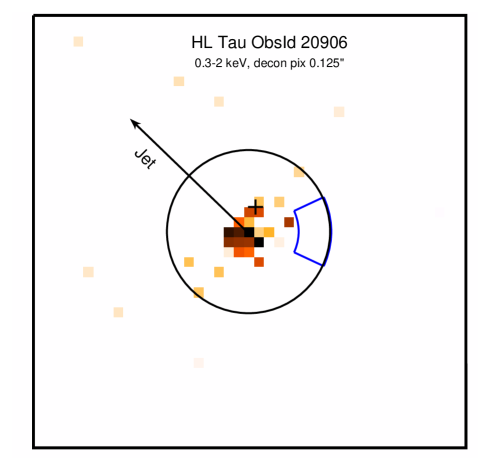
Deconvolution was performed on the ObsId 20906 soft-band (0.3-2 keV) image to search for extended soft X-ray emission along the optical jet. The deconvolution was performed using a PSF image generated using the MARX simulation software based on parameters specific to ObsId 20906. No significant X-ray extension in the optical jet direction was found (Fig. 1-bottom). Deconvolution of the ObsId 18915 image was not performed since the spectrum and hardness were highly variable. Such variability causes the energy-dependent PSF to change shape during the observation.
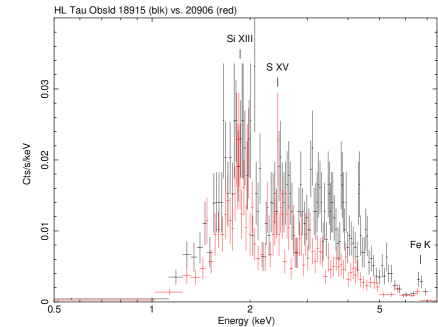
The ACIS-S spectra (Fig. 3-left) reveal hot plasma including a faint Fe K (Fe XXV) blended emission line complex at 6.67 keV in ObsId 18915. Spectral fits using an absorbed single-temperature optically thin plasma model are acceptable (Table 3). The best-fit values in Table 3 for ObsId 18915 should be interpreted as time averages, since the spectral parameters were changing during the exposure (see below). The fits require substantial aborption equivalent to AV 13 mag, using the conversion NH = 1.9 1021AV cm-2 obtained by averaging the results of Gorenstein (1975) and Vuong et al. (2003). Similarly, XMM-Newton XEST results (Güdel et al. 2007) give NH = 2.79 1022 cm-2, or AV 14.7 mag.
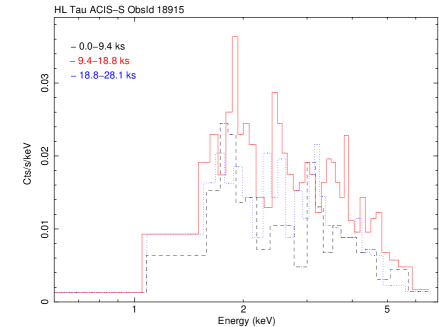
Since the X-ray emission was clearly variable during ObsId 18915, we subdivided the full exposure into three equal time segments of 9.4 ks each and extracted separate spectra for each segment. Each time-partitioned spectrum was fitted separately using a using a 1T APEC model with absorption and metallicity held fixed at the best-fit values obtained by fitting the entire observation (Table 3). The simple 1T model gives a poor fit for the first segment, suggesting that plasma properties (e.g. temperature) were changing rapidly during the first 9.4 ks. Fits of the middle and last segments are acceptable. The 1T APEC fit of the middle segment when the hard-band count rate was highest gives kT = 4.3 (3.9-5.0; 1) keV and observed (absorbed) flux Fx,abs(0.3-8 keV) = 1.04 10-12 ergs cm-2 s-1. A similar fit of the final 9.4 ks segment when the hard-band count rate was decreasing gives kT = 3.1 (2.8-3.6) keV and Fx,abs(0.3-8 keV) = 6.4 10-13 ergs cm-2 s-1. Thus, the plasma temperature clearly decreased during the final third of the observation. Even so, it had not yet decreased to the lower levels observed about nine days prior in ObsId 20906 (Table 3).
4.2 XZ Tau
We briefly summarize the X-ray properties of the multiple system XZ Tau AB, even though it is so far not known to host exoplanets. It consists of an optically variable close M2M3 pair separated by 0′′.3, both of which have characteristics of classical TTS (Haas et al. 1990; White & Ghez 2001; Hartigan & Kenyon 2003; Krist et al. 2008). It was suggested from Very Large Array observations that the southern component XZ Tau A may itself be a tight binary with a separation of 0′′.09 (Carrasco-González et al. 2009) but confirmation of this putative third component has so far not been obtained. Hubble Space Telescope observations show that both A and B drive collimated jets and reveal bipolar expanding bubbles of emission nebulosity. The XZ Tau A jet is oriented along P.A. = 15∘ and the B jet along P.A. = 36∘ (Krist et al. 2008).
X-ray emission from the unresolved XZ Tau AB pair was detected during the XMM-Newton monitoring campaign discussed by Giardino et al. (2006) with average spectral parameters NH = 2.40.1 1021 cm-2, kT1 = 0.830.02 keV, kT2 = 4.090.34 keV, and log Lx = 30.36 ergs s-1. Analysis of XMM-Newton XEST data by Güdel et al. (2007) gave NH = 2.4 (2.1-2.7) 1021 cm-2, kT1 = 0.75 keV, kT2 = 2.3 keV, kTwgtd = 1.5 keV, and log Lx(0.3-10 keV) = 29.93 ergs s-1.
XZ Tau AB was detected as a bright source in our Chandra observations. The close pair is not spatially resolved by Chandra. Pileup was negligible (2%) due to the short subarray readout time. No significant X-ray variability was found during either observation. The CIAO glvary test using events in the 0.3 - 8 keV range gives variability probabilities Pvar 0.01 (ObsId 18915) and Pvar = 0.04 (ObsId 20906). However, the X-ray emission brightened somewhat during the interval between the observations (see below). We constructed a deconvolved 0.3-2 keV image (ObsId 20906) using the same procedure as for HL Tau. No significant X-ray extension was found at offsets 1′′ along the jet axes of XZ Tau A at P.A. = 15∘ or XZ Tau B at P.A. = 36∘ (Krist et al. 2008).
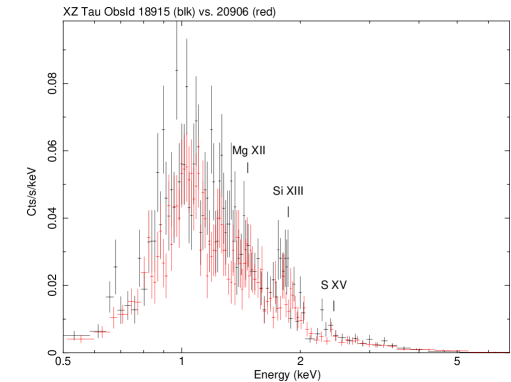
The spectra for the two observations (Fig. 4) are similar and show emission lines from Mg XII Ly (1.47 keV, maximum line emissivity at log Tmax = 7.0 K), the Si XIII triplet (1.86 keV, log Tmax = 7.0 K), and S XV (2.43 keV, log Tmax = 7.1 K). The spectra can be satisfactorily fitted with a two-temperature (2T) APEC thermal plasma model and results for fitting the two spectra together are given in Table 3. The absorption column density is low and not well-constrained by the Chandra spectra. Thus, it was held fixed during fitting at NH = 2 1021 cm-2, compatible with AV = 1.1 (0.4,0.2) mag for XZ Tau A (Csépány et al. 2017) and similar to values determined from previous XMM-Newton observations.
Even though no significant X-ray variability was present in the individual observations, a comparison of the spectra for the two observations shows that the source increased in brightness. For the first observation (ObsId 20906), XZ Tau AB provided 1531 net counts (0.3-8 keV) during a livetime of 35,994 s (42.5 c ks-1) and an observed (absorbed) flux Fx(0.3-8 keV) = 3.29 (3.10-3.34; 1) 10-13 ergs cm-2 s-1. For the second observation (ObsId 18915), the source gave 1424 net counts in a livetime of 26,857 s (53.0 c ks-1) and an observed flux Fx(0.3-8 keV) = 4.08 (3.75-4.13; 1) 10-13 ergs cm-2 s-1. Thus, the XZ Tau X-ray flux is variable. In addition, the somewhat lower temperature measured by Chandra as compared to the previous XMM-Newton values shows that kT is variable, as was also apparent in the XMM-Newton monitoring data presented by Giardino et al. (2006).
| Parameter | ||||
|---|---|---|---|---|
| Star | HL Tau | HL Tau | HL Tau | XZ Tau |
| ObsId | 11016aaArchive data, observed on 29 Dec 2009 with HL Tau located 6′.15 off-axis (Sec. 3.1). | 18915 | 20906 | 18915+20906 |
| Model | 1T APEC | 1T APEC | 1T APEC | 2T APEC |
| NH (1022 cm-2) | 2.4 [2.2-2.5] | 2.5 [2.3-2.7] | 2.6 [2.4-2.8] | {0.2} |
| kT1 (keV) | 3.04 [2.80-3.31] | 4.07 [3.56-4.75] | 2.40 [2.20-2.68] | 0.26 [0.23-0.30] |
| kT2 (keV) | … | … | … | 1.28 [1.24-1.32] |
| kTwgtd (keV) | … | … | 0.78 | |
| norm1 (cm-5) | 9.9 [9.1-10.8]e-04 | 12.4 [11.0-13.9]e-04 | 9.6 [8.4-11.0]e-04 | 5.7 [4.4-7.3]e-04 |
| norm2 (cm-5) | … | … | … | 5.9 [5.5-6.3]e-04 |
| /bbElement abundances are relative to the solar values of Anders & Grevesse (1989). | 0.44 [0.32-0.57] | 0.43 [0.30-0.58] | 0.43 [0.24-0.64] | 0.14 [0.12-0.17] |
| /dof | 177.8/178 | 101.8/107 | 73.9/80 | 201.9/186 |
| reduced | 1.00 | 0.95 | 0.92 | 1.08 |
| Fx (10-13 ergs cm-2 s-1)ccMeasurement uncertainties in observed (absorbed) flux are 5% - 7% (1). | 4.91 (13.4) | 7.70 (18.4) | 3.57 (12.0) | 3.59 (7.57) |
| log Lx (ergs s-1) | 30.50 | 30.63 | 30.45 | 30.25 |
| log (Lx/Lbol)ddAssumes Lbol = 6.6 L⊙ for HL Tau (White & Hillenbrand 2004) and Lbol(AB) = 0.48 L⊙ for XZ Tau AB (Hartigan & Kenyon 2003). | 3.90 | 3.77 | 3.95 | 3.01 |
Note. — Based on simultaneous fits of background-subtracted ACIS-S spectra binned to a minimum of 10 counts per bin using XSPEC v12.10.1. For XZ Tau, the spectra from both observations were fitted simultaneously. Models include an absorption component (NH) modeled in XSPEC with the model and are one-temperature variable metallicity thermal plasma (1T APEC). The tabulated parameters are absorption column density (NH), plasma temperature of each component (kTi), emission-measure weighted plasma temperature (kTwgtd) for 2T fits weighted by the of each component, metallicity () expressed as a fraction of solar metallicity, and XSPEC normalization (norm). For APEC models, the volume emission measure is related to the normalization (norm) by nV = 41014dnorm, where ne is electron density, V is the volume of X-ray emitting plasma, and dcm is the distance in cm. Quantities enclosed in curly braces were held fixed during fitting. Square brackets enclose 1 confidence intervals. X-ray flux (FX) is the observed (absorbed) value followed in parentheses by the unabsorbed value in the 0.3 - 8 keV range. X-ray luminosity (LX) is the unabsorbed value in the 0.3 - 8 keV range. A distance of 140 pc is assumed.
4.3 HD 100546
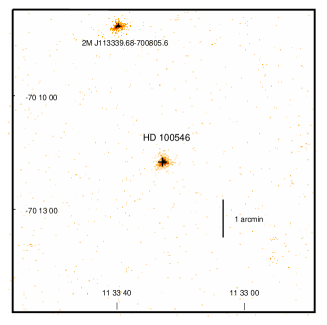
HD 100546 was clearly detected with a corrected X-ray position (J2000) from the pipeline processing of R.A. = 11 33 25.38, decl. = 70∘ 11′ 41′′.2. This position is offset by only 0′.31 from the ICRS coordinates of HD 100546: R.A. = 11 33 25.44, decl. = 70∘ 11′ 41′′.24. The offset is well within XMM-Newton astrometric uncertainties111XMM-Newton calibration data can be found at http://xmm2.esac.esa.int/docs/documents/CAL-TN-0018.pdf ., providing confidence that the X-ray source is HD 100546. There are no other X-ray sources in the immediate vicinity of HD 100546 (Fig. 5).
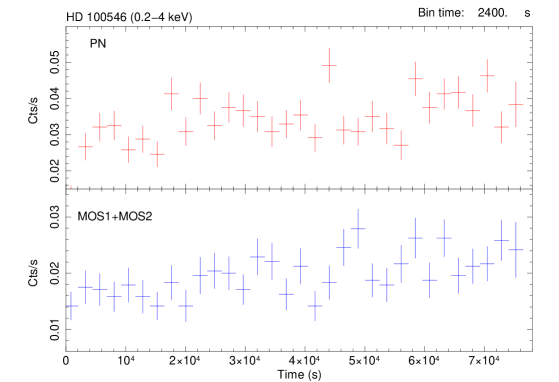
The EPIC light curves of HD 100546 are shown in Figure 6. The light curves have been energy-filtered to include only events in the 0.2-4 keV range since there are no significant spectral counts above 4 keV (Fig. 7). No large amplitude variability (e.g. flares) were detected, but a slight increase in count rate during the last half of the observation may be present. A test for variability in the lower noise MOS light curves binned to 2400 s bins gives Pvar = 0.61 (MOS1) and Pvar = 0.90 (MOS2).
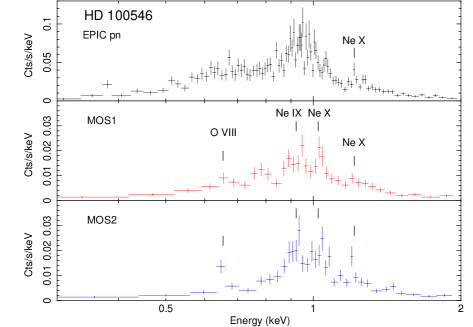
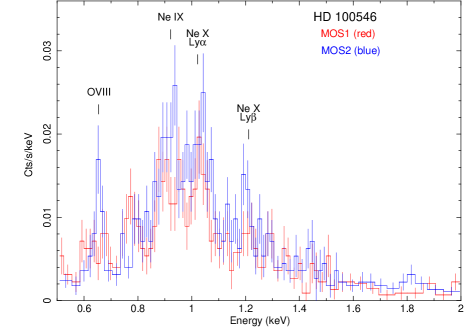
The EPIC spectra shown in Figure 7 are quite soft and almost all detected events have energies below 2 keV. A few emission lines and line blends are visible, as apparent in the lightly-binned MOS spectra (Fig. 7-right). These are O VIII Ly (0.65 keV. log Tmax = 6.5 K), the blended Ne IX triplet (0.905-0.922 keV, log Tmax = 6.6 K), Ne X Ly (1.02 keV, log Tmax = 6.8 K) and Ne X Ly (1.21 keV, log Tmax = 6.8 K). These lines all trace plasma at T 10 MK, much cooler than detected in HL Tau.
Spectral fits with absorbed thermal plasma models are summarized in Tables 4 and 5. Two-temperature optically thin plasma (2T APEC, 2T VAPEC) and differential emission measure (DEM) models give similar results. These models adequately reproduce the spectra but tend to underestimate the flux in the 1.21 keV feature visible in both pn and MOS that is likely Ne X. The EPIC fits converge to a subsolar Fe abundance and Ne abundance above solar, but grating spectra are needed to more reliably determine element abundances.
All models that we tested require an absorption column density NH that is larger than that expected based on typical interstellar extinction estimates AV 0.1 - 0.3 mag toward HD 100546. This is an indication that the X-rays are absorbed by dust-depleted circumstellar gas that escapes optical detection. The X-ray derived NH = (1.8 - 2.7) 1021 cm-2 equates to AV 0.9 - 1.4 mag using standard NH to AV conversions (Gorenstein 1975; Vuong et al. 2003). This value is similar to AV = 1.03 mag determined from IUE short wavelength UV spectra (Valenti et al. 2000). Also, the X-ray derived NH is comparable to NH = 3 1021 cm-2 determined by Grady et al. (2005) from HST observations. This X-ray absorption in excess of the interstellar value was not detected in previous Chandra observations. As a result, EPIC estimates of the intrinsic (unabsorbed) X-ray luminosity (Lx) are slightly higher than previously determined from Chandra data. The higher absorption inferred from XMM-Newton spectra could reflect real variability in NH, as discerned from HST data by Grady et al. (2005). However, the better sensitivity of XMM-Newton EPIC at low energies below 1 keV where absorption effects are important may also contribute to differences with Chandra.
| Parameter | |||
|---|---|---|---|
| Model | 2T APEC | 2T VAPEC | DEM |
| NH (1021 cm-2) | 2.7 [2.4-3.3] | 2.2 [1.9-2.5] | 1.8 [1.6-2.0] |
| kT1 (keV) | 0.22 [0.20-0.23] | 0.39 [0.37-0.40] | … |
| kT2 (keV) | 1.01 [0.99-1.03] | 1.57 [1.38-1.76] | … |
| kTwgtd (keV) | 0.52 | 0.73 | … |
| norm1 (cm-5) | 14.8 [11.7-22.9]e-05 | 7.5 [6.3-8.9]e-05 | 0.23 [0.18-0.27]e-05 |
| norm2 (cm-5) | 9.1 [7.9-10.2]e-05 | 3.2 [2.8-3.5]e-05 | … |
| /aaElement abundances are relative to the solar values of Anders & Grevesse (1989). | 0.41 [0.34-0.52] | … | … |
| NeaaElement abundances are relative to the solar values of Anders & Grevesse (1989). | … | 2.8 [2.5-3.2] | 3.0 [2.7-3.4] |
| FeaaElement abundances are relative to the solar values of Anders & Grevesse (1989). | … | 0.19 [0.16-0.23] | 0.30 [0.24-0.36] |
| /dof | 280.2/213 | 253.9/212 | 280.2/209 |
| reduced | 1.31 | 1.20 | 1.34 |
| Fx (10-14 ergs cm-2 s-1)bbMeasurement uncertainties in observed (absorbed) flux for the simultaneous fits of all three EPIC spectra are 8% (1). | 8.34 (30.7) | 8.46 (20.7) | 8.58 (17.8) |
| Fx,1 (10-14 ergs cm-2 s-1) | 2.05 (16.6) | 5.73 (16.0) | … |
| Fx,2 (10-14 ergs cm-2 s-1) | 6.29 (14.1) | 2.73 (4.7) | … |
| log Lx (ergs s-1) | 29.65 | 29.48 | 29.41 |
| log (Lx/L∗)ccAssumes L∗ = 24 L⊙ (Vioque et al. 2019). | 5.31 | 5.48 | 5.55 |
Note. — Based on simultaneous fits of background-subtracted EPIC pn, MOS1, and MOS2 spectra from ObsId 0761790101 binned to a minimum of 15 counts per bin using XSPEC v12.10.1. Models include an absorption component (NH) modeled in XSPEC with the model and are two-temperature variable metallicity thermal plasma (2T APEC), 2T variable Ne and Fe abundance thermal plasma (2T VAPEC), and differential emission measure (DEM) modeled as in XSPEC. The tabulated parameters are the same as in Table 3. Quantities enclosed in curly braces were held fixed during fitting. Square brackets enclose 1 confidence intervals. The total X-ray flux (Fx) and flux contributions of each temperature component (Fx,i) are the observed (absorbed) values followed in parentheses by the unabsorbed value in the 0.2 - 6 keV range. There is no significant observed flux above 6 keV. X-ray luminosity (LX) is the unabsorbed value in the 0.2 - 6 keV range. A distance of 110 pc is assumed (GAIA DR2).
| Name | ObsId | Date | NH | kT1, kT2 | Fx | log Lx | Rate |
|---|---|---|---|---|---|---|---|
| (1022 cm-2) | (keV) | (ergs cm-2 s-1) | (ergs s-1) | (c s-1) | |||
| HL Tau | 11016 (CXO)bbArchive data | 29 Dec 2009 | 2.4 | 3.0, … | 4.91e-13 | 30.50 | 0.0340.009 |
| HL Tau | 20906 (CXO) | 27 Dec 2017 | 2.6 | 2.4, … | 3.57e-13 | 30.45 | 0.0270.012 |
| HL Tau | 18915 (CXO) | 06 Jan 2018 | 2.5 | 4.1, … | 7.70e-13 | 30.63 | 0.0480.021 |
| HD 100546 | 0761790101 (XMM) | 10 Jul 2015 | 0.25 | 0.3, 1.3 [0.6]ccThe value in brackets is the value kTwgtd for the 2T (V)APEC fits weighted by the contribution to the total emission measure (norm) of each temperature component. | 8.40e-14 | 29.57 | 0.0350.005 |
5 Discussion
5.1 HL Tau X-ray Emission Processes
Shocks: The plasma temperature kT = 2.4 - 4.1 keV determined from the X-ray spectra of HL Tau is too high to be explained by accretion shocks. The maximum accretion shock temperature for accreting gas impacting the star is Ts = 2.27105(/100 km s-1)2 K, where the mean mass per particle for fully-ionized solar abundance plasma is = 0.6 (amu) and is the shock speed. To obtain an upper limit on Ts, we assume equals the free-fall speed = (2GM∗/R∗)1/2. Here, [1 - (R∗/)] 1 for infalling material originating at a distance from the star. For HL Tau, we assume M∗ 1.3 M⊙ and R∗ 2.1 R⊙ (White & Hillenbrand 2004), so 484 km s-1 if the infalling material comes in from infinity. Thus, Ts = 3.3 MK, or kTs = 0.28 keV, a factor of 10 less than observed. Although cool shock-related plasma at temperatures kT 0.3 keV may be present, it would remain undetected because of the strong X-ray absorption of HL Tau which masks emission below 1 keV (Fig. 3).
The conclusion reached above also applies to X-ray emission from the shocked jet. The maximum temperature for a strong shock is Ts = 1.5105(/100 km s-1)2 K, where is the velocity of the shock relative to downstream material (Raga et al. 2002). The mean absolute jet speed of HL Tau is 250 km s-1 (Movsessian et al. 2012) which gives a maximum predicted shock temperature Ts = 0.94 MK, or kTs 0.08 keV, well below the observed value. In addition, the high X-ray absorption and absence of extended X-ray structure along the optical jet (Fig. 1) argue against X-ray emission originating in a jet offset from the star.
Magnetic Processes: The higher X-ray temperature and X-ray variability of HL Tau are more suggestive of emission originating in magnetically confined plasma. Since the X-ray emitting region is not spatially-resolved, the precise location(s) relative to the star where the emission originates is not known. However, based on modeling of the large slowly-decaying X-ray flare detected by XMM-Newton, Giardino et al. (2006) concluded that the flaring plasma arises in one or more coronal loops extending out to several stellar radii. This does not preclude X-ray emission originating closer to the star in non-flaring (“quiescent”) states.
Previous studies have shown that X-ray luminosity is correlated with stellar mass in T Tauri stars (Preibisch et al. 2005; Telleschi et al. 2007a). Using XMM-Newton data for classical TTS (cTTS) detected in the XEST survey, Telleschi et al. (2007a) obtained a regression fit using the bisector method (which treats the two variables symmetrically) of the form log Lx = 1.98(0.20)log(M∗/M⊙) 30.24(0.06) ergs s-1. Assuming M∗ = 1.3 M⊙ for HL Tau gives log Lx = 30.47 (30.38-30.55) ergs s-1, which agrees well with the observations (Table 3). Thus, even though HL Tau is a class I protostar, its Lx is not anomalous compared to cTTS of similar mass in Taurus. However, the mean X-ray absorption and plasma temperature of HL Tau from our spectral fits of three Chandra observations (NH,avg = 2.5 1022, kTavg = 3.3 keV) are both at the high end of the range compared to cTTS detected in the XEST Taurus sample (Fig. 13 of Telleschi et al. 2007a). The higher absorption is anticipated for HL Tau since the central protostar is still obscured and infalling gas is present from a remnant envelope, whereas cTTS are still accreting but optically-revealed.
5.2 HD 100546 X-ray Emission Processes
The soft X-ray spectrum of HD 100546 provides a sharp contrast to the harder spectrum of HL Tau. Although the lower X-ray temperature of HD 100546 does not in itself rule out a late-type companion as the X-ray source, no evidence for a close physical stellar companion was found in HST images (Grady et al. 2001). We thus consider intrinsic emission from the Herbig star by processes that are capable of producing cool plasma. Such processes include accretion shocks, wind shocks, current sheets, and soft coronal emission possibly sustained by nonsolar mechanisms.
Accretion Shocks: For HD 100546 we assume M∗ = 2.2 M⊙ (Pineda et al. 2019) and R∗ = 1.7 R⊙, where R∗ is the equivalent blackbody radius based on L∗ = 23.4 L⊙ and Teff = 9750 K (Vioque et al. 2018). The predicted accretion luminosity for a mass accretion rate is Lacc = GM∗/R∗ where, as above, = [1 - (R∗/)]. Estimates of the HD 100546 accretion rate range from few 10-9 M⊙ yr-1 (Grady et al. 2005) to 10-7 M⊙ yr-1 (Fairlamb et al. 2015). For the estimates below, we adopt the mid-range value 10-8±1 M⊙ yr-1.
To obtain a realistic estimate of the shock temperature Ts and accretion lumionsity Lacc we must consider the possibility that the infalling material originates at a finite distance from the star ( 1). If the material originates at the corotation radius of a Keplerian disk ( = ), then the HD 100546 stellar parameters give = 3.2 R∗ and = 0.69. Here we have used sin = 65 km s-1 (Donati et al. 1997) and have assumed a stellar inclination relative to the line-of-sight 50∘ (Augereau et al. 2001; Deleuil et al. 2004, Panic̈ et al. 2014). The above gives = 586 km s-1 and Ts = 4.7 MK (kTs = 0.4 keV). The predicted accretion luminosity is log Lacc = 33(1) ergs s-1, where the range reflects the order-of-magnitude uncertainty in .
We also consider the possibility of magnetospheric accretion in which material originating at the inner edge of the accretion disk is magnetically channeled onto the star. The results of Königl (1991) give = (2GM∗)-1/7 where = B∗R and we assume = 1 corresponding to the classical Alfvén radius for spherical accretion. We consider field strengths B∗ 100 - 300 G as have been reported for some HAeBe stars (e.g. Hubrig et al. 2004, 2013; Bagnulo et al. 2015; Järvinen et al. 2019). Taking 10-8 M⊙ yr-1 and B∗ 100 G gives 1.3 R∗, = 341 km s-1 (ignoring centrifugal forces), Ts = 1.6 MK, kTs = 0.14 keV, and log Lacc = 32.6 ergs s-1. For a stronger field B∗ 300 G we obtain 2.5 R∗, = 546 km s-1, Ts = 4.0 MK, kTs = 0.35 keV, and log Lacc = 33.0 ergs s-1.
Based on the above estimates, an accretion shock could account for the observed X-ray luminosity (log Lx = 29.4 - 29.65 ergs s-1) and would be capable of producing at least some of the cooler plasma present in the X-ray spectrum. Also, an attractive feature of the accretion shock model is that the X-ray absorption detected in excess of that expected from Av has a natural explanation. Accretion shock emission originating at or near the stellar surface could be absorbed by cool accreting gas, or by the stellar wind, or both.
To further test the relevance of the accretion model, other diagnostics such as electron density in the X-ray plasma and X-ray line widths are needed, based on grating spectra. In general, higher densities are expected for an accretion shock and some line broadening may be present. XMM-Newton Reflection Grating Spectrometer (RGS) spectra were automatically obtained simultaneously with our EPIC data but the grating spectra are noise-dominated and not suitable for detailed spectral line analysis. However, we note that heavily-broadened UV lines have been detected in HD 100546 with larger line widths than can be accounted for by thermal effects or stellar rotation (Deleuil et al. 2004).
Wind Shocks: Herbig stars are known to drive winds as evidenced by P-Cygni type absorption features in emission line profiles, but mass-loss rates are still rather uncertain. For HD 100546 we adopt 10-8 M⊙ yr-1 based on the estimate of Wright et al. (2015) and typical radio-derived mass-loss rates for similar Herbig stars such as AB Aur (Güdel et al. 1989; Skinner et al. 1993; Rodriguez et al. 2014), and terminal wind speed 350 km s-1 (Grady et al. 2005). The kinetic wind luminosity is Lw = (1/2), which gives log Lw = 32.6 ergs s-1, about three orders of magnitude greater than Lx. Thus, there is sufficient wind kinetic energy to account for the X-ray luminosity, even at low conversion efficiencies.
The Eddington parameter is = (L∗)/(4cGM∗), where is the electron scattering coefficient per unit mass, c is the speed of light, and and G the gravitational constant. Adopting 0.3 cm2 g-1 as a typical value for hot stars (Lamers & Cassinelli 1999), L∗ = 23.4 L⊙, and M∗ = 2.2 M⊙ gives 3 10-4 1. Thus, there is insufficient radiation pressure to drive the wind of HD 100546 and X-ray emission models based on radiative wind shocks are not applicable.
In the magnetically-confined wind shock (MCWS) picture, X-rays are produced in shocks near the magnetic equator when the magnetically-channeled winds from each hemisphere collide with one another. The wind can be confined by a stellar magnetic field B∗ if the confinement parameter 1, where = (BR)/ (ud-Doula & Owocki 2002). Adopting 10-8 M⊙ yr-1 as above and = 350 km s-1 gives 1 if B∗ 100 G. However, the results of Babel & Montmerle (1997) predict a maximum wind shock temperature Tmcws = 1.38 MK (kTmcws = 0.12 keV) if = 350 km s-1. This value is too low to explain the X-ray temperature determined from HD 100546 spectral fits and the presence of spectral lines such as Ne X which form at much higher temperatures of 6 MK. Thus, unless is about twice as high as assumed above, the relevance of the MCWS model seems doubtful for HD 100546.
Current Sheets: Usov & Melrose (1992; hereafter UM92) presented a model for X-ray emission from magnetic early-type stars in which hot gas forms in a current sheet near the magnetic equator as the wind drags the field lines outward in a radial direction. Applying equations 20, 23, 25, and 26 of UM92 to HD 100546 ( 10-8 M⊙ yr-1, = 350 km s-1, surface field strength B∗ 100-300 G) gives wind absorption NH = 3.41021 cm-2, plasma temperature T = 7.3 MK or kT = 0.63 keV, and Lx 1029 - 1030 ergs s-1. These values agree quite well with the HD 100546 observations. We note, however, that the model of UM92 assumes plasma cooling via bremsstrahlung but the X-ray spectrum of HD 100546 shows several emission lines (Fig. 7), so the bremsstrahlung cooling assumption is overly simplistic for the case considered here.
X-ray Corona: In late-type stars with outer convection zones the presence of an X-ray emitting corona is linked to a solar-like dynamo. For HAeBe stars, strong outer convection zones are not expected but thin convection zones have been discussed as a possible explanation of the X-ray emission of some well-studied stars such as AB Aur (Telleschi et al. 2007b). The presence of short-lived outer convection zones due to deuterium burning in lower mass Herbig stars (M∗ 3.9 M⊙) has been discussed within the framework of stellar evolution models by Palla & Stahler (1993). It has also been suggested by Tout & Pringle (1995) that young Herbig stars might have X-ray emitting coronae as a result of magnetic activity sustained by a shear-powered dynamo.
In the shear dynamo model, the X-ray luminosity is predicted to fall off rapidly with stellar age as Lx() = Lx,0[1 ()]-3, where the reference luminosity Lx,0 and age depend on several factors including the star’s mass, radius, efficiency of magnetic field generation (), fraction of magnetic flux which heats coronal gas (), and rotational shear (eqs. [3.15] and [4.4] of Tout & Pringle 1995). In some cases such as AB Aur, the predicted Lx agrees well with observations but the agreement for other Herbig stars is less satisfactory (Skinner et al. 2004; Telleschi et al. 2007b). Direct comparisons with observations are quite uncertain since the model predictions depend on several poorly-known parameters such as and .
If we follow the procedure of Skinner et al. (2004) and adopt fiducial values for the model parameters ( 10-3, 310-5) and the same stellar parameters as above, along with age = 4.8 Myr for HD 100546 (Pineda et al. 2019), then the Tout & Pringle model gives Lx,0 = 1.92 1031 ergs s-1, 0.94 Myr, and log Lx(=4.8 Myr) 28.9 (28.5-29.2) ergs s-1. The range in parentheses reflects the age uncertainty. The predicted Lx is less than observed, but the upper limit is only a factor of 2 below the observed value (Table 4). That might be considered as reasonably good agreement given the uncertainties in the model and stellar parameters. However, the Tout & Pringle model does not predict the X-ray temperature so comparison with observational results is quite limited.
Summary: Of the mechanisms considered above, the accretion shock model emerges as the most likely explanation of the X-ray emission of HD 100546. The current sheet model can also explain the observed plasma temperature and X-ray luminosity, but this model assumes bremsstrahlung cooling whereas the observed X-ray spectrum shows emission lines that are not anticipated for a pure bremsstrahlung spectrum. The predicted X-ray luminosity of the shear dynamo soft coronal model is moderately less than observed, but this discrepancy could be due to uncertainties in the assumed values of efficiency and shear parameters, whose values are not emprically determined for HD 100546. However, the significant X-ray absorption by cool gas present in the X-ray spectrum (Sec. 4.3) is more difficult to reconcile with coronal models than with models such as accretion shocks where the X-rays originate at or near the stellar surface.
| Name | Sp. type | Dist.aa Notes: X-ray flux Fx is the observed (absorbed) value (0.3-8 keV). X-ray luminosity Lx is the intrinsic (unabsorbed) value (0.3-8 keV). The mean count rates for HL Tau are in the 0.3-8 keV range. For HD 100546, the mean background-subtracted count rate is for the pn detector (0.2-4 keV); the summed background-subtracted rate of the MOS1MOS2 detectors is 0.0200.004 c s-1 (0.2-4 keV). Count rate uncertainties are 1. | Av | Av ref.bbX-ray refs. (1) this work. (2) Telleschi et al. (2007b) (3) Swartz et al. (2005) Av refs. (4) van den Ancker et al. (1998) (5) Roberge et al. (2001) (6) Garcia Lopez et al. (2006) (7) Hillenbrand et al. (1992) (8) Valenti et al. (2000) (9) Deleuil et al. (2004) (10) Pineda et al. (2019) (11) Valenti et al. (2003) | NH,xray | kTwgtdccThe mean X-ray plasma temperature weighted by the contribution to the total emission measure of each component. | log Lx | log (Lx/L∗) | X-ray ref.bbX-ray refs. (1) this work. (2) Telleschi et al. (2007b) (3) Swartz et al. (2005) Av refs. (4) van den Ancker et al. (1998) (5) Roberge et al. (2001) (6) Garcia Lopez et al. (2006) (7) Hillenbrand et al. (1992) (8) Valenti et al. (2000) (9) Deleuil et al. (2004) (10) Pineda et al. (2019) (11) Valenti et al. (2003) |
|---|---|---|---|---|---|---|---|---|---|
| (pc) | (mag) | (1021 cm-2) | (keV) | (ergs s-1) | |||||
| HD 100546 | B9Vne | 110 | 0.10 - 1.03 | 4,8,9,10,11 | 2.5 | 0.6 | 29.57 | 5.39 | (1) |
| AB AurddTabulated AB Aur X-ray properties are based on fits of XMM-Newton archive data (ObsId 0671960101). See text. | A0Ve-B9.5e | 163 | 0.25 - 0.73 | 4,5,6,7,8,11 | 2.1 | 0.4 | 29.63 | 5.63 | (1) |
| AB AureeTabulated AB Aur X-ray properties are based on two-temperature variable abundance fits of XMM-Newton ObsId 01011440801 with NH,xray held fixed (Telleschi et al. 2007b). Their Lx(0.3-10 keV) value has been adjusted upward to d = 163 pc. | … | … | … | … | [0.5] | 0.4 | 29.73 | 5.53 | (2) |
| HD 163296 | A1Ve | 102 | 0.19 - 0.30 | 4,6,7,11 | 0.8 | 0.5 | 29.44 | 5.48 | (3) |
5.3 Similarities Between HD 100546, AB Aur, and HD 163296
Several X-ray properties of HD 100546, including its soft spectrum, have been seen in two other Herbig stars, AB Aur and HD 163296 (Table 6).
AB Aur is an extensively studied Herbig Ae star that is often taken to be the prototype of the class. Its spectral type of A0Ve - B9.5e is nearly identical to that of HD 100546 (B9Vne). It is somewhat more distant at a Gaia DR2 distance of d = 162.9 (range 161.4 - 164.4) pc. A detailed discussion of its X-ray properties based on XMM-Newton EPIC and Relection Grating Spectrometer (RGS) spectra (ObsId 0101440801; 21-22 Sep 2001) was given by Telleschi et al. (2007b). Their 2T spectral fits show a soft X-ray spectrum with characteristic plasma temperature kTwgtd = 0.45 keV (Table 6), similar to but slightly cooler than HD 100546.
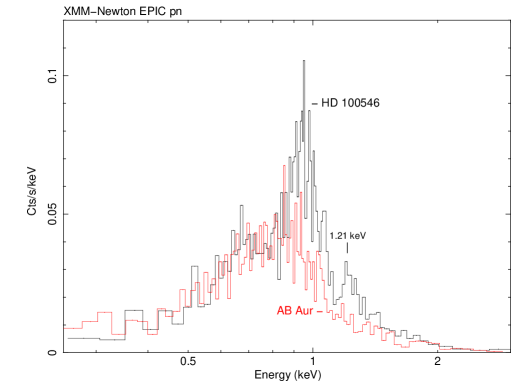
For an additional comparison, we downloaded archive data for a XMM-Newton observation of AB Aur obtained on 15-17 Feb 2012 (ObsId 0671960101). The EPIC pn event list was filtered to remove high background intervals, resulting in 92,273 s of usable pn exposure. No time filtering was applied to the MOS data, which had livetimes of 97.45 ks (MOS1) and 97.74 ks (MOS2). EPIC spectra and associated response files were extracted using SAS v. 17.0. The pn spectrum is overlaid on that of HD 100546 in Figure 8. The spectra are quite similar below 0.9 keV, but HD 100546 shows stronger emission at higher energies such as the feature at 1.21 keV that is not visible in the pn spectrum of AB Aur.
Our 2T APEC fits of AB Aur are acceptable and fitting the spectra of all three EPIC detectors simultaneously gives NH = 2.1 (1.8-2.4; 1) 1021 cm-2, kT1 = 0.22 (0.20-0.25) keV, kT2 = 0.82 (0.79-0.88) keV, kTwgtd = 0.42 keV, metallicity = 0.14 , absorbed flux Fx,abs(0.3-8 keV) = 4.8010-14 ergs cm-2 s-1, log Lx(0.3-8 keV) = 29.63 ergs s-1 (d = 163 pc). If the pn data are excluded and the two MOS spectra are fitted simultaneously the kT values are nearly unchanged but the best-fit absorption decreases slightly to NH = 1.9 (1.5-2.5; 1) 1021 cm-2. The emission measure weighted plasma temperature (kTwgtd) and Lx values are nearly the same as determined by Telleschi et al. (2007b) using earlier AB Aur data acquired in 2001. However, our fits of the 2012 data suggest a somewhat higher NH = 2.00.5 1021 cm-2 (AV 1.10.3 mag) than their value NH = 0.5 1021 cm-2, which was based on XEST results.
Telleschi et al. (2007b) concluded that the X-ray emission of AB Aur was consistent with predictions of either the current sheet model or soft coronal emission, as discussed above for HD 100546. They noted that the observed X-ray temperature of AB Aur was also compatible with an accretion shock, but electron densities estimated from O VII triplet line ratios were about 100 times smaller than predicted by accretion shock models.
The Herbig star HD 163296 (A1Ve) also has similar X-ray properties to those of HD 100546 (Table 6). Kinematic evidence of one or more exoplanets orbiting HD 163296 has been reported (Pinte et al. 2018; Teague et al. 2018). Analysis of a 19.2 ks Chandra ACIS-S observation by Swartz et al. (2005) revealed low absorption NH = 7.621.85 1020 cm-2, a soft spectrum with plasma temperature kT = 0.490.03 keV, and log Lx(0.3-3 keV) = 29.44 ergs s-1 normalized to the Gaia DR2 distance of 101.5 pc. Their fitted NH value is slightly higher than expected based on AV = 0.25 mag. No large amplitude X-ray variability was seen but count rate fluctuations of less than 20% were not ruled out. They considered several potential emission mechanisms and concluded that the X-ray properties could be explained by an accretion shock formed at the stellar surface by magnetically-channeled infalling gas. However, their analysis was based on undispersed CCD spectra (as is our HD 100546 analysis) so precise information on individual line widths and density-sensitive line flux ratios was not available. They also pointed out that penetration of the accretion shock into the stellar photosphere (“buried shock”) is a potential problem for the accretion shock interpretation.
The remarkable similarity in the X-ray properties of HD 100546, AB Aur, and HD 163296 (Table 6) leaves little doubt that their X-ray production involves a common mechanism. It is very unlikely that such a close similarity would arise if the X-rays were due to close unseen late-type companions, especially so since no stellar companions have yet been detected. Consequently, the X-ray emission of these three similar Herbig stars is very likely intrinsic but the underlying mechanism responsible for the emission is still controversial. Accretion shock emission is consistent with our results for HD 100546 and for HD 163296 (Swartz et al. 2005), but Telleschi et al. (2007b) favored the current sheet or soft corona models for AB Aur.
5.4 X-ray Ionization and Heating of the Disk
X-rays ionize and heat disk gas, mainly affecting upper disk layers above the midplane where most X-ray absorption occurs. We have estimated the X-ray ionization and heating rates in the HL Tau and HD 100546 disks using the procedure outlined below. Our methodology is based on the analytic results of Shang et al. (2002) and follows the procedures given in Igea & Glassgold (1999) and Glassgold et al. (1997a, 1997b, 2004). The approach is the same as that of our previous analysis of the LkCa 15 disk (SG17).
As in previous work, the disk is assumed to be aximuthally symmetric and dominated by molecular hydrogen with an abundance ratio He/H = 0.1 by number. Cylindrical coordinates () specify the radial distance from the star in the midplane ( = 0) and height above the disk midplane. The X-ray ionization rate at a given position is (eq. [1] of SG17)
| (1) |
where is the distance of the X-ray source above (or below) the center of the disk, 37 eV is the energy to create an ion pair, and the function describes the X-ray attenuation at optical depth and energy . The attenuation factor is evaluated down to a lower limit /kTx (eq. [C1] of Shang et al. 2002), where is the cutoff energy. The value adopted for is somewhat arbitrary and we use = 0.1 keV. Larger values of result in slightly flatter ionization rate versus curves at small optical depths (Glassgold et al. 1997a; Skinner & Güdel 2013).
The primary X-ray ionization rate is (eq. [2] of SG17)
| (2) |
where = is the photoelectric X-ray absorption cross-section per H nucleus evaluated at energy . The X-ray cross-section is approximated by a power-law in photon energy of the form = (E/1 keV)-p cm-2 where we use = 2.27 10-22 cm2 and = 2.485, as appropriate for solar-abundance disk material. If heavy elements are depleted then decreases (Glassgold et al. 1997a).
The X-ray heating rate per unit volume is proportional to the ionization rate and is given by
| (3) |
where is the heating rate per ionization and is the number density of hydrogen nuclei in the disk. We adopt = 17 eV as in previous studies, which then gives
| (4) |
Tables 7 and 8 give the computed values of and for HL Tau and HD 100546, evaluated at a distance = 1 au from the star. The rates are tabulated for the height above the disk midplane at which the X-ray optical depth is unity ( = 1). X-rays of higher energy will penetrate to greater depths, all other factors being equal.
For HL Tau, we assume = 4 to mimic X-ray emission from coronal loops. For HD 100546, we use = to represent X-rays originating at or near the stellar surface as in an accretion shock. However, the computed values of and far from the star ( R∗) are not very sensitive to the assumed value of as long as is not larger than a few stellar radii. Since HD 100546 was fitted with a 2T model (Table 4), separate rates are given for each temperature component in Table 8, using kT1 = 0.3 keV and kT2 = 1.0 keV as representative temperatures for the 2T fits.
A key parameter is the disk gas surface density , which effectively determines the number density in the disk, thus affecting X-ray absorption and the heating rate. Specifically, (,) = (,)/(mp) where is the mass density, mp is the proton mass, and = 1.42 for H-nuclei (Glassgold et al. 2004). The mass density is (,) = exp[0.5(/H())2] where the midplane density is = 0.4[/H()], and H() is the pressure scale height. In general, is not well-determined observationally close to the star due to limitations on telescope spatial resolution. To account for this uncertainty, we have computed the rates for two different values of (=1 au) based on published estimates. For HL Tau, we have used = 103 and 102 g cm-2 as representative values (Pinte et al. 2016; Cridland et al. 2019). For HD 100546 the surface density is lower and we adopt = 10 and 1 g cm-2 for comparison (Mulders et al. 2013; Pineda et al. 2014). As is evident from Tables 7 and 8, for a given incident X-ray spectrum the penetration depth into the disk decreases as increases.
The values given in Tables 7 and 8 can be scaled to other radii but the scaling relations depend on the adopted disk model. The ionization rate (eq. [1]) scales as , all other factors being equal. The heating rate then scales as . If power-law dependencies and H() are assumed, then exp[0.5(/H()2]. We have adopted = 1 and = 1.25 and assume the disk is in hydrostatic equilibrium with a radial temperature dependence T() , but constant in the direction. Multiple variations on the above scaling relations can be found in the literature. In addition, the above power-law profiles are idealizations and accounting for structure within the disk requires more detailed models (e.g. Mulders et al. 2013 for HD 100546).
Despite the differences in disk and X-ray properties, the main conclusion is similar for both stars. X-ray heating and ionization are restricted to the uppermost disk layers at 4-5 scale heights above the midplane. This conclusion is of particular interest for HD 100546 since the study of the disk gas by Bruderer et al (2012) concluded that the gas temperature exceeds the dust temperature in the inner upper disk by factors of up to 50. In addition, evidence for warm molecular disk gas was reported by Panić et al. (2010) on the basis of CO observations. In both stars, (=1 au,=0) 1, so any exoplanets in the midplane at 1 au are well-shielded from X-rays.
| r | z/H0 | E | N⟂ | ||||
|---|---|---|---|---|---|---|---|
| (au) | (keV) | (g cm-2) | (cm-3) | (cm-2) | (s-1) | (ergs s-1 cm-3) | |
| 1 | 4.4 | 3.0 | 103 | 1.56e10 | 2.64e21 | 3.18e-11 | 1.35e-11 |
| 1 | 3.8 | 3.0 | 102 | 1.82e10 | 2.64e21 | 3.18e-11 | 1.57e-11 |
Note. — The ionization rate (eq. [1]) and heating rate (eq. [4]) are computed using kT = 3 keV and average Lx = 3.4 1030 ergs s-1 (Table 5). The rates are computed at =1 au for the specified value /H0, the number of scale-heights above the midplane corresponding to = 1. Two different assumed values of the gas surface density (r = 1 au) are shown for comparison. The disk scale height is H0 H(r = 1 au) = 6.76 1011 cm = 0.045 au, assuming a midplane temperature T(=1 au,=0) = 435 K. The quantity is the number density of H-nuclei at the specified point (,) in the disk. At the midplane, the adopted disk parameters give (=1 au,=0) = 2.49 1014 cm-3 ( = 103 g cm-2), which scales linearly with . The vertically-integrated H-nuclei column density from infinity down to the specified height above the midplane is N⟂ (eq. [4] of SG17). The X-ray source is assumed to lie 4 stellar radii above the surface (/ = 4) to mimic X-ray emission from coronal loops. The primary ionization rate (eq. [2]) is = 2.44 10-9 s-1. Scaling Relations: See text (Sec. 5.4).
| r | z/H0 | E | N⟂ | ||||
|---|---|---|---|---|---|---|---|
| (au) | (keV) | (g cm-2) | (cm-3) | (cm-2) | (s-1) | (ergs s-1 cm-3) | |
| 1 | 4.9 | 0.3 | 10 | 1.47e07 | 1.74e18 | 5.32e-10 | 2.13e-13 |
| 1 | 4.4 | 1.0 | 10 | 1.50e08 | 3.47e19 | 1.43e-11 | 5.83e-14 |
| 1 | 4.4 | 0.3 | 1 | 1.50e07 | 1.74e18 | 5.32e-10 | 2.17e-13 |
| 1 | 3.8 | 1.0 | 1 | 1.76e08 | 3.47e19 | 1.43e-11 | 6.85e-14 |
Note. — Same as Table 7 except for HD 100546. Separate values of and are computed for cool (E = kT1 = 0.3 keV) and warm (E = kT2 = 1 keV) temperature components in 2T thermal spectral fits. H0 H(r = 1 au) = 7.03 1011 cm = 0.047 au, assuming T( = 1 au,=0)) = 865 K. At the midplane, (=1 au,=0) = 2.4 1012 cm-3 if = 10 g cm-2, which scales linearly with . The X-ray source is assumed to lie at the stellar surface (/ = 1) to mimic accretion shock emission. For the cool component: Lx,1 = 2 1029 ergs s-1 and = 1.08 10-5 s-1. For the warm component: Lx,2 = 1 1029 ergs s-1 and = 8.12 10-8 s-1. Scaling Relations: See text (Sec. 5.4).
6 Summary
-
•
We have presented the results of new pointed observations which clarify the X-ray properties of the protostar HL Tau and its TTS neighbor XZ Tau, and the Herbig Be star HD 100546.
-
•
The X-ray emission of HL Tau is dominated by hot plasma (kT 2 - 4 keV) viewed through substantial absorption (log NH = 22.4 cm-2) and is variable. Its X-ray luminosity based on the new Chandra observations agrees well with that of classical TTS in Taurus of similar mass. However, its X-ray absorption is high (equivalent to AV 13 mag), most likely a result of the central star being viewed through an extended remnant envelope of infalling gas. No extended soft X-ray emission along the HL Tau optical jet near the star was detected. The above properties are typical of magnetically-active late-type coronal sources. Modeling of a large X-ray flare detected previously by XMM-Newton supports the idea that the X-rays arise in magnetic structures (Giardino et al. 2006).
-
•
The classical TTS binary XZ Tau AB located near HL Tau is a bright weakly-absorbed variable X-ray source. No significant X-ray emission along its jet was seen.
-
•
The X-ray emission of HD 100546 is dominated by cool plasma (kT 1 keV) viewed through low but non-negligible absorption (log NH = 21.3 cm-2; Av 1 mag). No significant X-ray variability was detected. Its X-ray properties are strikingly similar to the Herbig stars AB Aur and HD 163296, suggesting that the emission of these three stars is intrinsic and due to the same mechanism, and does not originate in unseen late-type companions. Several possible X-ray mechanisms were considered for HD 100546 and we conclude that an accretion shock model provides a reasonably good explanation of its X-ray properties. Higher resolution grating spectra capable of measuring fluxes and widths of individual emission lines will be needed to further test the accretion shock interpretation and make more detailed comparisons with predictions of other models.
-
•
For both HL Tau and HD 100546, X-ray ionization and heating is restricted mainly to upper disk layers well above the midplane. Any exoplanets in the midplane at 1 au are well-shielded from X-rays.
References
- Alexander et al. [2014] Alexander, R., Pascucci, I., Andrews, S., Armitage, P., & Cieza, L. 2014, in Protostars and Planets VI, eds. H. Beuther et al. (Tucson, AZ: Univ. of Arizona Press), 475
- Anders & Grevesse [1989] Anders, E., & Grevesse, N. 1989, Geochim. Cosmochim. Acta, 53, 197
- Ardila et al. [2007] Ardila, D.R., Golimowski, D.A., Krist, J.E., Clampin, M., Ford, H.C., & Illingworth, G.D. 2007, ApJ, 665, 512
- Aresu et al. [2012] Aresu, G., Meijerink, R., Kamp, I., Spaans, M., Thi, W.-F., & Woitke, P. 2012, A&A, 547, A69
- Arnaud [1996] Arnaud, K.A. 1996, in ASP Conf. Series vol. 101, Astronomical Data Analysis Software and Systems V, ed. G. Jacoby & J. Barnes (San Francisco, CA; ASP), 17
- Augereau et al. [2001] Augereau, J.-C., Lagrange, A.-M.,Mouillet, D. & Menard, F. 2001, A&A, 365, 78
- Babel & Montmerle [1997] Babel, J. & Montmerle, T. 1997, A&A, 323, 121
- Bagnulo et al. [2015] Bagnulo, S., Fossati, L., Landstreet, J.D., & Izzo, C. 2015, A&A, 583, A115
- Balbus & Hawley [1991] Balbus, S.A. & Hawley, J.F. 1991, ApJ, 376, 214
- Bally et al. [2003] Bally, J., Feigelson, E., & Reipurth, B. 2003, ApJ, 584, 843
- Beck et al. [2010] Beck, T., Bary, J.S., & McGregor, P.J. 2010, ApJ, 722, 1360
- Brittain et al. [2014] Brittain, S.D., Carr, J.S., Najita, J.R., Quanz, S.P., & Meyer, M.P. 2014, ApJ, 791, 136
- Brogan et al. [2015] Brogan, C.L., Pérez, L.M., Hunter, T.R. et al. (ALMA Partnership) 2015, ApJ, 808, L3
- Bruderer et al. [2012] Bruderer, S., van Dishoeck, E.F., Doty, S.D., & Herczeg, G.J. 2012, A&A, 541, A91
- Carrasco-González et al. [2009] Carrasco-González, C., Rodríguez, L.F., Anglada, G., & Curiel, S. 2009, ApJ, 693, L86
- Cecchi-Pestellini et al. [2006] Cecchi-Pestellini, C., Ciaravella, A., & Micela, G. 2006, A&A, 458, L13
- Cridland et al. [2019] Cridland, A.J., Pudritz, R.E., & Alessi, M. 2019, MNRAS, 484, 345
- Csépány et al. [2017] Csépány, G., van den Ancker, M., Ábrahám, P., Köhler, R., Brandner, W., Hormuth, F., & Hiss, H. 2017, A&A, 603, A74
- Cugno et al. [2019] Cugno, G., Quanz, S.P., Hunziker, S. et al. 2019, A&A, 622, A156
- Currie et al. [2015] Currie, T., Clouther, R., Brittain, S. et al. 2015, ApJ, 814, L27
- Davis et al. [2012] Davis, J.E., Bautz, M.W., Dewey, D. et al. 2012, Proc. SPIE, 8443, 84431A
- Deleuil et al. [2004] Deleuil, M., Lecavelier des Etangs, A., Bouret, J.-C. et al. 2004, A&A, 418, 577
- Donati et al. [1997] Donati, J.-F., Semel, M., Carter, B.D., Rees, D.E., & Cameron, A.C. 1997, MNRAS, 291. 658
- Elia et al. [2004] Elia, D., Strafella, F., Campeggio, L., Giannini, T., Lorenzetti, D., Nisini, B., & Pezzuto, S. 2004, ApJ, 601, 1000
- Fairlamb et al. [2015] Fairlamb, J.R., Oudmaijer, R.D., Mendigutía, I., Ilee, J.D., & van den Ancker, M.E. 2015, MNRAS, 453, 976
- Feigelson [2010] Feigelson, E.D. 2010, PNAS, 107, 7153
- Feigelson et al. [2003] Feigelson, E.D., Lawson, W.A., & Garmire, G.P. 2003, ApJ, 599, 1207
- Feigelson & Montmerle [1999] Feigelson, E.D. & Montmerle, T. 1999, ARA&A, 37, 363
- Fruscione et al. [2006] Fruscione, A., McDowell, J.C., Allen, G.E. et al. 2006, Proc. SPIE, 6270, 62701V
- Gabriel et al. [2004] Gabriel, C., Denby, M., Fyfe, D.J. et al. 2004, in ASP Conf. Series vol. 314, Astronomical Data Analysis Software and Systems XIII, ed. F. Ochsenbein, M.G. Allen, & D. Egret (San Francisco, CA; ASP), 759
- Garcia Lopez et al. [2006] Garcia Lopez, R., Natta, A., Testi, L., & Habart, E. 2006, A&A, 459, 837
- Giardino et al. [2006] Giardino, G., Favata, F., Silva, B., Micela, G., Reale, F., & Sciortino, S. 2006, A&A, 453, 241
- Glassgold et al. [1997] Glassgold, A.E., Najita, J., & Igea, J. 1997a, ApJ, 480, 344
- Glassgold et al. [1997] Glassgold, A.E., Najita, J., & Igea, J. 1997b, ApJ, 485, 920
- Glassgold et al. [2004] Glassgold, A.E., Najita, J., & Igea, J. 2004, ApJ, 615, 972
- Gorenstein [1975] Gorenstein, P., 1975, ApJ, 198, 95
- Grady et al. [2001] Grady, C.A., Polomski, E.F., Henning, T. et al. 2001, AJ, 122, 3396
- Grady et al. [1997] Grady, C.A., Sitko, M.L., Bjorkman, K.S., Pérez, M.R., Lynch, D.K., Russell, R.W., & Hanner, M.S. 1997, ApJ, 483, 449
- Grady et al. [2005] Grady, C.A., Woodgate, B., Heap, S.R., Bowers, C., Nuth, J.A., & Herczeg, G.J. 2005, ApJ, 620, 470
- Güdel et al. [1989] Güdel, M., Benz, A.O., Catala, C., & Praderie, F. 1989, A&A, 217, L9
- Güdel et al. [2007] Güdel, M., Briggs, K.R., Arzner, K. et al. 2007, A&A, 468, 353
- Güdel et al. [1997] Güdel, M., Guinan, E.F., & Skinner, S.L. 1997, ApJ, 483, 947
- Güdel et al. [2008] Güdel, M., Skinner, S.L., Audard, M., Briggs, K.R., & Cabrit, S. 2008, A&A, 478, 797
- Haas et al. [1990] Haas, M., Leinert, Ch., & Zinnecker, H. 1990, A&A, 230, L1
- Hartigan & Kenyon [2003] Hartigan, P. & Kenyon, S.J. 2003, ApJ, 583, 334
- Hartmann et al. [2016] Hartmann, L., Herczeg, G., & Calvet, N. 2016, ARA&A, 54, 135
- Hayashi et al. [1993] Hayashi, M., Ohashi, N., & Miyama, S.M. 1993, ApJ, 418, L71
- Hillenbrand et al. [1992] Hillenbrand, L., Strom, S.E., Vrba, F.J., & Keene, J. 1992, ApJ, 397, 613
- Hubrig et al. [2013] Hubrig, S., Ilyin, I., Schöller, M., & Lo Curto, G. 2013, AN, 334, 1093
- Hubrig et al. [2004] Hubrig, S., Schöller, M., & Yudin, R.V. 2004, A&A, 428, L1
- Igea & Glassgold [1999] Igea, J. & Glassgold, A.E. 1999, ApJ, 518, 848
- Jamialahmadi et al. [2018] Jamialahmadi, N., Ratzka, T., Panić, O. et al. 2018, ApJ, 865, 137
- Järvinen et al. [2019] Järvinen, S.P., Carroll, T.A., Hubrig, S., Ilyin, I., & Schöller, M. 2019, MNRAS, 489, 886
- Keppler et al. [2018] Keppler, M., Benisty, M., Müller, A. et al. 2018, A&A, 617, A44
- Königl [1991] Königl, A. 1991, ApJ, 370, L39
- Kraus & Ireland [2012] Kraus, A.L. & Ireland, M.J. 2012, ApJ, 745, 5
- Krist et al. [2008] Krist, J.E., Stapelfeldt, K.R., Hester, J.J., Healy, K., Dwyer, S.J., & Gardner, C.L. 2008, AJ, 136, 1980
- Lamers & Cassinelli [1999] Lamers, H.J.G.L.M. & Cassinelli, J.P. 1999, Introduction to Stellar Winds (Cambridge: Cambridge Univ. Press), 46
- Lammer et al. [2003] Lammer, H., Stelsis, H., Ribas, I., Guinan, E.F., Bauer, S.J., & Weiss, W.W, 2003, ApJ, 598, L121
- Malfait et al [1998] Malfait, K., Waelkens, C., Waters, L.B.F.M., Vandenbussche, B., Huygen, E., & de Graauw, M.S. 1998, A&A, 332, 25
- Movsessian et al. [2012] Movsessian, T.A., Magakian, T. Yu., & Moiseev, A.V. 2012, A&A, 541, A16
- Mulders et al. [2013] Mulders, G.D., Paardekooper, S.-J., Panić, O., Dominik, C., van Boekel, R., & Ratzka, T. 2013, A&A, 557, A68
- Mundt et al. [1990] Mundt, R., Buehrke, T., Solf, J., Ray, T.P., & Raga, A.C. 1990, A&A, 232, 37
- Owen & Jackson [2012] Owen, J.E. & Jackson, A.P. 2012, MNRAS, 425, 2931
- Palla & Stahler [1993] Palla, F. & Stahler, S.W. 1993, ApJ, 418, 414
- Panić et al. [2014] Panić, O., Ratzka, Th., Mulders, G.D., Dominik, C., van Boekel, R., Henning, Th., Jaffe, W., & Min, M. 2014, A&A, 562, A101
- Panić et al. [2010] Panić, O., van Dishoeck, E.F., Hogerheidje, M.R., Belloche, A., Güsten, R., Boland, W., & Baryshev, A. 2010, A&A, 519, A110
- Pineda et al. [2014] Pineda, J.E., Quanz, S.P., Meru, F., Mulders, G.D., Meyer, M.R., Panić, O., & Avenhaus, H. 2014, ApJ, 788, L34
- Pineda et al. [2019] Pineda, J.E., Szulágyi, J., Quanz, S.P. et al. 2019, ApJ, 871, 48
- Pinte et al. [2016] Pinte, C., Dent, W.R.F., Ménard, F., Hales, A., Hill, T., Cortes, P., & de Gregorio-Monsalvo, I., 2016, ApJ, 816, 25
- Pinte et al. [2018] Pinte, C., Price, D.J., Ménard, F. et al. 2018, ApJ, 860, L13
- Preibisch et al. [2005] Preibisch, T., Kim, Y.-C., Favata, F. et al. 2005, ApJS, 160, 401
- Quanz et al. [2013] Quanz, S.P., Amara, A., Meyer, M.R., Kenworth, M.A., Kasper, M., & Girard, J.H. 2013, ApJ, 766, L1
- Quanz et al. [2015] Quanz, S.P., Amara, A., Meyer, M.R., Girard, J.H., Kenworth, M.A., & Kasper, M. 2015, ApJ, 807, 64
- Raga et al. [2002] Raga, A.C., Noriega-Crespo, A., & Velázquez, P.F. 2002, ApJ, 576, L149
- Rameau et al. [2017] Rameau, J., Follette, K.B., Pueyo, L. et al. 2017, AJ, 153, 244
- Roberge et al. [2001] Roberge, A., Lecavelier des Etangs, A., Grady, C.A. et al. 2001, ApJ, 551, L97
- Robitaille et al. [2007] Robitaille, T.P., Whitney, B.A., Indebetouw, R., & Wood, K. 2007, ApJS, 169, 328
- Rodríguez et al. [2014] Rodríguez, L.F., Zapata, L.A., Dzib, S.A., Ortiz-León, G.N., Loinard, L., Macías, E., & Anglada, G. 2014, ApJ, 793, L21
- Sallum et al. [2015] Sallum, S., Follette, K.B., Eisner, J.A. et al. 2015, Nature, 527, 342
- Shang et al. [2002] Shang, H., Glassgold, A.E., Shu, F.H., & Lizano, S. 2002, ApJ, 564, 853
- Sissa et al. [2018] Sissa, E., Gratton, R., Garufi, A. et al. 2018, A&A, 619, A160
- Skinner et al. [2011] Skinner, S.L., Audard, M., & Güdel, M. 2011, ApJ, 737, 19
- Skinner et al. [2016] Skinner, S.L., Audard, M., & Güdel, M. 2016, ApJ, 826, 84
- Skinner et al. [1993] Skinner, S.L., Brown, A., & Stewart, R.T. 1993, ApJS, 87, 217
- Skinner & Güdel [2013] Skinner, S.L. & Güdel, M. 2013, ApJ, 765, 3
- Skinner & Güdel [2017] Skinner, S.L. & Güdel, M. 2017, ApJ, 839, 45 (SG17)
- Skinner et al. [2004] Skinner, S.L., Güdel, M., Audard, M., & Smith, K., 2004, ApJ, 614, 221
- Stahler & Palla [2004] Stahler, S.W. & Palla, F. 2004, in The Formation of Stars (Weinheim, Germany; Wiley VCH), 685
- Stelzer et al. [2009] Stelzer, B., Hubrig, S., Orlando, S., Micela, G., Mikulášek, Z., & Schöller, M. 2009, A&A, 499, 529
- Stelzer et al. [2006] Stelzer, B., Micela, G., Hamaguchi, K., & Schmitt, J.H.M.M. 2006, A&A, 457, 223
- Strüder, L. et al. [2001] Strüder, L., Briel, U., Dennerl, K. et al. 2001, A&A, 365, L18
- Swartz et al. [2005] Swartz, D.A., Drake, J.J., Elsner, R.F. et al. 2005, ApJ, 628, 811
- Teague et al. [2018] Teague, R., Bae, J., Bergin, E.A., Birnstiel, T., & Foreman-Mackey, D. 2018, ApJ, 860, L12
- Telleschi et al. [2007a] Telleschi, A., Güdel, M., Briggs, K.R., Audard, M., & Palla, F. 2007a, A&A, 468, 425
- Telleschi et al. [2007b] Telleschi, A., Güdel, M., Briggs, K.R., Skinner, S.L., Audard, M., & Franciosini, E. 2007b, A&A, 468, 541
- Tout & Pringle [1995] Tout, C.A. & Pringle, J.E., 1995, MNRAS, 272, 528
- Turner et al. [2001] Turner, M.J.L., Abbey, A., Arnaud, M. et al. 2001, A&A, 365, L27
- ud-Doula & Owocki [2002] ud-Doula, A. & Owocki, S.P. 2004, ApJ, 576, 413
- Usov & Melrose [1992] Usov, V.V. & Melrose, D.B. 1992, ApJ, 395, 575 (UM92)
- Valenti et al. [2003] Valenti, J.A., Fallon, A.A., & Johns-Krull, C.M. 2003, ApJS, 147, 305
- Valenti et al. [2000] Valenti, J.A., Johns-Krull, C.M., & Linsky, J.L. 2000, ApJS, 129, 399
- van den Ancker et al. [1998] van den Ancker, M.E., de Winter, D., & Tjin A Djie, H.R.E. 1998, A&A, 330, 145
- Vioque et al. [2018] Vioque, M., Oudmaijer, R.D., Baines, D., Mendigutía, I., & Pérez-Martínez, R. 2018, A&A, 620, A128
- Vuong et al. [2003] Vuong, M.H., Montmerle, T., Grosso, N., Feigelson, E.D., Verstraete, L., & Ozawa, H., 2003, A&A, 408, 581
- White & Ghez [2001] White, R.J. & Ghez, A.M. 2001, ApJ, 556, 265
- White & Hillenbrand [2004] White, R.J. & Hillenbrand, L.A. 2004, ApJ, 616, 998
- Wright et al. [2015] Wright, C.M., Maddison, S.T., Wilner, D.J. et al. 2015, MNRAS, 453, 414