Overcharging of zinc ion in the structure of zincfinger protein is needed for DNA binding stability
Abstract
Zinc finger structure, where a Zn2+ ion binds to four 4 cysteines or histidines in a tetrahedral structure, is a very common motif of nucleic acidbinding proteins. The corresponding interaction model is present in 3% of the genes in human genome. As a result, zincfinger has been extremely useful in various therapeutic and research capacities, and in biotechnology. In stable configuration of zincfinger, the cysteine amino acids are deprotonated and become negatively charged. Thus, the Zn2+ ion is overscreened by four cysteine charges (overcharged). Whether this overcharged configuration is also stable when such a negatively charged zincfinger binds to a negatively charged DNA molecule is unknown. We investigated how the deprotonated state of cysteine influences its structure, dynamics, and function in binding to DNA molecules by using an allatom molecular dynamics simulation up to microsecond range of an androgen receptor protein dimer. Our results showed that the deprotonated state of cysteine residues is essential for mechanical stabilization of the functional, folded conformation. Not only this state stabilizes the protein structure, it also stabilizes the proteinDNA binding complex. The differences in structural and energetic properties of the two sequence-identical monomers are also investigated and show the strong influence of DNA on the structure of zinc-fingers protein dimer upon complexation. Our result can potentially lead to better molecular understanding of one of the most common classes of zinc fingers.
keywords:
Zinc-finger, Overcharging, DNA binding, Molecular Dynamics, cysteine deprotonationKL]Key Laboratory for Multiscale Simulations of Complex Systems, VNU University of Science,
Vietnam National University, Hanoi,
334 Nguyen Trai street, Thanh Xuan district, Hanoi, Vietnam
KL]Key Laboratory for Multiscale Simulations of Complex Systems, VNU University of Science,
Vietnam National University, Hanoi,
334 Nguyen Trai street, Thanh Xuan district, Hanoi, Vietnam
HUST]Hanoi University of Science and Technology,
1 Dai Co Viet street, Bach Khoa, Hai Ba Trung district, Hanoi, Vietnam
KL]Key Laboratory for Multiscale Simulations of Complex Systems, VNU University of Science,
Vietnam National University, Hanoi,
334 Nguyen Trai street, Thanh Xuan district, Hanoi, Vietnam
KL]Key Laboratory for Multiscale Simulations of Complex Systems, VNU University of Science,
Vietnam National University, Hanoi,
334 Nguyen Trai street, Thanh Xuan district, Hanoi, Vietnam
1 Introduction
Zinc finger proteins are among the most abundant proteins in eukaryotic genomes. These proteins are encoded by 3% of the human genome 1, 2, 3. Their functions are extraordinarily diverse and include DNA recognition, RNA packaging, transcription activation, regulation of apoptosis, protein folding and assembly, and lipid binding. There are increasing evidence the potential roles of zinc finger in cancer progression 4. The aberrant expression of C2H2 zinc finger proteins contributes to tumorigenesis in many different aspects. Another example is their chaperon function in the nucleocapsid protein of the human immunodeficiency virus type 1 (HIV-1) 5. This protein plays an important role in the life cycle of this virus and has been an attractive target for therapeutic treatment. In biotechnology, their sequencespecific DNAbinding property is also used in bioengineering to target desired DNA genome sequences 6. For example, the prostatespecific antigen (PSA) protein, which has zincfingers for nucleic acid binding, is a common marker for prostate cancer 7. Therefore, one can detect the presence of PSA in a sample by using a substrate that is functionalized with aptamers (short DNA molecules) that only the PSA protein can recognize specifically 8, 9, 10, 11, 12, 13. The electrochemical properties of the substrate will change upon binding of PSA proteins to the aptamers and can be measured accurately using a companion electric circuit. The strength of the perturbation is a measure of the PSA concentration in the sample. Thus, PSA concentration can be detected and measured rather accurately, allowing for the early detection of prostate cancer.
Zinc finger structures are as diverse as their functions. However, the most common structure follows the same motif of a short -helix, two -strands and a loop 14. The amino acid residues of this protein segment are arranged in three-dimensional space such that the zinc ion would coordinate with 4 residues, Cys2His2, Cys3His or Cys4, to maintain the rigidity of the structure. The helix group then binds to the major groove of the DNA double helix. The rest of the residues form hydrogen bonds to appropriate nucleic acid residues in a sequence specific manner. This genome specificity makes zincfinger, either natural or artificially engineered, a very promising molecule for biotechnological application for gene therapy or recognition. Therefore, understanding the structure and functions of zincfinger proteins, especially at the molecular level, is very important for biological, biotechnological and bioengineering applications 15.
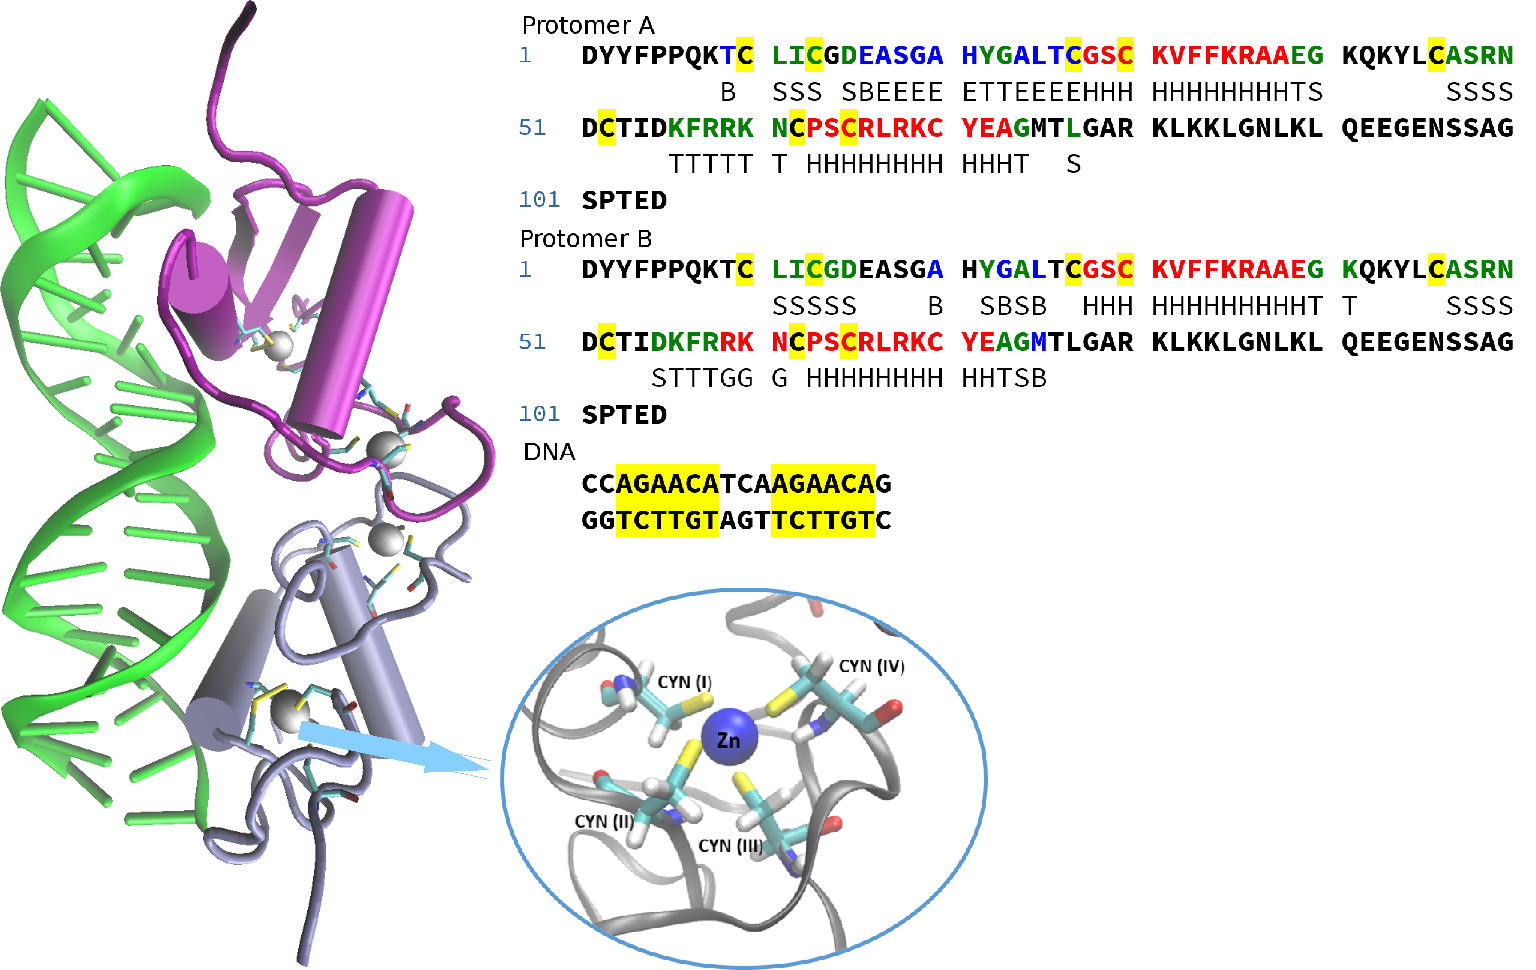
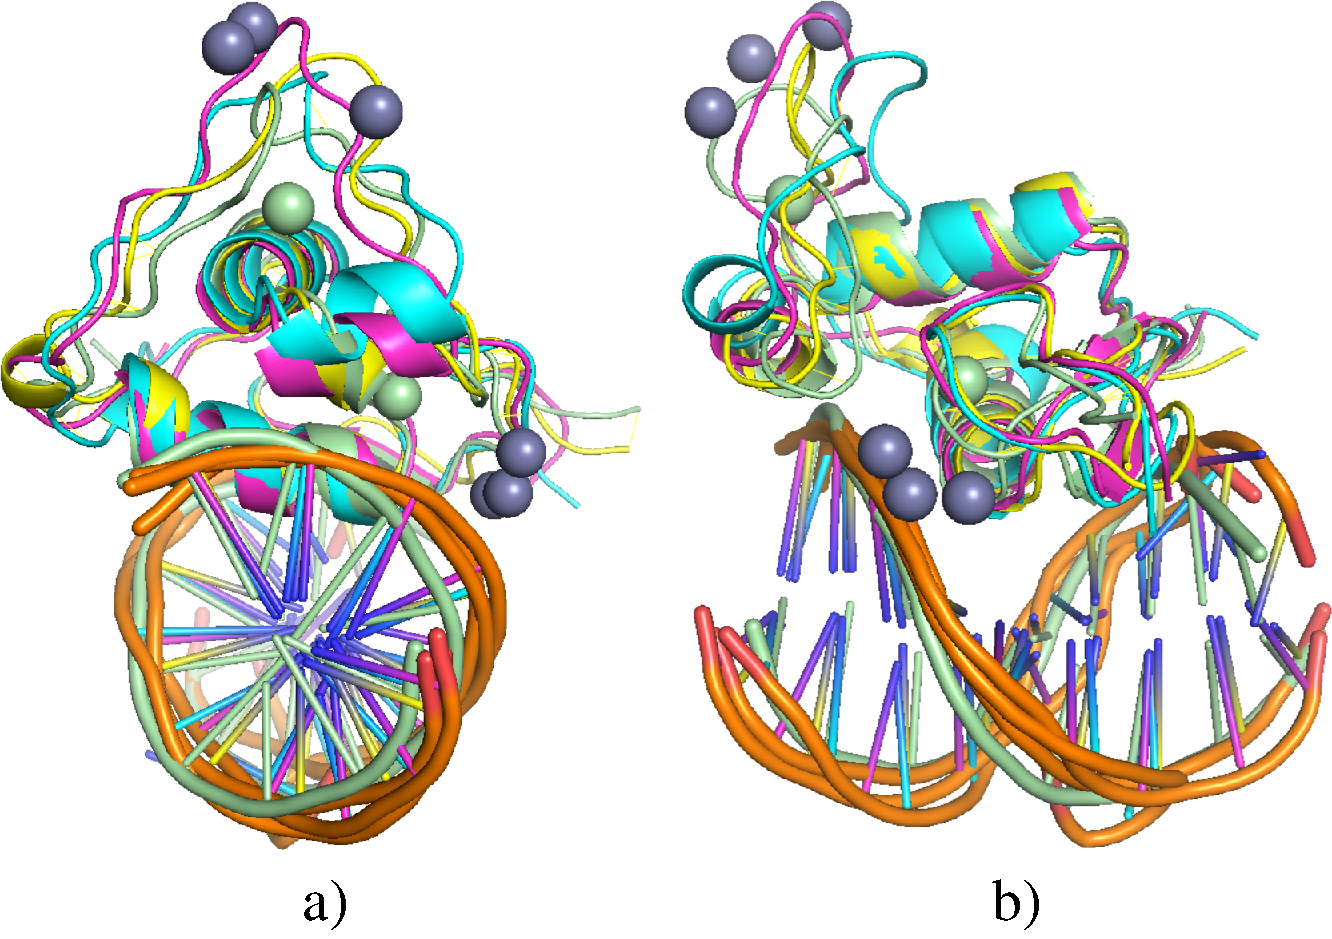
In this work, we focus on investigating the structures, stability and DNA-interaction mechanism of the androgen receptor DNAbinding domain 16 (see Fig. 1) using molecular dynamics simulations. Several recent computational studies have been conducted on zinc finger proteins 17, 18, 19, 20 with different focuses. In the present study, the androgen receptor DNA-binding domain is investigated not only because this is an important protein for prostate cancer biosensor application mentioned earlier, but also for several important reasons from biological and physical points of view:
First, these ZnCys4 proteins are standard, classical fold zinc fingers. Therefore, studying this structure can potentially elucidate the structure and dynamics of the most common class of zinc fingers. Additionally, the experimentally resolved structure also contains the direct repeat DNA response element that this protein binds to. This helps with truthful orientation of proteinDNA complex for computational investigation of their molecular interaction, which is one of the main goals of this work.
Second, this complex has a dimer of proteins, protomer A and protomer B, with identical amino acid sequences (Fig. 1). They also bind to identical ’AGAACA’ DNA sequences, called "upstream" and "downstream" repeat sequences. Yet, despite identical amino acid and nucleic acid sequences, the two protomers have two different, mirroring secondary structures and binding poses. This finding is an interesting deviation from standard concept in biology that sequence determines structure 21. The secondary structure information for each residue using DSSP classification is shown below their sequences in Fig. 1. Several strands are absent in this structure. Out of four zinc fingers present, only one zinc finger of protomer A shows the strands. All the standard strands of the other fingers have been downgraded to bridge bonds. This is clearly due to the change in the secondary structure upon binding of these proteins to DNA. Thus, investigating this system allows us to understand the influence of the interaction with DNA on the zinc finger structure at the molecular level.
Third, previous studies using molecular dynamics simulations 17, 22, quantum mechanical calculations 23, 24, or indirect experiment combined with simulation 25 have suggested that the cysteine amino acids in their electrostatic binding with zinc ion are not in their natural neutrally charged state but rather in their negatively charged deprotonated state. This case is a very interesting physics problem of overcharging. Indeed, the charge of the zinc ion is , whereas the total charge of the four deprotonated cysteine amino acids is . This means that the cysteine charges overcondense on the zinc ion. Hence, the net charge of the zinc ion is negative (overcharged). This finding is especially interesting based on the fact that DNA molecule is also negatively charged in aqueous solution. Thus, one has the situation where a negative zinc-finger complex binds to negative DNA molecule. This fact seems to be counter-intuitive from the electrostatic perspective.
The aim of this work is to understand the structure, interaction and mechanism of DNA binding of the dimeric zinc finger protein at the molecular level. However, this task would require comprehensive investigation in many different aspects. Here, we focus on the electrostatics of the zinc ion and how this electrostatics affects the structures and free energy of the complex. Overcharging in biological system happens when the screening charges are of high valence 26, 27, 28, 29, 30, 31, 32. In those cases, their mutual electrostatic interaction dominates over the spatial entropy, thereby resulting in the positional correlation of their distribution on a charged surface. This in turns leads to the overcondensation of these high valence counterions on the surface and the overscreening of its charge. The same physics also leads to the phenomenon of like-charge attraction of these surfaces in the presence of high valence counterions 26, 33. We argue that a similar physical mechanism is applied here. Cysteine amino acids have a charge of only and thus cannot be considered as highvalence screening charge. However, their attachment to the protein polypeptide backbone severely limits their mobility. As a result, cysteines cannot act as mobile negative charge in screening zinc ion. Hence, their spatial entropy is eliminated. This leads to the overcharging the zinc ion in the same way multivalent counterions overscreen charged surface when electrostatic interaction dominates over entropy.
Molecular dynamics are carried out for two systems in a setup similar to a previous study of isolated zinc finger proteins 17 to show the difference between undercharged and overcharged states, and to stress the influence of protein DNA interaction. The first system, called the CYN system, is the overcharged zinc-finger where the cysteine amino acids were deprotonated to become negatively charged. The second system, called the CYS system, is the zinc-finger in which the cysteine amino acids remained in their neutral uncharged state. The experiment Xray crystal structure will be used as the initial structure of both systems. Our results show that the overcharged zinc-finger is important for the stability of the protein structure even in their binding to negatively charged DNA molecule. In addition, the overcharged zinc-finger also has stable DNA binding pose whereas the complex deviates significantly from the experimental structure for the undercharged zinc-finger. There are also fewer differences between the two protomers in this weak DNA-binding system. Therefore, the main differences between the structures of sequenceidentical protomers A and B are due to their interactions with DNA.
This paper is organized as follows. After the introduction in Section 1, the detail of the computational procedure is presented in Section 2, the results are presented and discussed in Section 3. We conclude in Section 4.
2 Methods
2.1 Preparation of the simulation systems
The structure of the PSA protein’s zinc fingers and the DNA segment it binds to is downloaded from the Protein Data Bank (\urlhttps://www.rcsb.org/) with PDB code 1R4I. This structure was resolved using X-ray crystallography method with a resolution of 3.1Å16. The complex contains a DNA segment and two protein chains called protomers A and B, and four zinc ions. On each protein chain, the Cys542, Cys545, Cys559, and Cys562 amino acids bind to the first zinc ion (Zn1) and the Cys578, Cys584, Cys594, and Cys597 amino acids bind to the second zinc ion (Zn2) in a tetrahedral structure (Fig. 1). Four zinc fingers are present on this complex. Two zinc fingers are found on each protomer. Then, we manually remove the hydrogen atoms from the thiol group of 16 zinc-binding cysteine amino acids to investigate the difference between the CYS complex with cysteines in their natural state and the CYN complex with cysteines in the deprotonated state.
2.2 Molecular dynamics simulation
The periodic boundary condition is used in our simulation. After setting up the coordinates of the atoms, the periodic simulation box size is chosen such that the protomers and DNA complex on neighboring periodic boxes are at least 3nm apart, which is substantially larger than the screening length of the solution (about 0.7nm at 150mM NaCl salt concentration). This distance is large enough to eliminate the finite size effect due to the long-range electrostatic interactions, and yet maintain a small enough system for the simulation to run within a reasonable period of time with the available computing resource. The systems are then solvated with water molecules in an explicit solvent simulation. After solvation, Na+ and Cl- ions are added to the system at the physiological concentration of 150mM by randomly replacing water molecules with ions. The total charge of the system is zero to maintain the neutrality. The systems are then subjected to an energy minimization procedure using the steepest descent method to remove potentially high energy contacts and overlapping atoms before performing the molecular dynamics simulation.
All-atom molecular dynamics simulation with explicit solvent model is carried out in this work. The forcefield AMBER 99-ILDN34 is used to parameterize the protein molecules. The state of the art forcefield, PARMBSC1 35 is used to parameterize the DNA molecule. Water molecules are parameterized using the TIP3P forcefield 36, a common and highly compatible forcefield for the chosen Amber forcefields. The GROMACS version 2018.3 software package37 is used for the molecular dynamics simulation of the systems. Each system is subjected to equilibration in NVT and NPT ensembles at the temperature of 298 K and at the pressure of 1 atm for 100 ns. Then, a long production run of 1000 ns each is used to take statistics. Nose-Hoover thermostat 38, 39 is used to maintain the temperature of the systems. Parrinello-Rahman barostat 40, 41 is used to maintain the pressure of the systems. Both electrostatics and van de Waals interactions are cut off at 1.2nm. The long-range part of the electrostatic interactions among charges is calculated in the reciprocal -space using the Ewald summation via Particle Mesh Ewald method42 at the fourth order interpolation. The long-range part of the van de Waals interactions among atoms is approximated as appropriate corrections to the energy and pressure. All covalent bonds are constrained using the LINear Constraint Solver (LINCS) algorithm in order to increase the simulation time step to 2.5 fs 43.
2.3 Analysis the results of molecular dynamics simulation
Analysis of the simulation results is performed using the corresponding tools provided in the GROMACS package, such as the root mean square deviation (RMSD) and the root mean square fluctuation (RMSF) for the backbone atoms of both protomers and the DNA on each upstream or downstream complex. The visualization of the 3D structures of the systems is performed using the program VMD version 1.9.3 44. Some inhouse python scripts are used for various tasks and for combining different analysis softwares for RMSD-based clustering, covariance matrix calculations, and principal component analyses.
3 Results and discussions
3.1 Deviations and fluctuations of the structural backbone atoms of proteins and of DNA
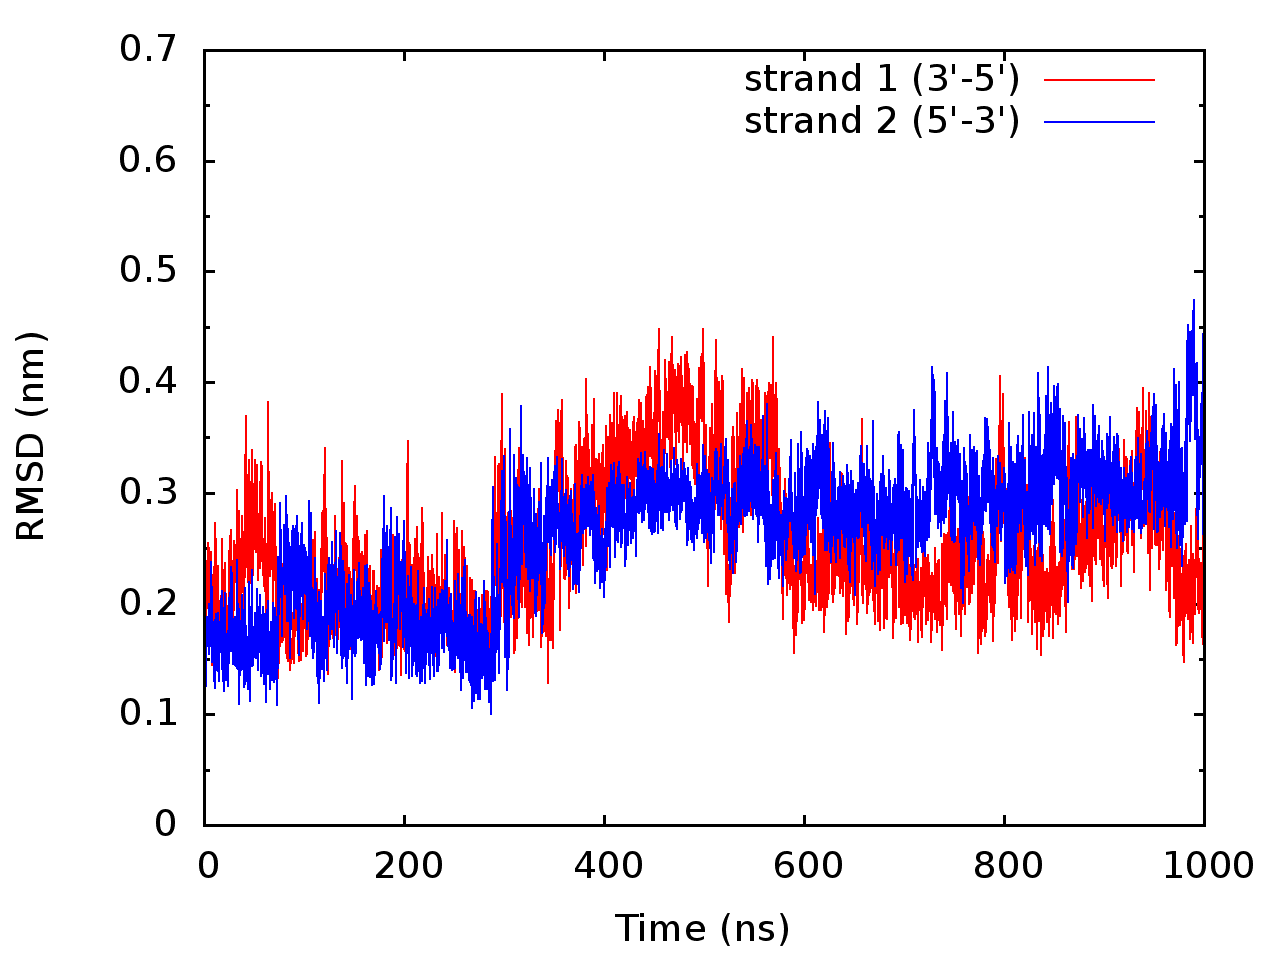
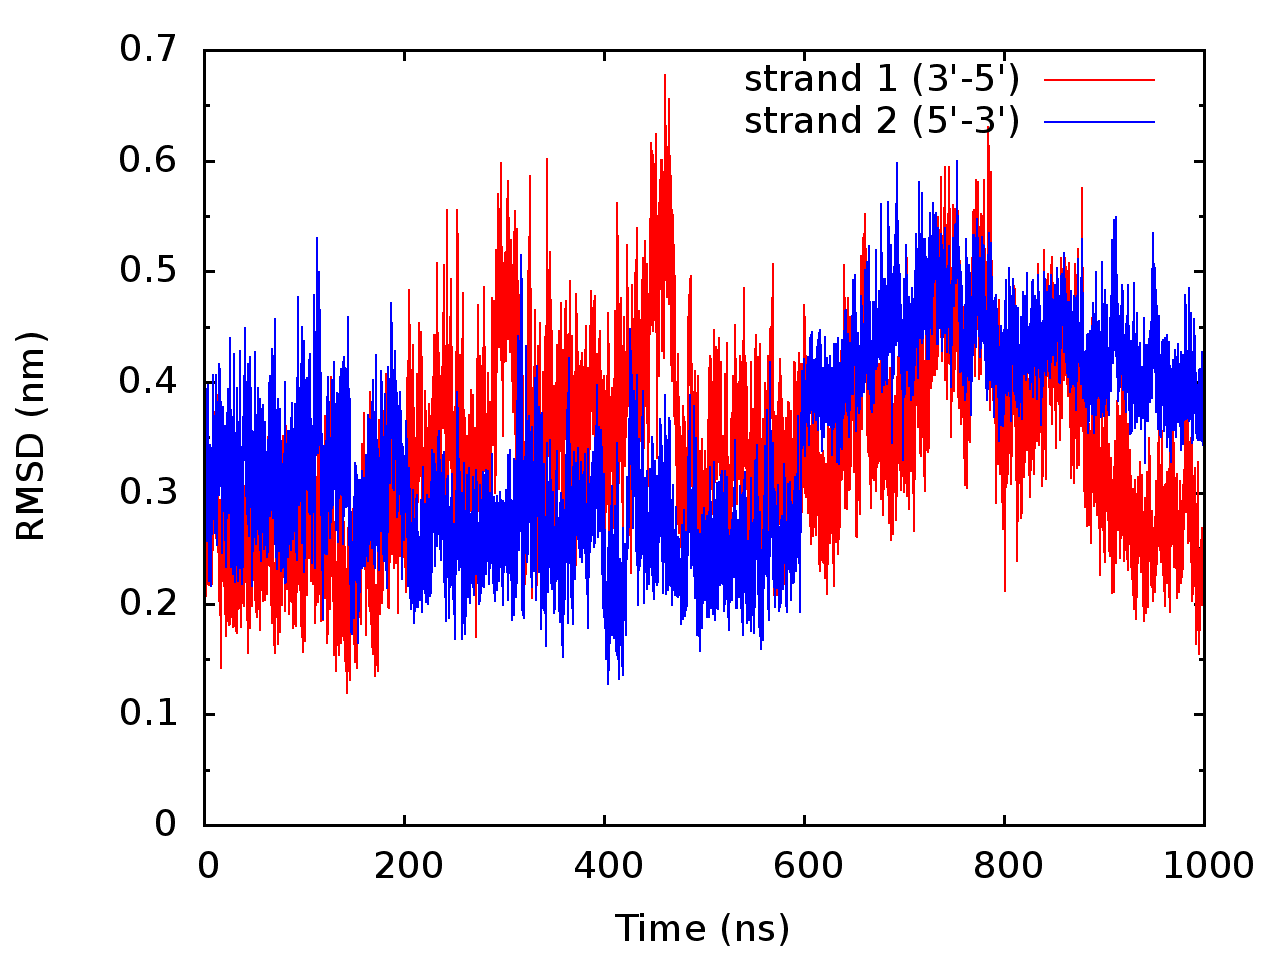
As a standard procedure, the initial analysis of the systems is performed by calculating the root mean square deviation (RMSD) of the proteins from its native crystallized Xray experiment structure. The backbone Cα atoms are used for the calculation of the RMSD of the proteins. The O4’ atoms (in standard deoxyribose nucleic acid nomenclature) of the sugar group of the backbone of the DNA strand are used to calculate the RMSD of nucleic acids. The results are plotted in Fig. 2.
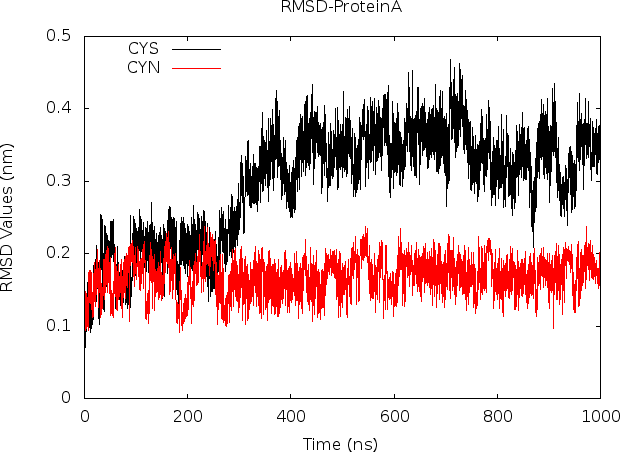
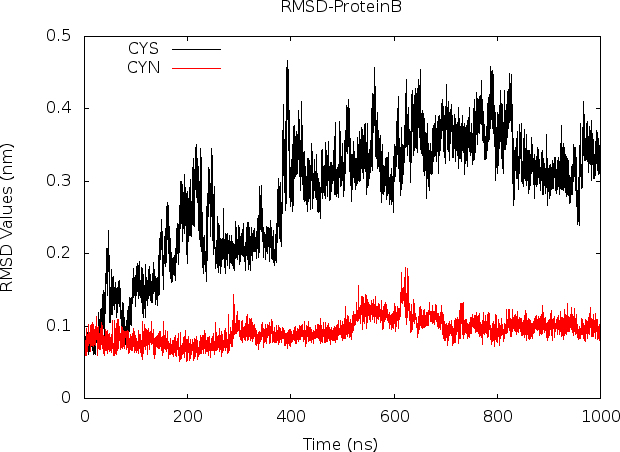
The deprotonated CYN state (red line) clearly shows higher stability with only 2Å deviation from the native structure for protomer A and 1Å deviation for protomer B. The deviations for the same protein chains in the CYS system (black line) have a much higher value of up to 4Å. The CYN complex is stable throughout the simulation run (with protomer B being more stable than protomer A), whereas the RMSD values for the CYS system reach their plateaus only after about 500 ns for both protein chains. We will see later that this is related to the reorganization of the secondary structures, the changes in the unstable binding pose of the CYS proteins to the DNA, and the zinc ions move to different locations with lower electrostatic energy. As a result of this RMSD analysis, only configurations from 500 ns onward are processed in all later statistical analysis of the reference structures of the CYS system. It should be stressed that, from the point of view of computer simulation, such plateauing behavior means that new equilibrium has been established. Of course, one cannot conclude for certain that this change is irreversible with only 1000ns of simulated time. However, considering that Zn2+ is a high valence ion with strong electrostatics interactions, we believe that this change in the CYS system is irreversible and not transient, at least for the locations of the zinc ions.
The RMSD deviation for the DNA molecule is plotted in Fig. 2 for the CYN system and in Fig. 2 for the CYS system. Unlike the deviation of protein structures, the RMSD plotted for DNA strands are similar in both systems. Although for CYS system, deviation as large as 7Å are observed, and seemed to coincide with a large deviation in protomer B as it also deviates strongly at around 400ns. DNA RMSD in both systems show a plateau after 400ns, and settle at a saturated value of 4Å deviation as the DNA molecule equilibrates its binding pose to the protein chains. This value is the same for both complimentary strands of the DNA, thereby suggesting that the two strands always remain in a double helix state and move together. This stresses the structural stability of the DNA double helices, unaffected by the change in protein configuration.
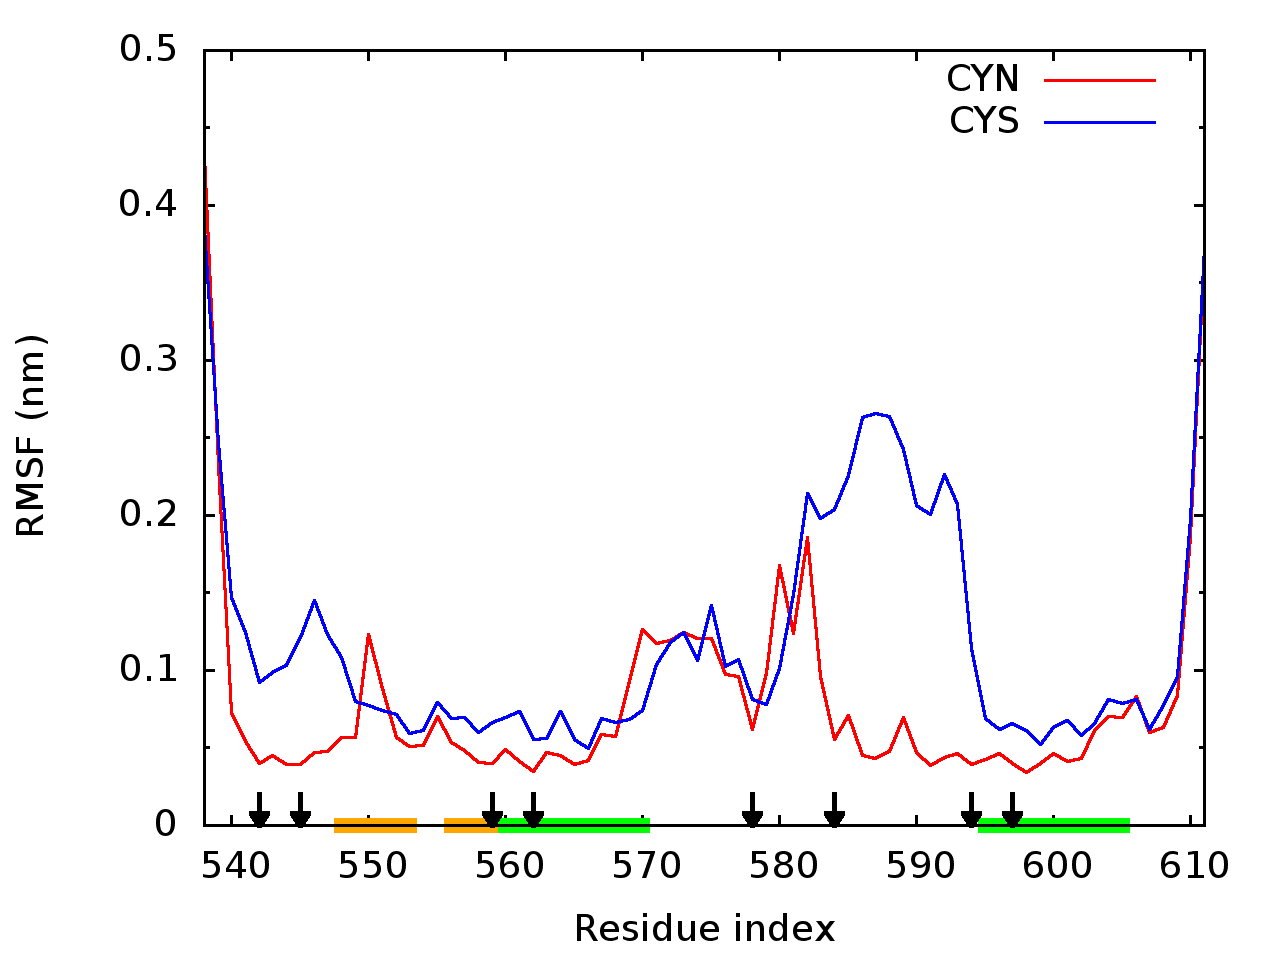
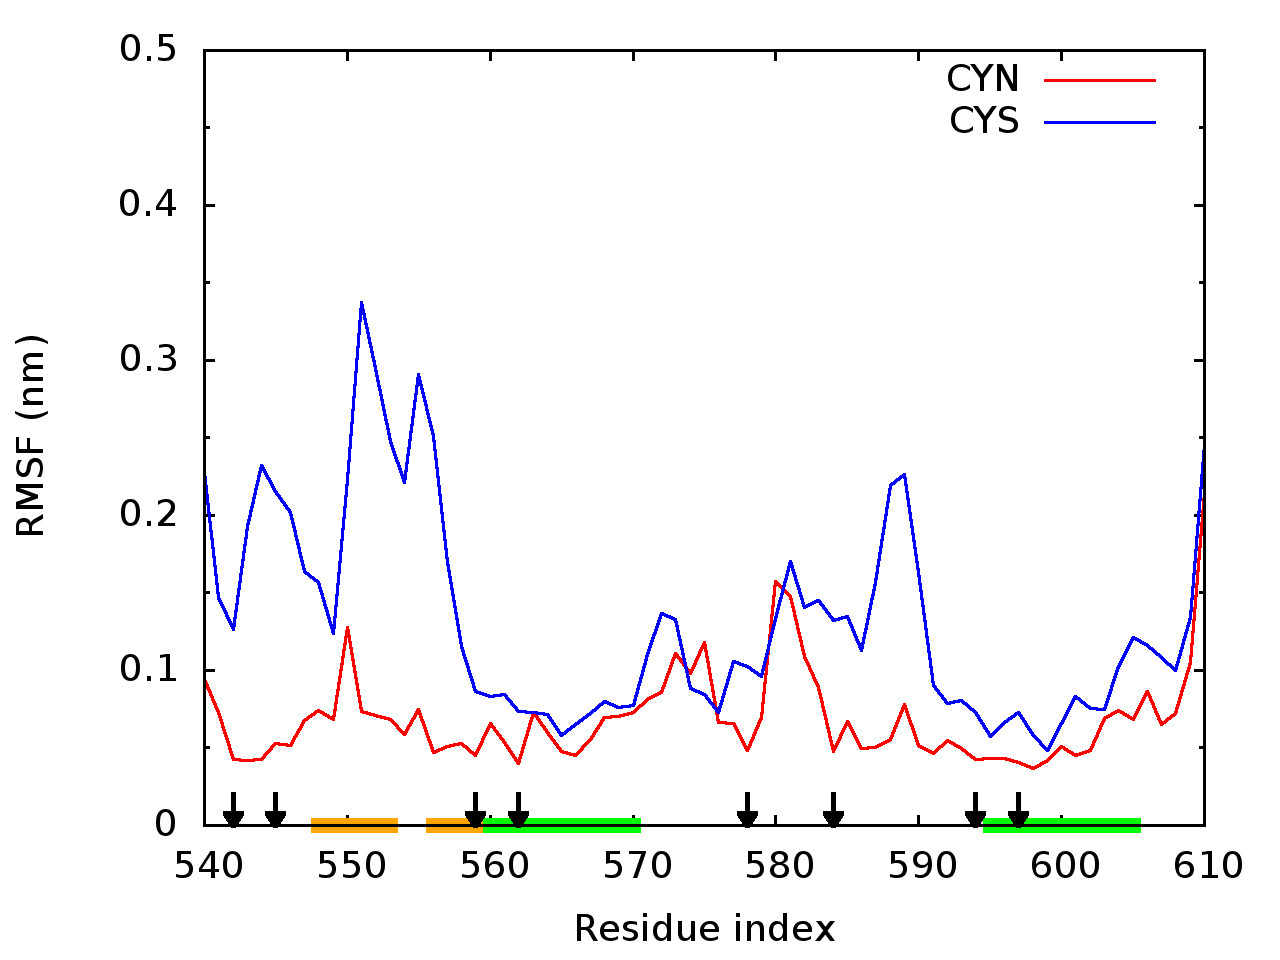
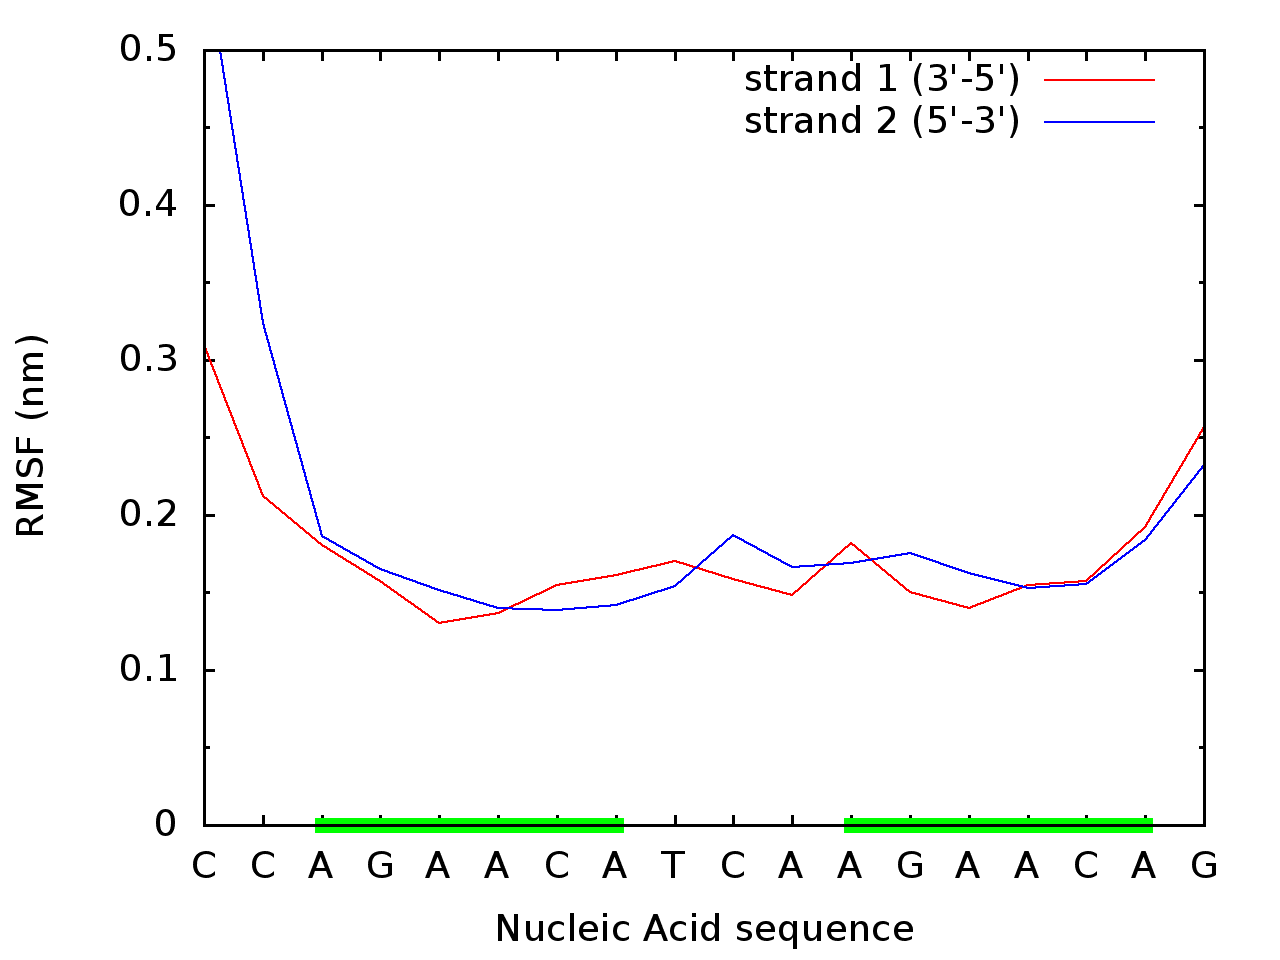
Next, we calculate the time-averaged RMSF of the atoms of the protomers and DNA backbone residues. RMSF is directly related to how the deprotonated state of ZnCys4 complex can affect the structural rigidity of the molecules. Once again, only atomic fluctuations of the Cα atoms of the protein and of the O4’ atoms of the DNA are considered, because these backbone atoms are representative of the overall structure of the molecules more than the side chain atoms. The results of the atomic fluctuations for the CYN and CYS systems are shown in Fig. 3. Figs. 3 and 3 show that the average fluctuation values of the C backbone atom of each amino acid residue are almost always smaller for the CYN systems (around 0.5 Å) compared with the CYS system (1 Å to 3 Å). This is especially true for most of the four cysteine residues that make up the second zinc-finger of protomer A and the first zinc-finger of protomer B. As we will see later, this difference in fluctuation is due to the zinc ions of these zinc-fingers being pulled into the aqueous solution in the CYS system in its new equilibrium. This confirms that deprotonated, negatively charged cysteine residues stabilize the zinc-finger structure even in the presence of negatively charged DNA molecule.
Another observation is the large fluctuations of the zincfinger that binds to the major groove of the DNA in protomer B (from residue GLU548 to residue ALA570). As we will see later, this zinc finger structure is disrupted strongly by the protonation state of the cysteines. The region that binds both the protein chains to the DNA are very stable in CYN system with a fluctuation of only 0.5 Å. This again confirms that deprotonated cysteines stabilize both the zinc finger structures, and the DNA-binding pose of zinc-fingers, even if both DNA and zinc-fingers are negatively charged in the CYN system. The RMSF value of 0.5Å is remarkably lower than the typical 5Å RMSF value for regular folded protein in solution. This means that DNA binding stabilizes the protein structure of these zinc fingers.
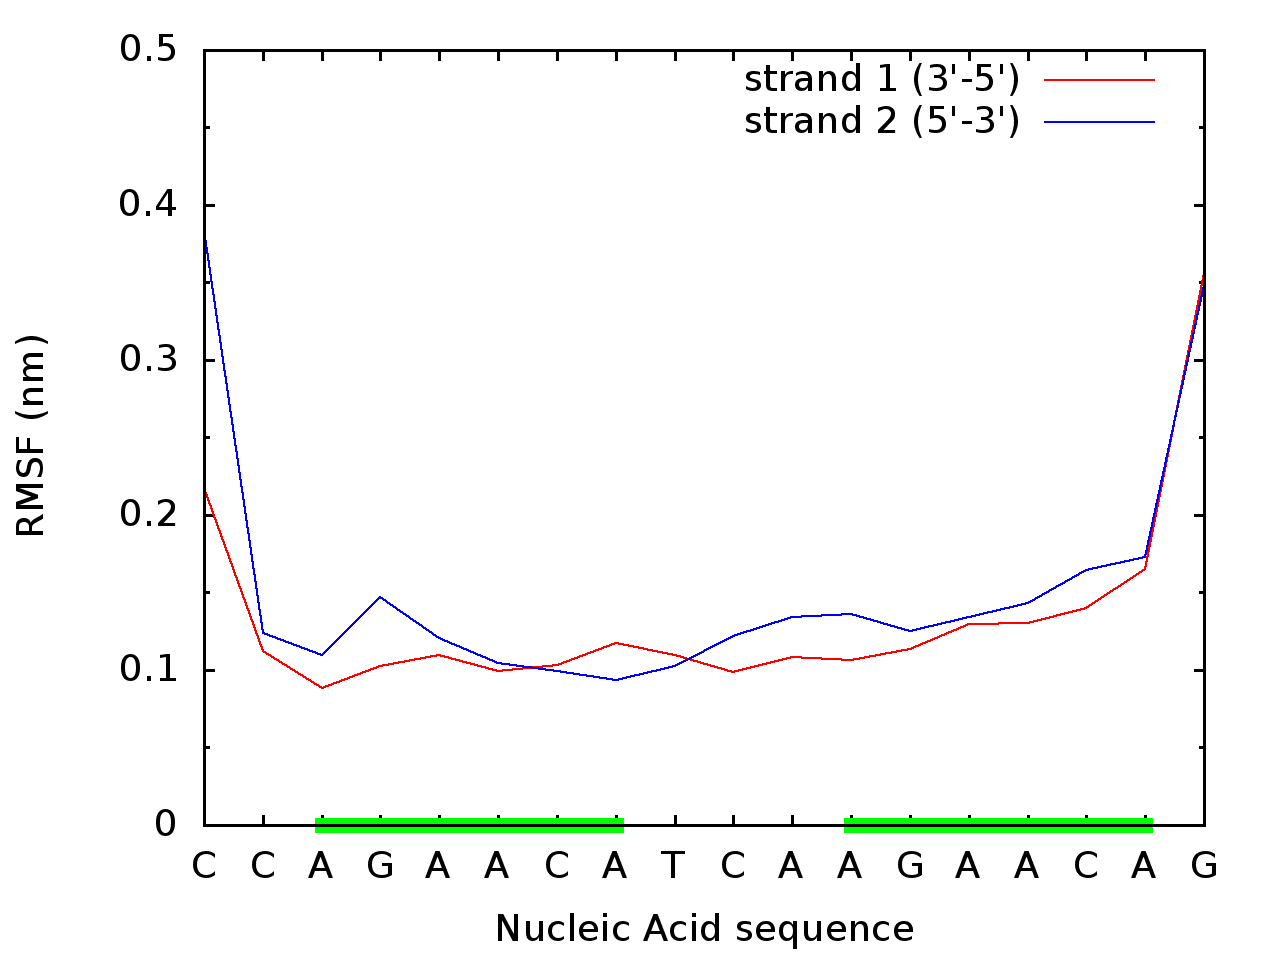
Figs. 3 and 3) show the atomic fluctuation along the backbone of the nucleic acid segment. Both strands show very similar values, dominantly in the range of 1 Å to 2 Å (excluding the free moving end of each strand) and only very minor difference between CYN and CYS systems. The two upstream and downstream sequence backbones (the green bars in the xaxis) behave similarly and stably for both strands. The results show the same trend as that in the RMSD analysis. The structural rigidity of the DNA double helix is weakly affected by the deprotonated state of the binding proteins.
3.2 Disruption to the secondary structure of the zincfingers
Let us analyze how the secondary structures of the proteins are affected by the protonation state of these zinc finger amino acids. In Fig. 4, the changes in secondary structure during simulation are shown in the top figure for the two protomers of the CYN system, and in the bottom figure the two protomers of the CYS system. The definition of the secondary structure follows the standard DSSP classification system. The major helices involved in the zincfingers are shown in blue. The helix from the residues GLU560 to ALA570 sits at the DNA’s major groove, whereas the other helix from the residues PRO595 to ALA605 aligns along the DNA’s principle axis.
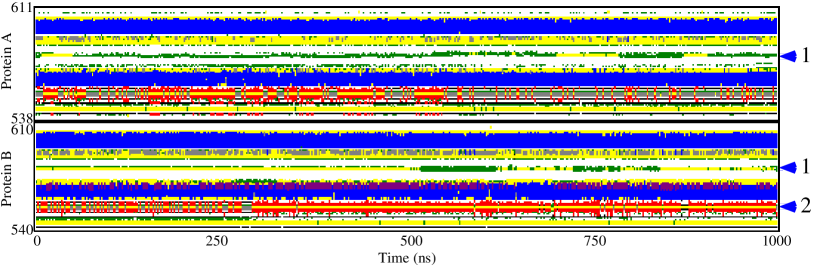
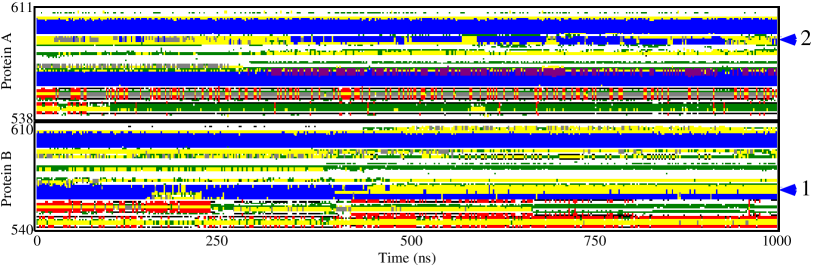
Comparing the change in the secondary structures of the proteins overtime for the CYN and CYS systems immediately reveals a major disruption around 400ns in the CYS system, as already inferred from the RMSD analysis. From these figures, the effect of zinc-binding in CYS neutral state influences the secondary structure of zincfinger protein differently for the upstream versus the downstream binding configurations. For the downstream binding complex (protomer B), the first zinc finger is affected more than the second zinc-finger. Specifically, the helix from residues GLU560-ALA570 melts and shorten by half from 400ns onward (blue arrow ‘1’ in Fig. 4b). In later analysis, we will be able to see that in the CYS system, the Zn2+ ion unbinds from the cysteines and moves to bind with the negatively charged DNA phosphate backbone atoms instead. The shorten helix, however, remains bound with DNA and only disorients inside the major groove, leading to higher fluctuations and deviations.
For the upstream binding complex (protomer A), the second zincfinger associated with the second helix more affected than the first zinc-finger. This helix from residues PRO595 to ALA605 of protomer A in the CYS system shows transient extension to include more residues during the time frame of 400 - 900 ns (blue arrow ‘2’ in Fig. 4b). This transient event is due to this second zinc ions turn away from DNA to face the solvent molecule and detach from the helix. This results in the helix temporarily recruits more amino acids onto itself.
On the contrary, Fig. 4 for the CYN system clearly shows that zinc-ion-overcharged state is important. Both helices of the zincfingers for both upstream and downstream binding complex remains stable during the whole simulation time of 1 microsecond. Only the unstructured loops (blue arrows ‘1’ in Fig. 4a) show large significant changes during simulation, which is natural for such flexible regions. Additionally, the native sheets of the proteins recovers transiently as shown in blue arrow ‘2’ in Fig. 4a). See the CYN configuration discussion near Fig. 7 for more details on this secondary structure.
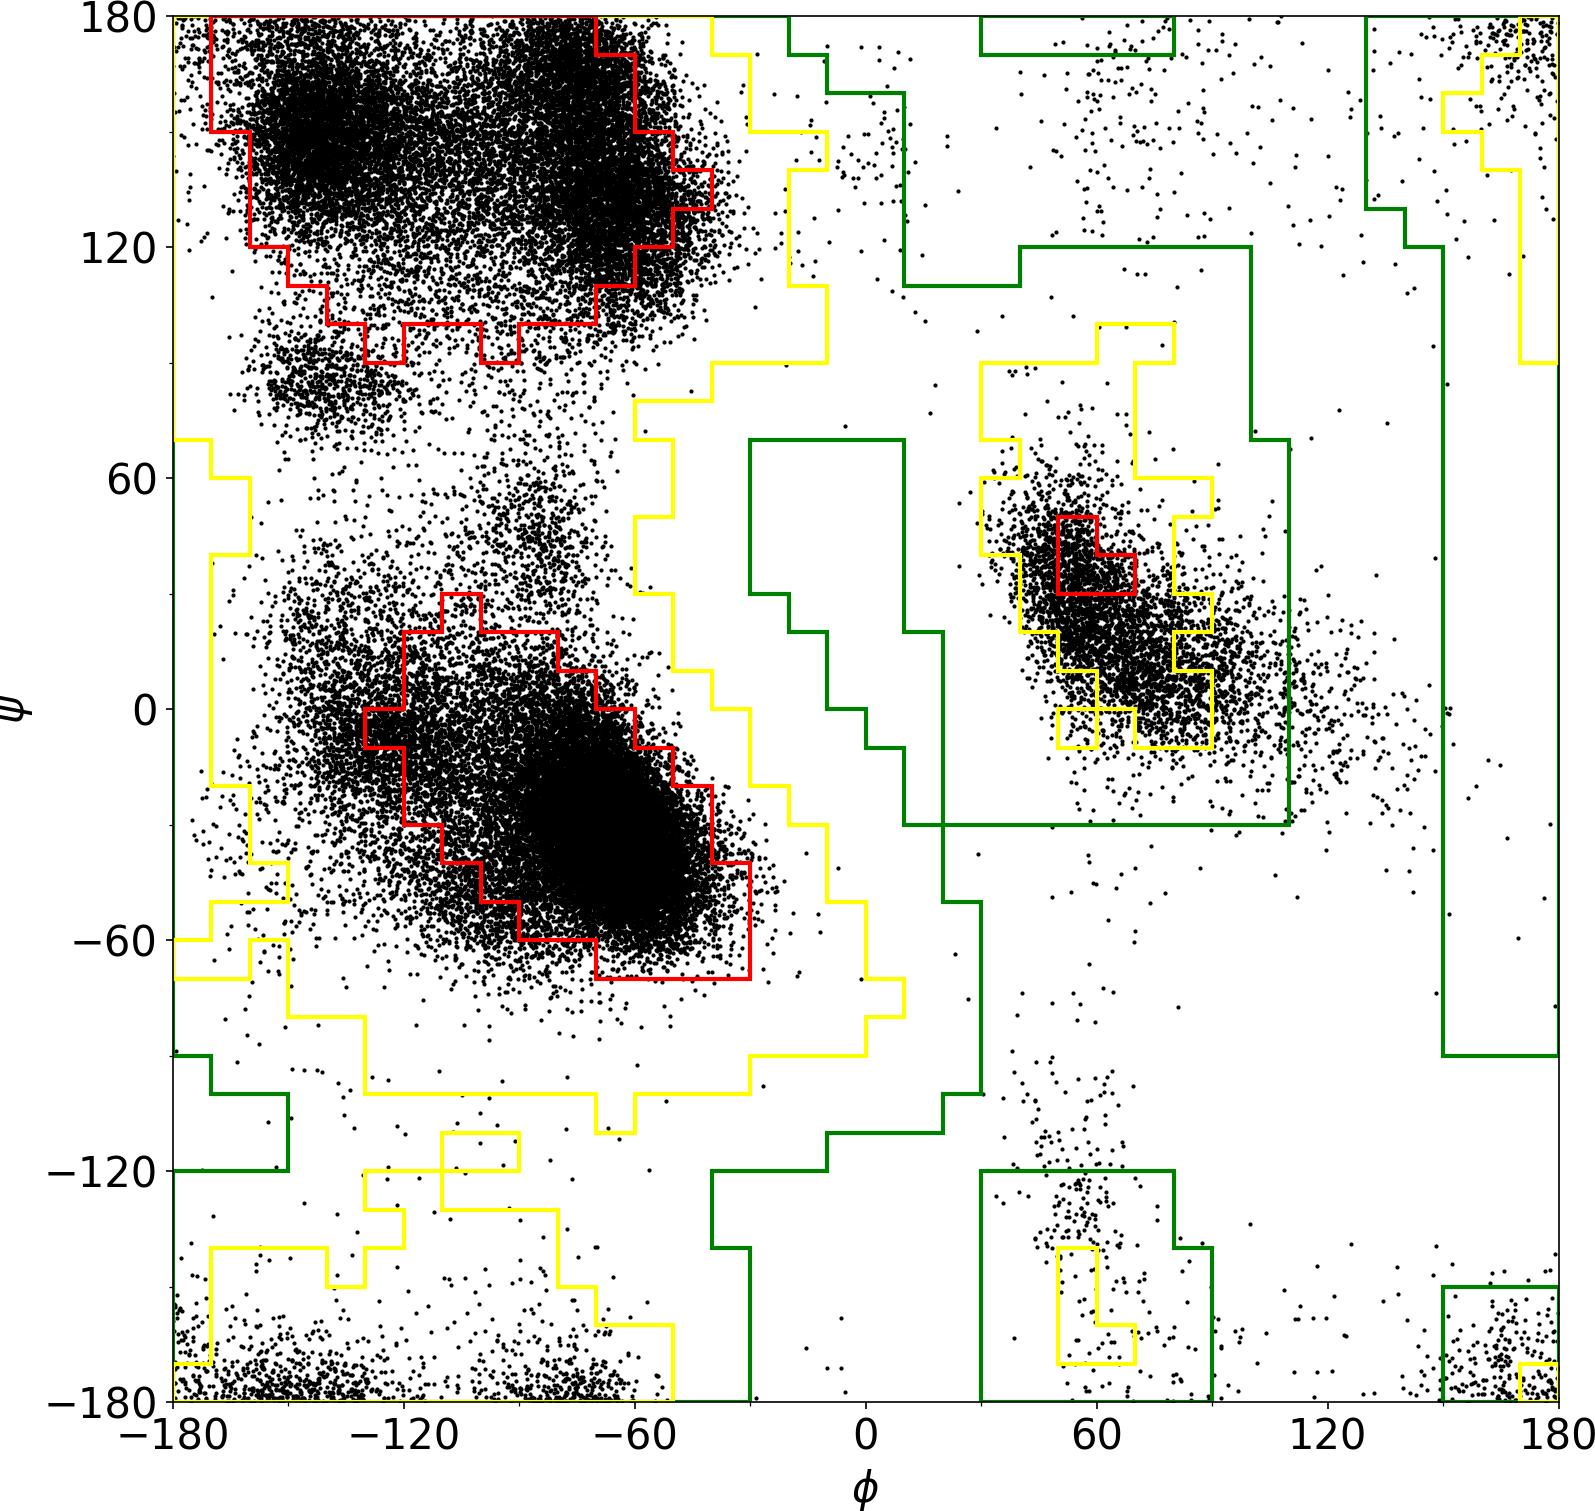
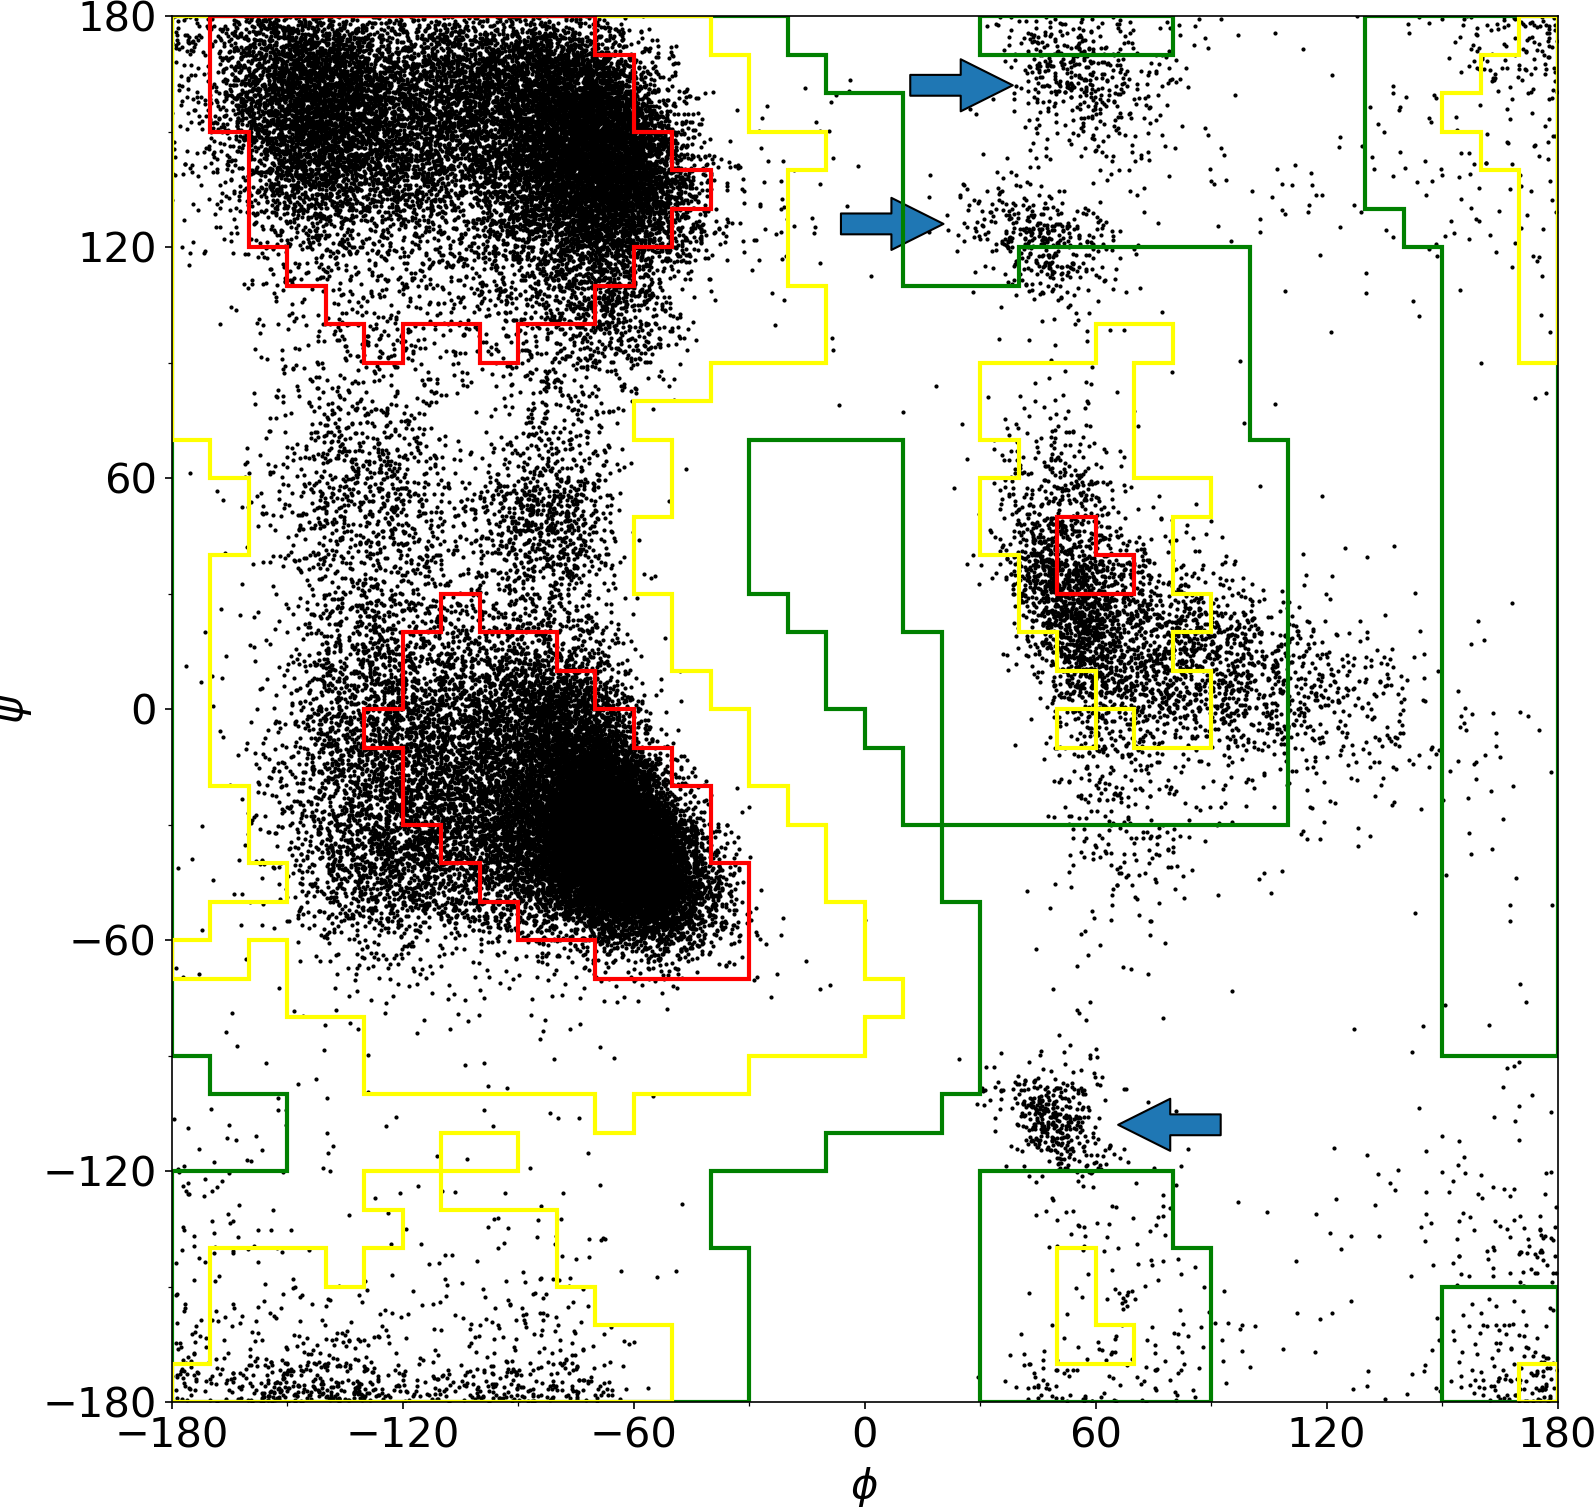
Another measure of the stability of the structure of the proteins in these systems is to calculate the Ramachandran plot for the angles of the Cα backbone atoms of the peptide chains. The results for the two systems are plotted in Fig. 5. The regions of favorable values of the two dihedral angles (, ) of the proteins’ peptide backbone are outlined in red for clarity. Most of the values for the proteins of the two systems indeed expectedly fall inside these red regions. Additionally, the "yellow" and "green" regions are for the "allowed" and "generously allowed" values, respectively. The "unfavorable" region with high energy cost for these values of the angle pairs are outside the green boundary. This plot shows that the neutral CYS system has many high energy angle pairs. Interestingly, pairs accumulate in certain regions in this “unfavorable” zone, as shown by the blue arrows in Fig. 5b.
A calculation of the dihedral pairs for individual residues (not shown) in the CYS system indicates that these accumulation regions is due mostly to the dihedral angles of the three residues, SER580, ASN582 and ASP583. These amino acids are polar or charged residues in the loop between the first and second cysteines, CYS578 and CYS584, of the second zinc-finger of protomer B. Later configuration cluster analysis (Fig. 8c and 8d) shows that the zinc ion of this zinc-finger in the CYS system leaves the Cys4 pocket and moves toward the aqueous solution to lower its electrostatic energy. The electrostatic interaction of the positive +2e zinc ion to the oxygen atoms on these polar and charged amino acids are so strong that the zinc ion pulls (and fixes) the position of these atoms. This pull causes the dihedral angle pairs in these amino acids to fall into the ‘unfavorable’ zone and create the three accumulation regions observed.
Unlike the CYS system, the overcharged deprotonated CYN system avoids these high energy regions and is mostly compact in the allowed regions (Fig. 5a). This result confirms the stability of the overcharged configuration of CYN in the DNAbinding complex.
3.3 Hydrogen bonding stability
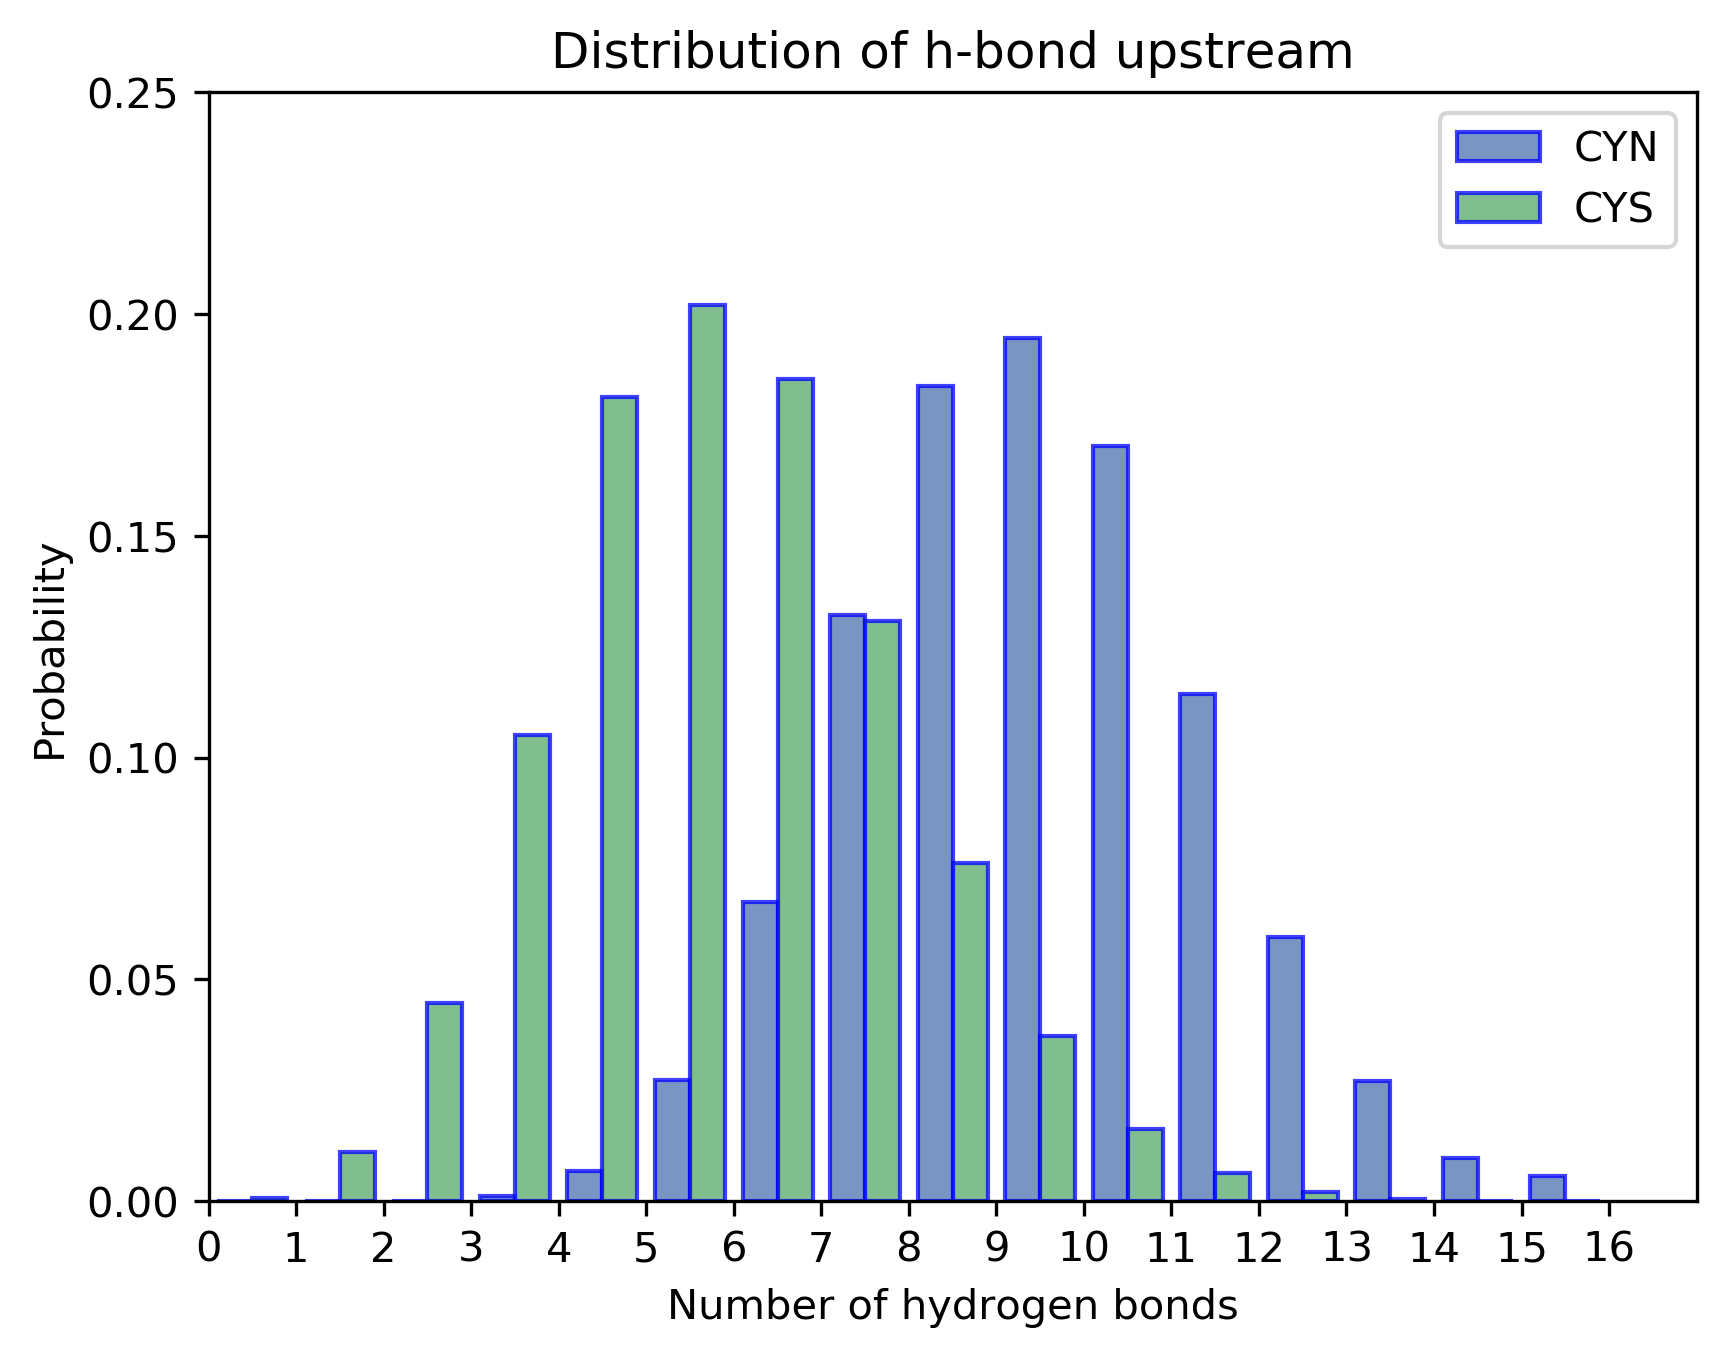
Previous simulation works have shown that hydrogen bonds are unique in the presence of zinc ion binding 17. The structure of the folded protein shows the narrowest distribution of hydrogen bonds in the overcharged state. Therefore, one naturally asked how this state influences hydrogen bonding with the nucleic acids in their complexation with the DNA molecule. The distribution of hydrogen bonds for protomers A and B with the upstream and downstream DNA sequences are plotted in Fig. 6. In each plot, the values for the overcharged CYN system are colored light blue and those for the undercharged CYS system are colored light green.
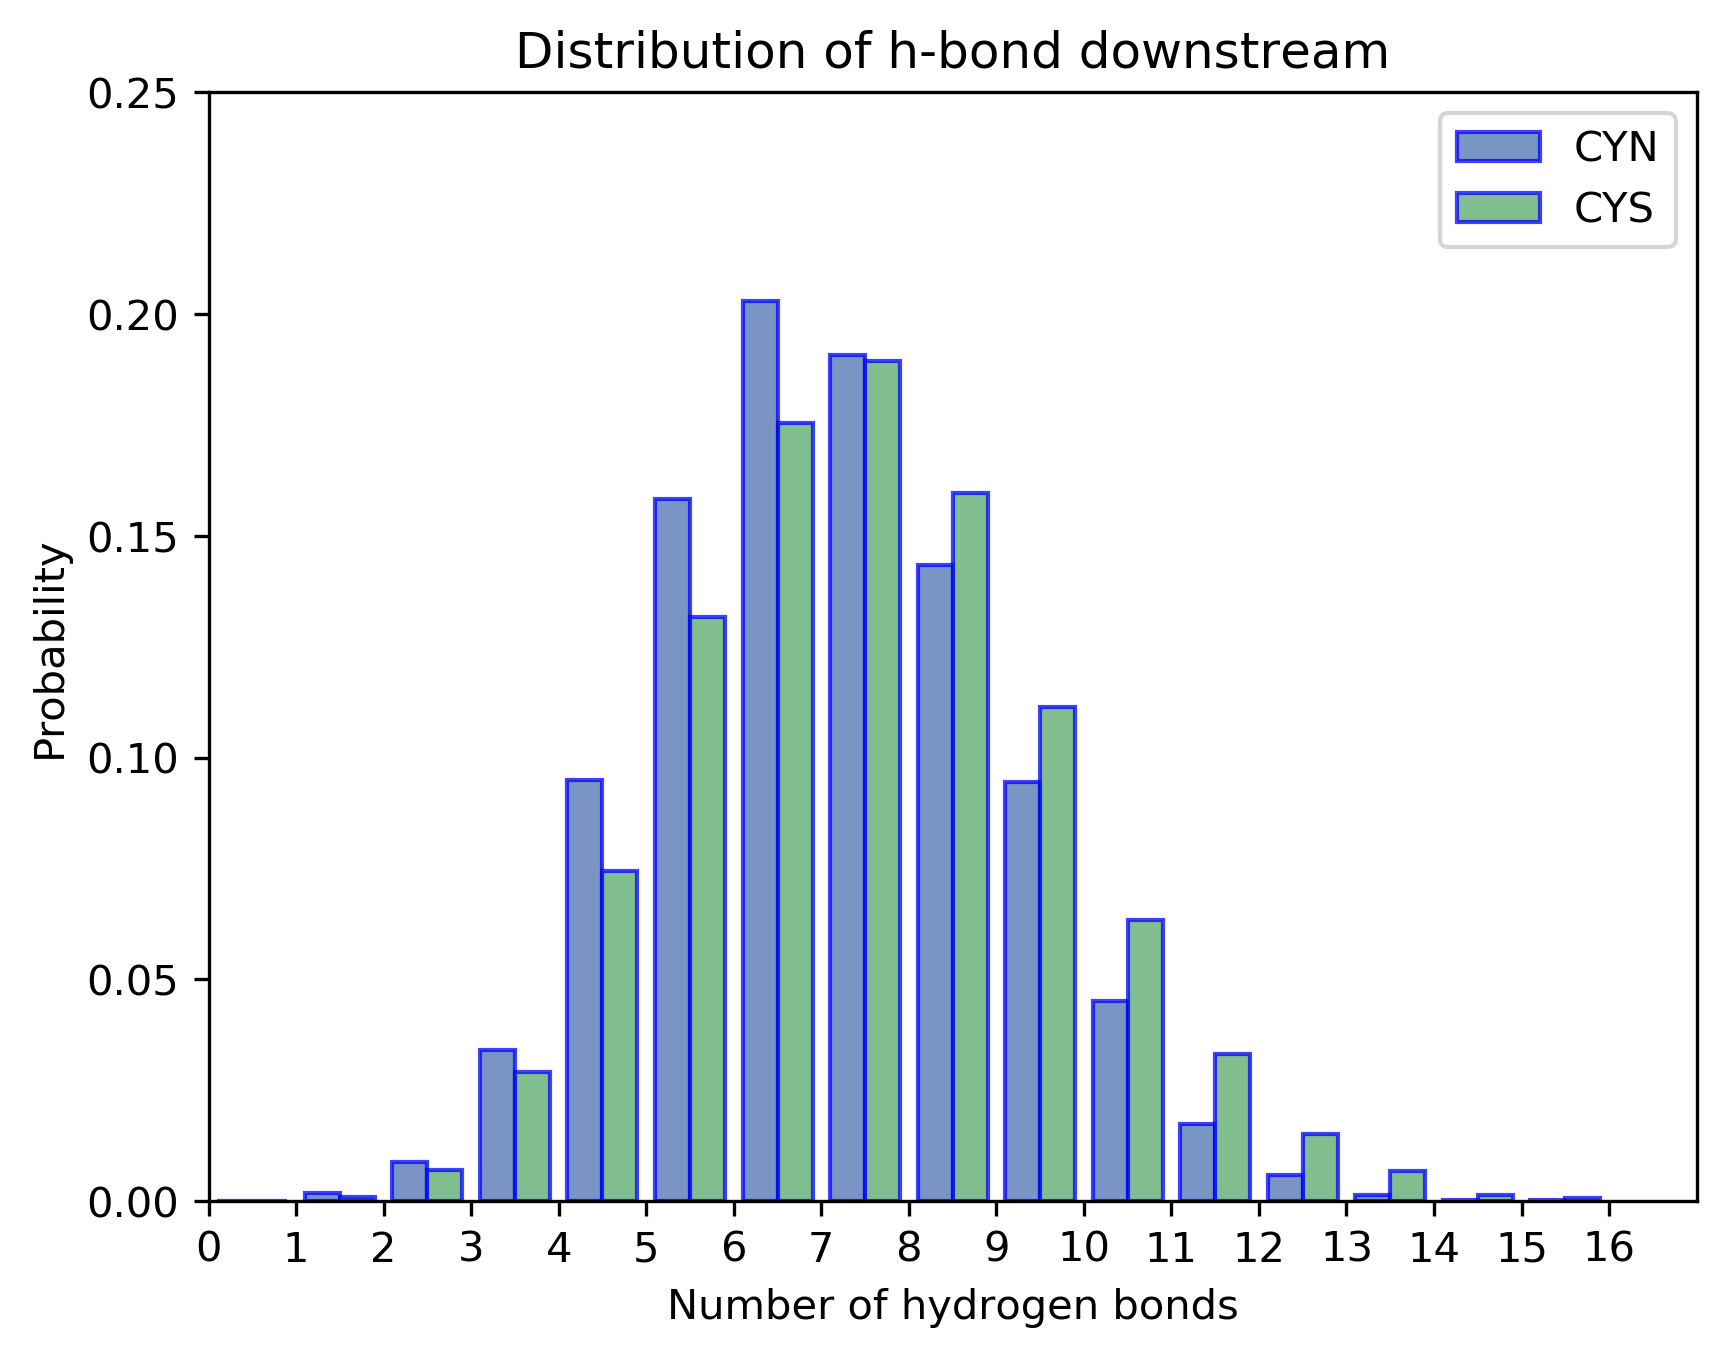
One can see from this figure that the hydrogen bonds of protomer B with the downstream sequence are stable in both systems. A Gaussian fit to these histograms gives a mean value of 6.58 bonds with a standard deviation of 1.94 bonds for the protomer B of CYN system and a mean value of 7.03 bonds with a standard deviation of 2.12 bonds for the protomer B of the CYS system. Thus, the CYN system shows a slightly narrower distribution, indicating more unique bonding.
Protomer A on the other hand shows a loss of several hydrogen bonds in the undercharged CYS state. Gaussian fit to these histograms gives a mean value of 8.97 bonds with a standard deviation of 2.01 bonds for the protomer B of CYN system and a mean value of 5.39 bonds with a standard deviation of 1.95 bonds for the protomer B of the CYS system. The total number of hydrogen bonds lost in the CYS system is about 3.5 bonds, near a third of the total. Later cluster analysis, which is used to investigate the representative structures, reveals that this result is caused by the lifting of the first zinc finger further away from the DNA to push the zinc ion deeper into the aqueous solution. For protomer B, due to its dimeric binding to protomer A, this zinc finger slightly more stable in its binding with DNA. The second zinc finger maintains its hydrogen bonds in the CYS system for both protomers A and B.
It should be noted that these hydrogen bonds are heuristically determined from each configuration based on the geometric criteria that the distance between the donor and acceptor atoms is less than 3.5 Å, and the angle of the three atoms making up the hydrogen bond is less than 30∘. A full quantum mechanical calculation is needed to identify actual hydrogen bonds among the protein and the DNA. However, such calculations for such a large system are beyond our computing capability. For the purpose of this work, the classical criteria are enough to show the differences between the CYS and CYN systems.
3.4 RMSD-based clustering and simulated representative structures
Let us now move to investigate important dynamical features of the zincfinger DNA binding complex. As a first step, we use RMSD-based clustering analysis to group configurations of the 1 s trajectories into similar configurations. This procedure, coupled with the principal component analysis later, provides a detailed insight into the various macrostates of the binding complex, its collective motions, and potential kinetic traps.
In all results listed in this work, the RMSD cutoff value of 0.15 nm is used to distinguish neighboring configurations. This value is chosen through trial and error to find the most reasonable number of clusters of configurations. For a large cutoff value, all configurations are neighbors and only one cluster is generated. Vice versa, for small cutoff value, there are too many clusters of configurations generated, which defeat our purpose. In fact, by varying this value and counting the number of clusters of configurations generated, one identifies a cutoff value for which this number show a sharp rise in the number of configurations and a decrease in the probability of the most populous and lowest free energy cluster. Ultimately, the value of 0.15 nm is chosen as the threshold cutoff. The results of distributing all the trajectory configurations into clusters using this RMSD cutoff value is shown in Table 1 for the two simulated systems.
| Protomer A | Protomer B | |||
|---|---|---|---|---|
| CYN | CYS | CYN | CYS | |
| Number of clusters | 8 | 39 | 2 | 32 |
| Probability of 1st cluster | 92.5% | 51.9% | 99.92% | 39.3% |
| Probability of 2nd cluster | 4.5% | 10.4% | 0.08% | 24.5% |
| Probability of 3rd cluster | 1.6% | 8.9% | 0% | 12.1 % |
| Percentage unclustered | 0.1% | 0.2% | 0% | 0.2% |
Table 1 shows how the protomers in the CYS system are much unstable and strongly fluctuating compared with those in the CYN system. For protomer A, the CYN system has only eight distinct clusters, with the lowest energy cluster having almost 93% probability. Configurations of protomer B in the same system could be distributed into only two clusters with the lowest free energy having near 100% probability. These data show that the CYN system is very stable and stays close to the experimental ground state Xray structure. On the other hand, in the CYS system, configurations of protomer A are distributed into 39 clusters, with the three lowest free energy clusters occupying 70% of the total time. In the same system, configurations of protomer B can be distributed into 32 clusters, with the three lowest free energy clusters occupying about 75% of the time. In both cases, the binding of protomer B to DNA is stronger than protomer A, as previously mentioned.
To discern the major similarities and differences among the dominant clusters of the proteins and to show their deviation with respect to the experimental structure, we align and overlap the central configuration (the representative configuration) of these clusters. The results are shown in Figs. 7 and 8.
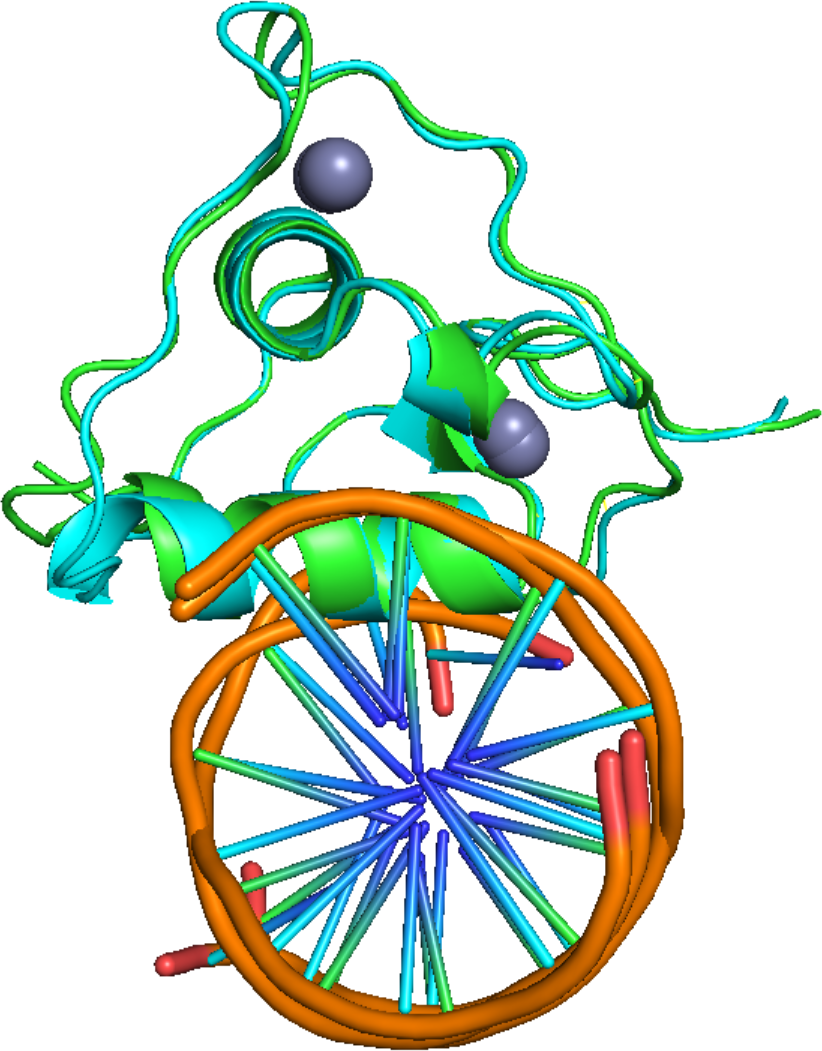
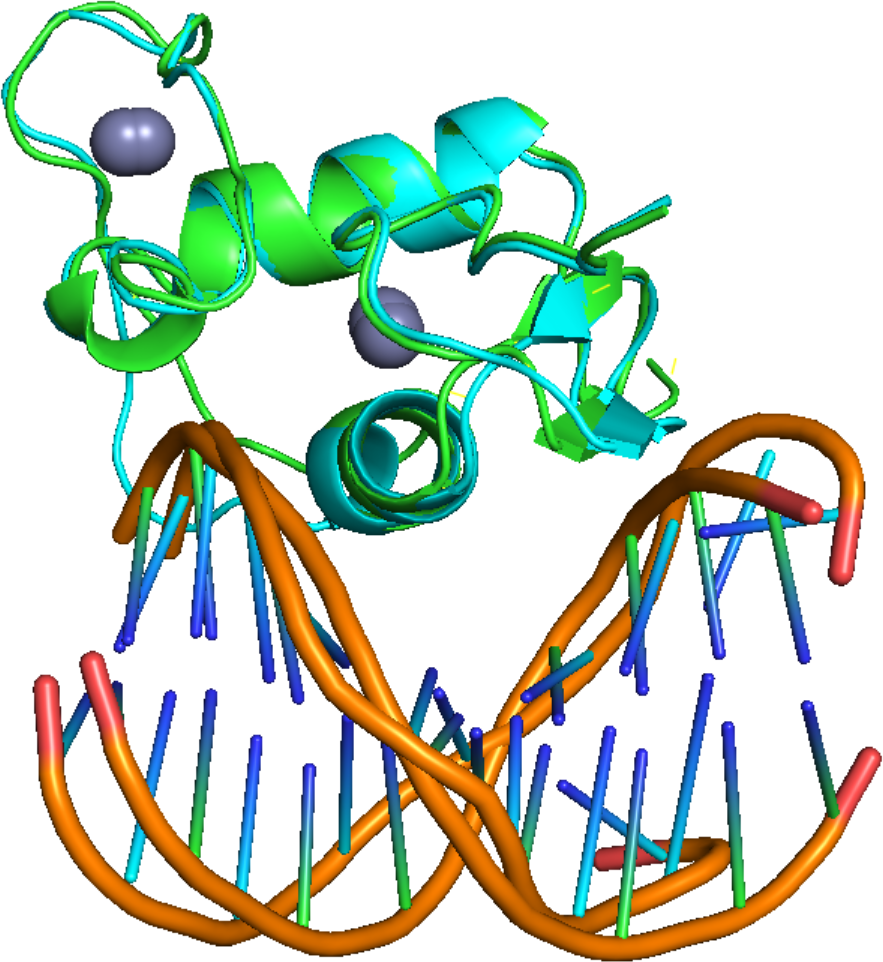
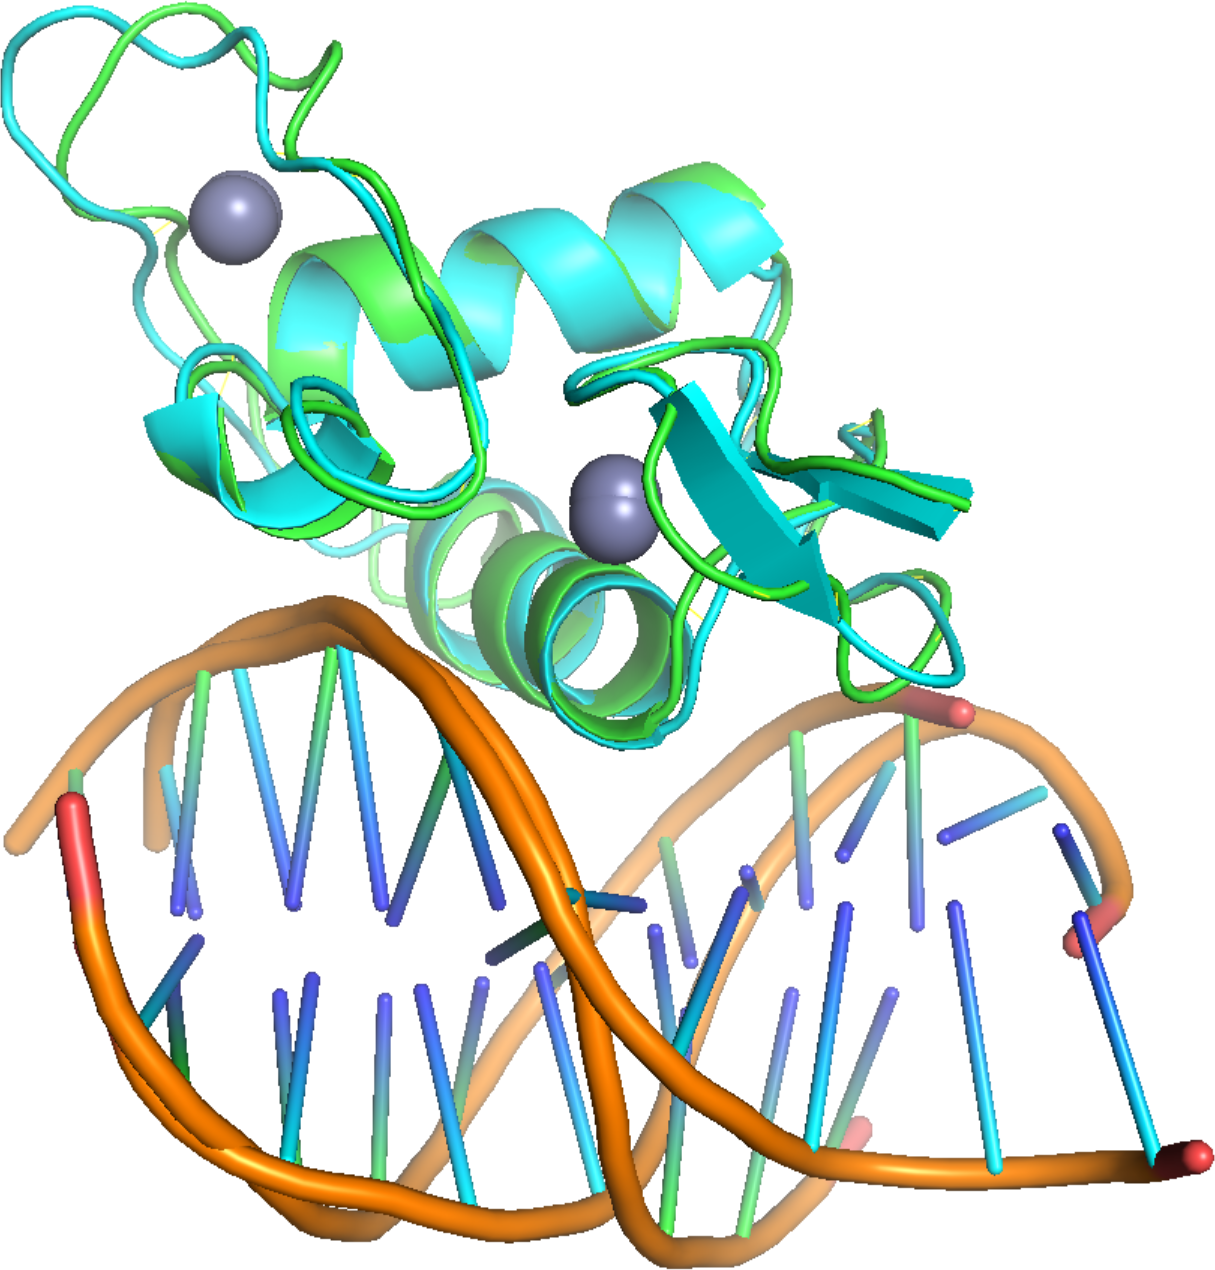
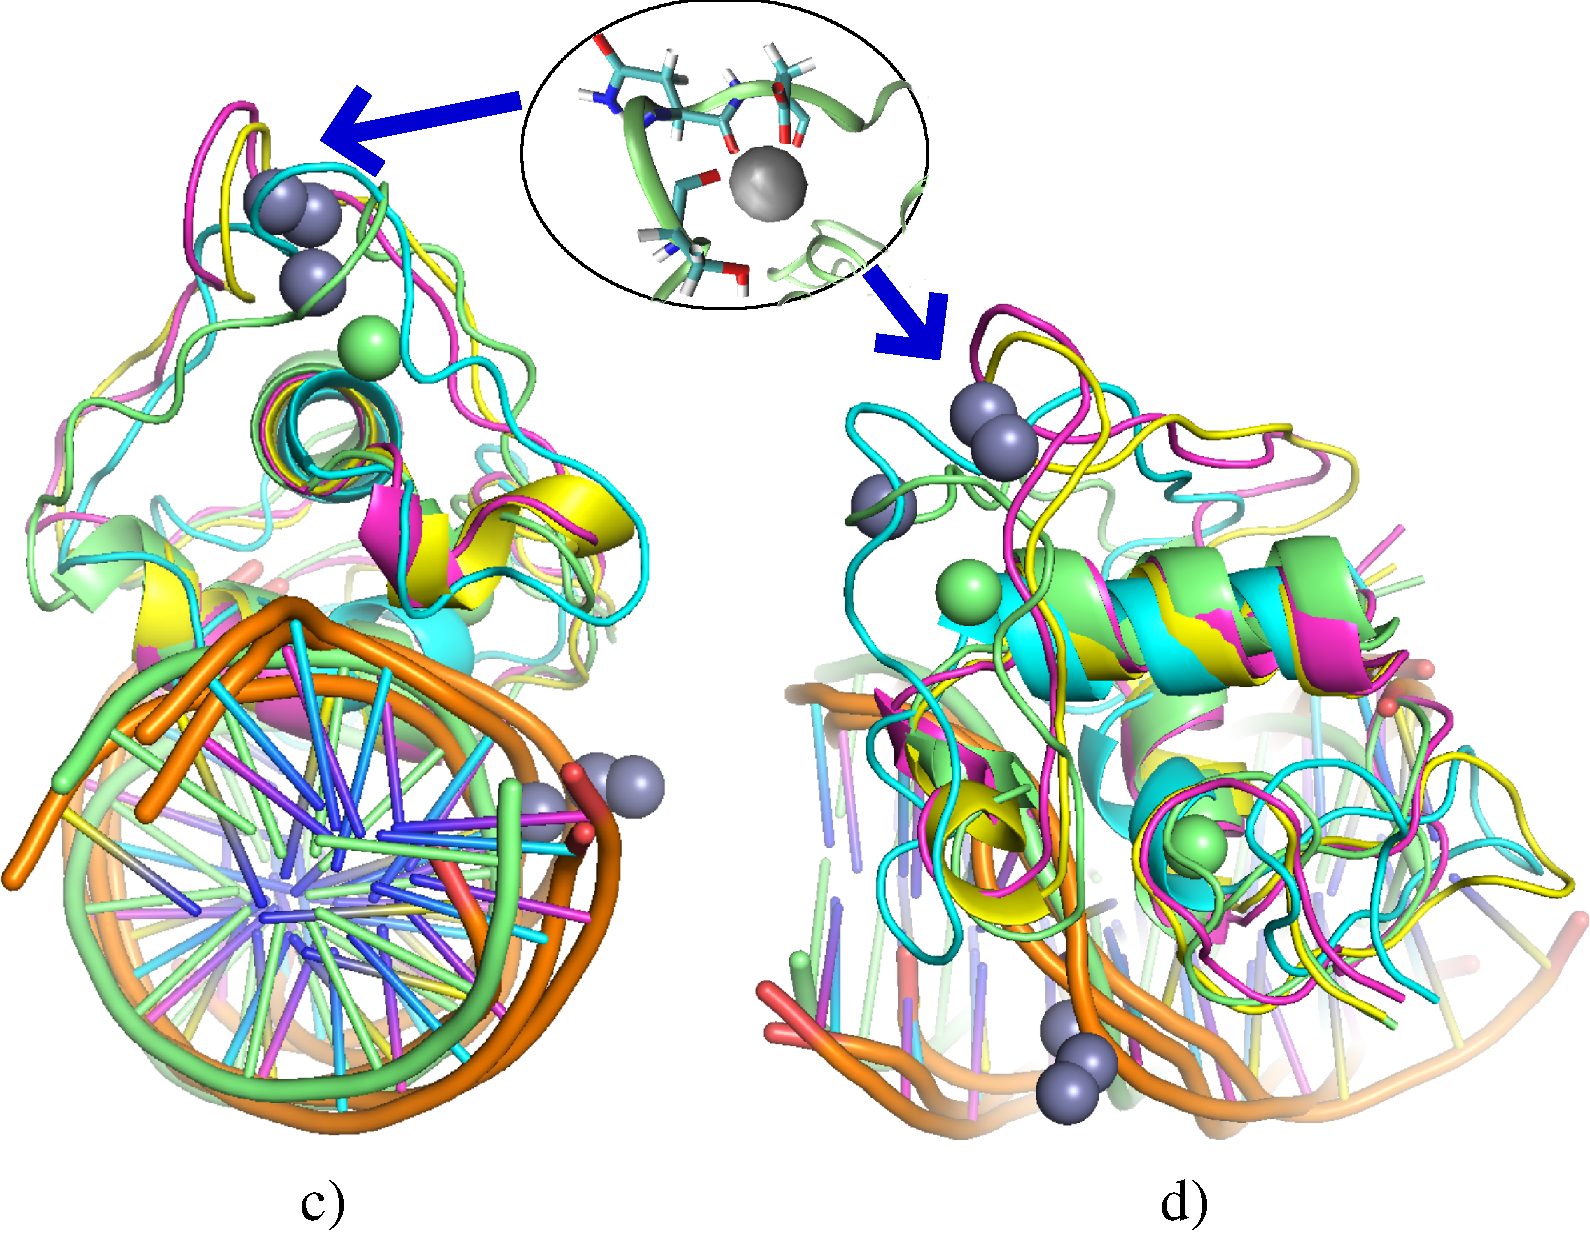
It is clear that the simulated and experimental structures of the overcharged CYN system strongly overlap each other. Nevertheless, one subtle difference is observed. While protomer A of the CYN system keeps its structural components, protomer B of the CYN system shows appearance of additional strands in the location where the experiment structure shows short bridges. Following the time dependent structure information shown in Fig. 4, one learns that these strands are created after 300ns into the simulation. These strands are supposed to be native to these zinc-fingers but upon binding to DNA they are not observed in the experimental crystal structure. Our simulation results show that the strands are still present, albeit transiently (blue arrow ‘2’ in Fig. 4a). This result suggests that the DNA binding of these zinc fingers are so strong that this binding disrupts these strand secondary structures. In experimental structure measurement, the temperature is effectively zero. In molecular dynamics simulation, the temperature is finite. Hence so the strands have finite probability to reappear transiently.
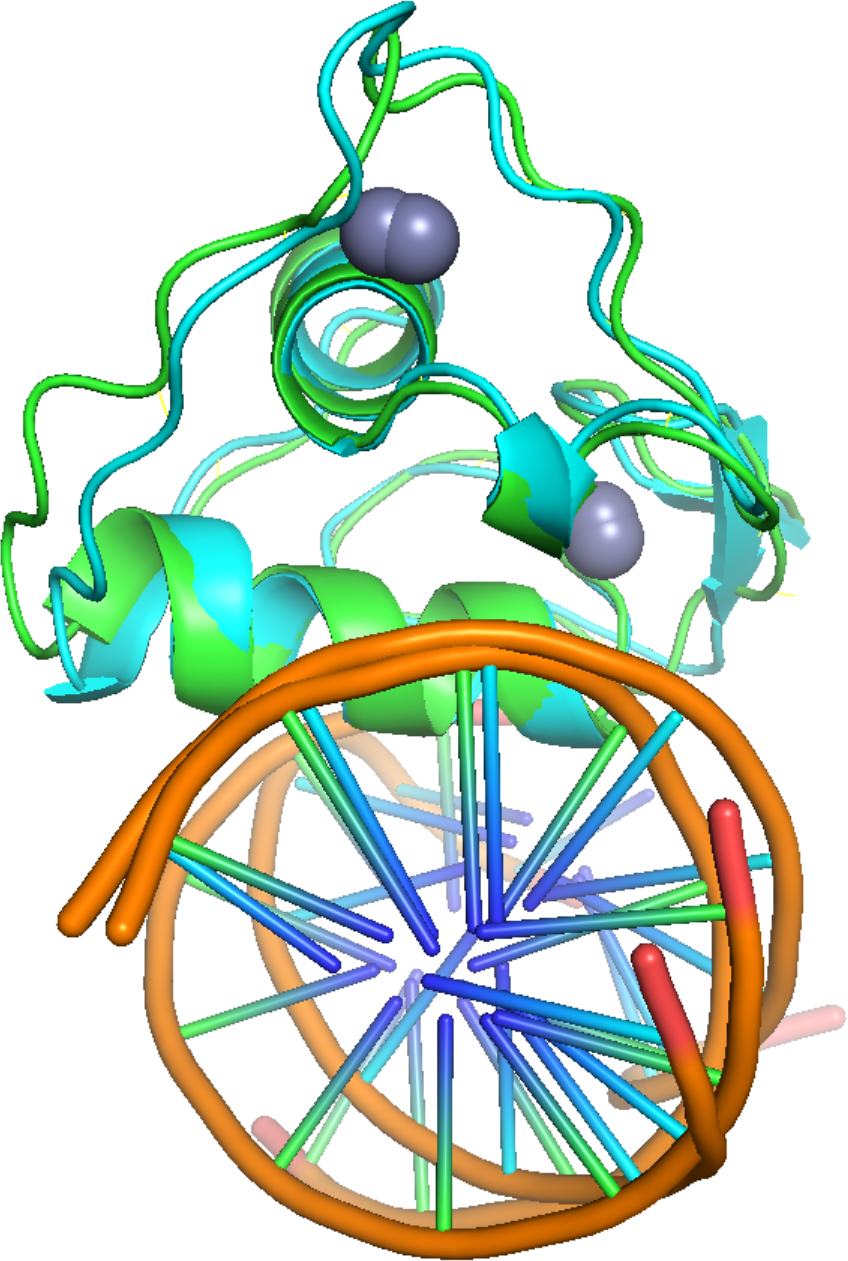
Comparison of the simulated and experimental structures of the zinc-finger in the undercharged CYS system shown in Fig. 8. Substantial reorganizations of the zinc ions are observed. In both protomers, one zinc ion leaves the cysteine binding pocket and moves near the negatively charged DNA’s phosphate backbone. The other zinc ion remains with the cysteine amino acids in the loop segment of the binding pocket, but it pushes this loop further into the water solution, far away from the DNA molecule and leaves the helix segment of the zinc-finger behind. This behavior is totally understandable from the point of view of electrostatic interactions. Since the cysteines are neutral, they only act as polarized side chains. The zinc ion binds weaker to neutral cysteins compared with the CYN system. As a result, the ions have more room to explore other configurations. The zinc ion of the zinc finger near the DNA would move to the negatively charged DNA’s backbone to lower the electrostatic energy. The zinc ions in the zinc finger far away pushes toward to the water solution to enjoy a medium with large dielectric constant and also lower its electrostatic selfenergy. Despite the big movement of the zinc ions, the secondary structures of the protomers remain relatively stable in this new configuration (albeit with larger fluctuations), because these structures are determined mostly by the hydrogen bond interactions among the constituent amino acids. The most notable change is the melting of half of the helix of protomer B in the DNA’s major groove, as shown from Fig. 4. Nevertheless, the helix remains in this groove throughout the simulation. Another notable observation is shown in the inset in Fig. 8c and Fig. 8d. The zinc ion in the CYS system that moved to closer to the aqueous solution also bound to new amino acids. Specifically, the ion bound to the oxygen atoms of SER580, ASN582and ASP583. These are polar and charged amino acids, thus they also favor high dielectric constant medium, just like the zinc ion. The electrostatic interactions between zinc and the amino acids are so strong and bends the dihedral angles of the peptide backbone of these amino acids into “unfavorable” values as mentioned in Fig. 5. For the protomer A, the movement of the second zinc finger toward the solution lifts the nearby loops and helices away from the DNA (more than protomer B). This leads to the reduction in the hydrogen bonds observed earlier.
Overall, protomers in the CYS system settle to a new equilibrium configuration with the zinc ions deviates substantially from their experiment positions. The protomers also show high flexibility meaning weaker DNA binding. Note that the electrostatic interaction of zinc ions to the proteinDNA complex remains much larger than the thermal energy due to the high valence of zinc ion (). Hence, the ions did not go into the solution. They are permanently displaced to the new locations in our simulation.
3.5 Principal component analysis and free energy landscape in collective variables
Principal component analysis (PCA) is a useful method to analyze the dynamical behaviors of proteins. Using PCA, one can screen out fast and high energy modes in the dynamics, leading to a huge reduction in the dimensionality of the system. Just like in the case of RMSD clustering analysis, dynamics of proteins are well described using the first few principal collective motions of the backbone atoms. Through our own inspection, the three most dominant eigenvectors are enough to locate the number of distinct clusters of configurations of the two systems.
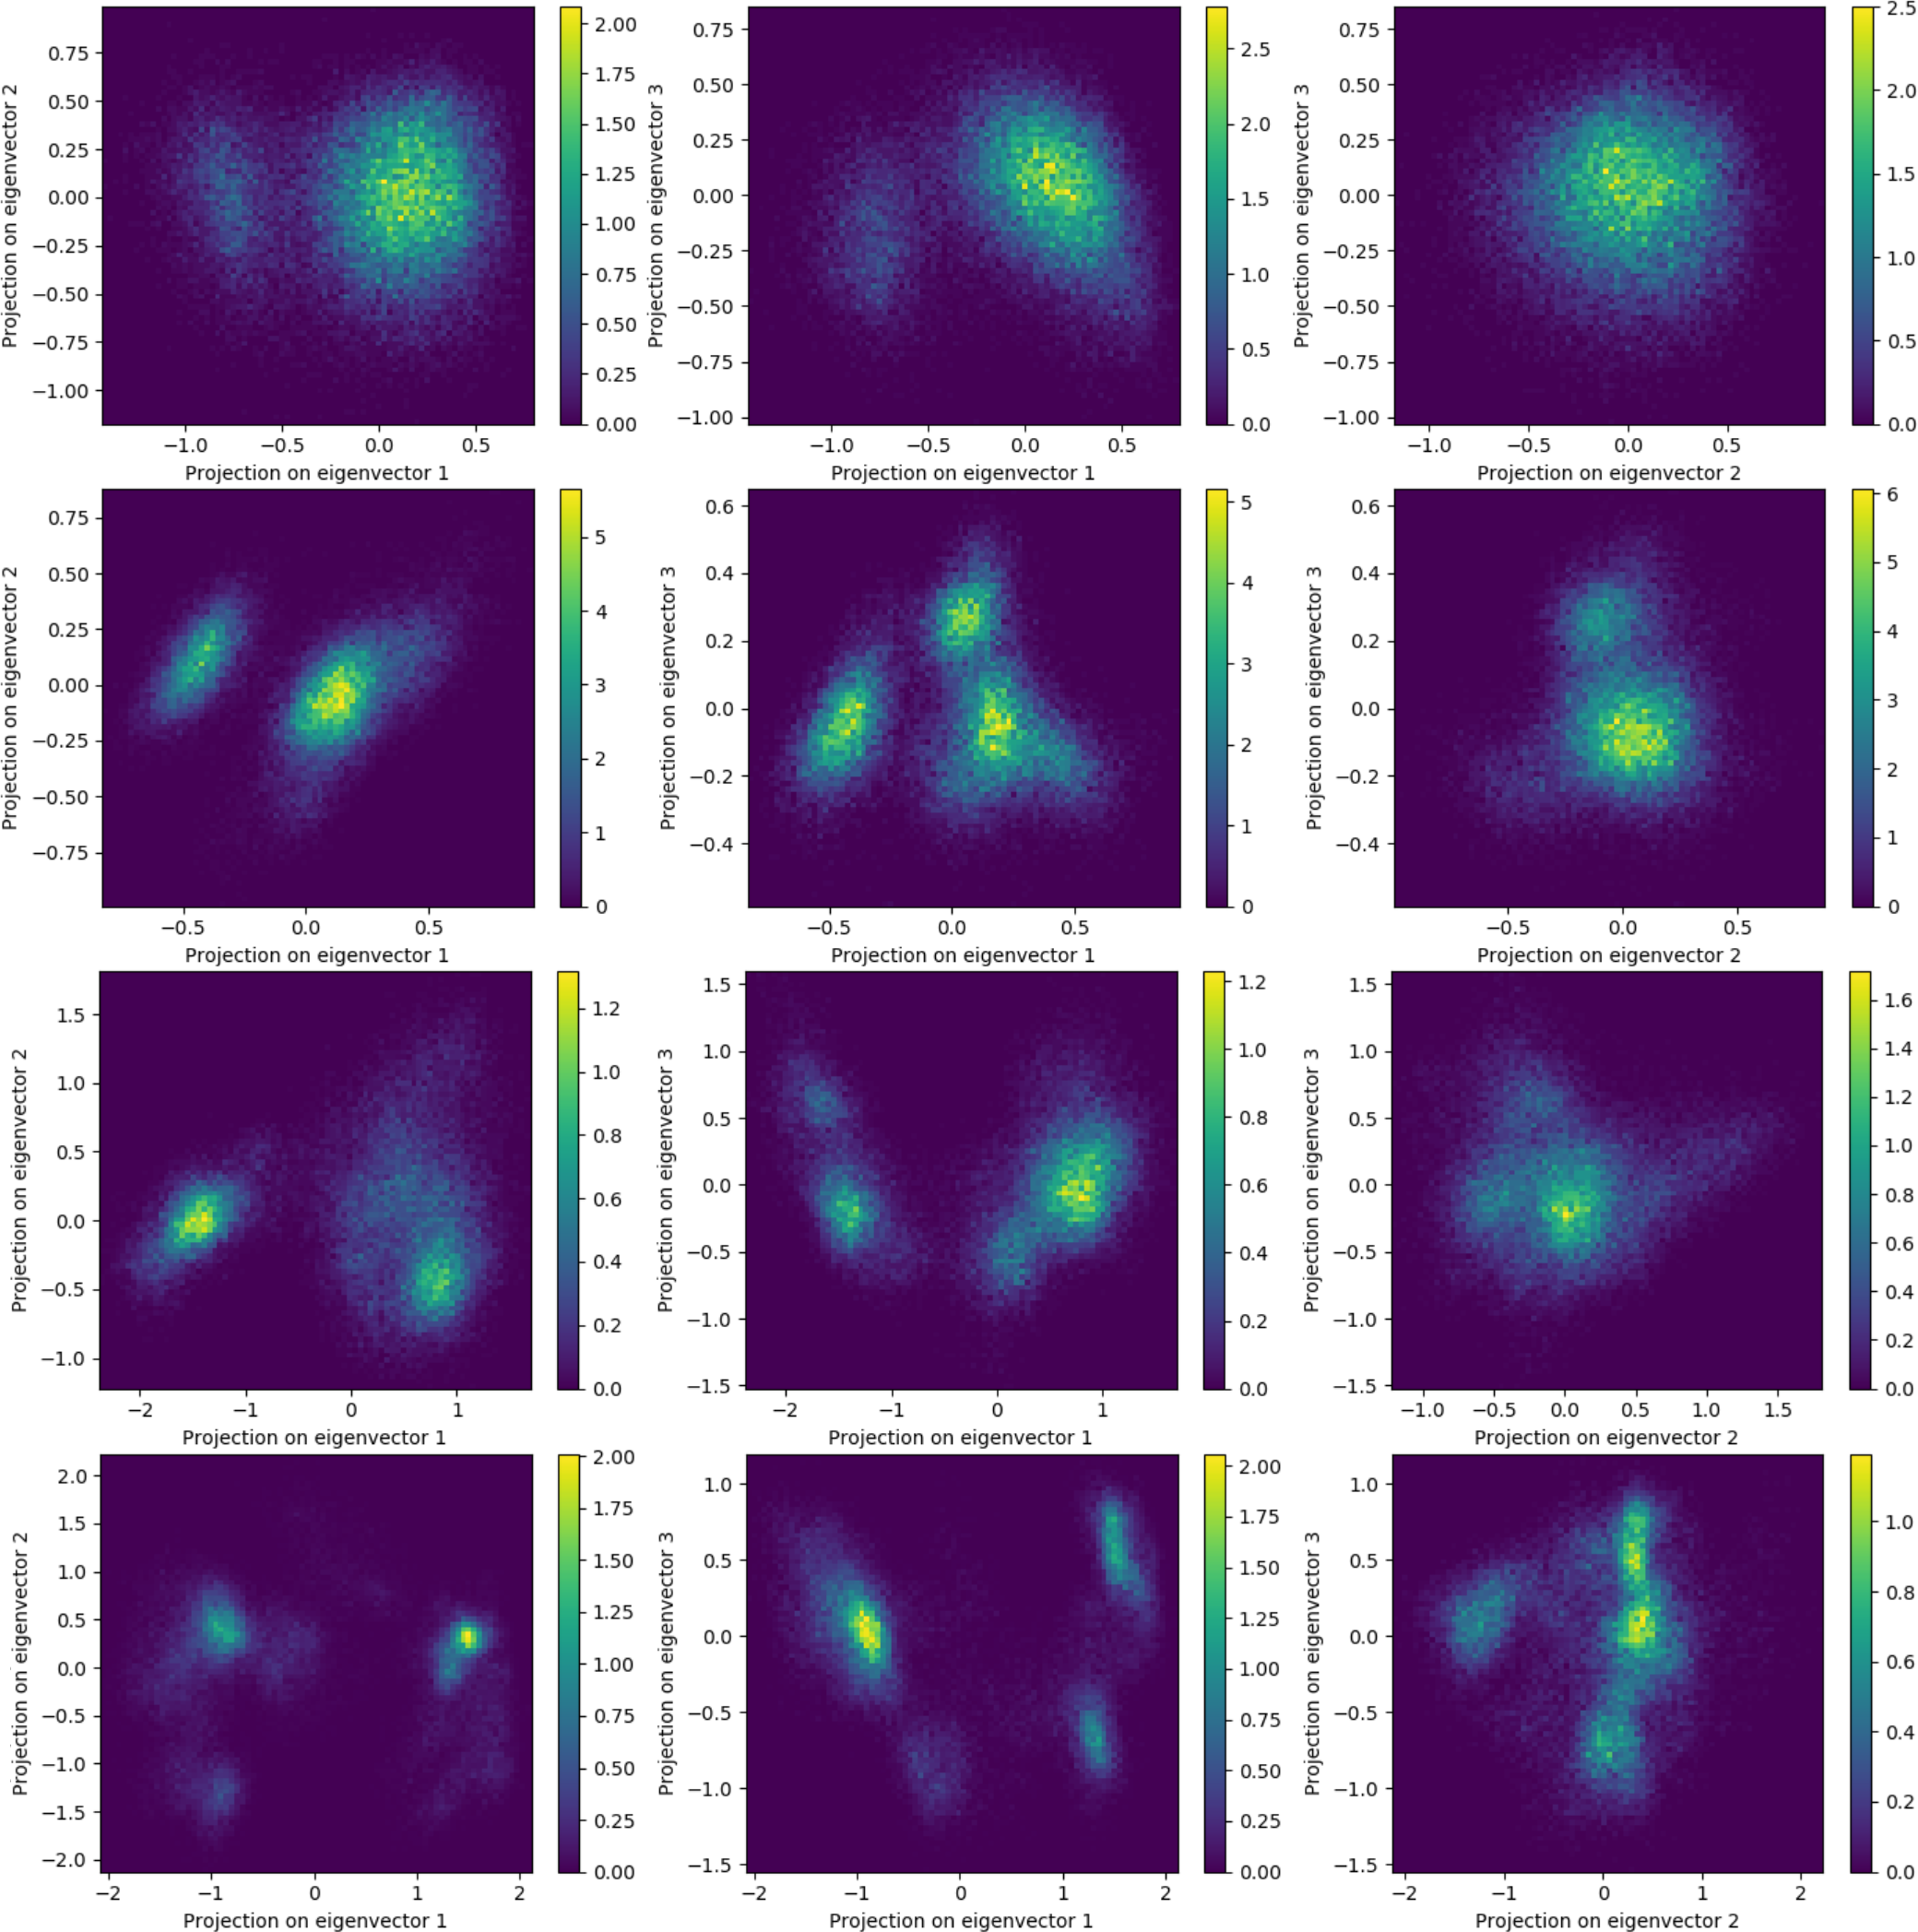
In Fig. 9, the distribution of all simulated configurations projected on the first three eigenvectors are shown. The four rows correspond to the protomer A of the CYN system, protomer B of the CYN system, protomer A of the CYS system, and protomer B of the CYS system. For each row, the left, middle and right are the projections on eigenvectors 1 and 2, 1 and 3, and 2 and 3, respectively. As shown on these figures, protomer A has two distinct peaks of high probabilities, whereas protomer B shows three peaks, once again signifying the difference between he identical protomers upon DNAbinding. The influence of the charging states of the cysteine amino acids is obvious. The peaks for the overcharged CYN system are much sharper and Gaussian-like, indicating structural stability, whereas the CYS system has peaks that are broader and have irregular shapes. For CYS system, several extra small peaks appear indicating structural flexibility and intermediate states.
The trace of the covariance matrix of the four corresponding complexes are 0.798, 0.403, 1.467, and 1.54638 nm2. The higher the value, the more structurally flexible the system is. Therefore, one sees that protomers A and B in the CYN system are more stable than the protomers in the CYS system, and protomer B has stronger DNA binding. In the CYS system, their trace values show the same flexibility indicating that weaker DNA binding leads to less difference between protomers A and B. This behavior is expected because the two protomers are identical in sequence, and any difference between them is due to DNA binding. Thus, weaker DNA binding means less difference.
Lastly, in the coordinates of these collective variables, the free energy can be easily obtained from the probability density distribution function, , where are projections on eigenvector th. As the color-coded values of this Fig. 9 shows, the CYS system has a much wider range of these projection values leading to lower probability density distribution than the CYN system. Between the protomers A and B in the same system, protomer B shows sharper peaks and smaller range of . Specifically, the difference in the free energy of protomer A and B is kJ/mol in the CYN system, whereas in the CYS system, the difference in the free energy between protomers A and B is less at kJ/mol. Between CYN and CYS systems, the free energy of protomer A in the CYN system is lower by 0.87 kJ/mol than that of protomer A in the CYS system. Protomer B in the CYN system is lower by 1.7 kJ/mol than that in the CYS system. One can see from these analyses that the overcharge state is more stable with protomer B having even lower free energy. In the undercharged state, the structures are more flexible. Thus, DNA binding causes less difference in the free energy between protomers A and B.
We can argue from these structural, dynamical and free energy analyses that strong DNA binding is the main reason for the symmetry breaking between protomers A and B. A full understanding of the mechanism of how DNA binding causes the symmetry breaking between the protomers would require much more investigation and analysis by comparing different binding poses. For example, one can compare symmetric versus mirror binding poses of the two protomers to identify important residues and interactions forcing the symmetry breaking. However, the symmetric binding pose requires protein docking procedure. This theoretical approach that can introduce uncertainties into this delicate energy balance. Such studies are beyond the scope of this paper, and will be addressed in a future work.
4 Conclusions
In this paper, we perform a molecular dynamics simulation to investigate a ZnCys4 zinc finger protein dimer in its binding pose with DNA. The monomers of the dimers are identical in sequences and bind to the same nucleic acid sequences. Yet The two monomers have differences in structures and energies with the "downstream" complex showing stronger binding. The overcharged state of the zinc ion is very important for this binding. In this state, all four cysteine amino acids are deprotonated to become negatively charged and thereby overcharging the zinc ion. Previous works showed that this overcharged state is important for stability of the zinc finger. In this work, various analyses shown that this overcharged state is also very important for the proteinDNA binding complex. In the undercharged state, the zinc ions would move to different locations in the complex to lower their electrostatic free energy, leading to an increase in the atomic fluctuations and the dynamics of the complex. Our results provide insights into the DNA binding state of this specific zinc finger of PSA protein and have potential application in designing specialized biosensor for prostate cancer screening.
In a broader picture of the several other zinc finger structures, one can ask if the results of this work could be applied. Here, we have focused on the protonation state of ZnCys4 in its binding with DNA molecules. Other quantum mechanical calculation studies of single ZnCys2His2 or ZnCys3His zinc fingers showed the cysteine amino acids are also deprotonated in binding with zinc ions 23, 24. Calculations of ZnCys2His2 zinc fingers showed that the histidines in these structures have a magnitude of charge transfer to zinc ions comparable with cysteines 45. Less “hacky” classical forcefield sets the histidine amino acid in zinc finger to be in a negatively-charged deprotonated state 46 for this complex to be stable. Our preliminary study of ZnCys3His zinc finger also shows that histidine is negatively charged for the complex to be stable (manuscript in preparation). The DNA binding poses of these zinc fingers are also similar to our system. Therefore, we believe our results can be applied to the elucidation of the molecular mechanism of the DNA binding of these zinc figures. However, beyond standard-fold zinc finger, the binding poses of non-standard fold zinc fingers are different 3, 14. Hence, more investigations are needed for those cases to confirm the importance of the electrostatics of zinc finger in DNA binding.
Finally, the initial experimental crystal structure of our system shows the symmetry breaking of protomer A and B structures in binding with DNA. Our results show that the strong DNA binding in the overcharged state causes a strong difference in the free energy of protomers A and B. In weaker uncharged state, the difference in the free energy of protomers A and B is smaller, and their secondary structures are also more similar. Therefore, we argue that DNA binding is the main cause of this symmetry breaking. However, we only focused on the electrostatics of the DNA binding of zinc finger in this work. In practice, DNA binding properties have many aspects, and much more comprehensive studies of this mechanism are needed. More elaborate simulations of different DNA binding poses will be the subject of future works.
The authors acknowledge the financial support of the Vietnam National University, Hanoi, grant number QG.16.01. The authors acknowledge the financial support of the World Bank and the Ministry of Science and Technology of Vietnam grant number 13/FIRST/1.a/VNU1.
The authors thank Professor Morikawa Yoshitada for many useful discussions and inputs.
References
- Lander et al. 2001 Lander, E. S. et al. (2001) Initial sequencing and analysis of the human genome. Nature 409, 860–921
- Klug 2010 Klug, A. (2010) The Discovery of Zinc Fingers and Their Applications in Gene Regulation and Genome Manipulation. Annual Review of Biochemistry 79, 213–231
- Kluska et al. 2018 Kluska, K., Adamczyk, J., and Krężel, A. (2018) Metal binding properties, stability and reactivity of zinc fingers. Coordination Chemistry Reviews 367, 18–64
- Jen and Wang 2016 Jen, J., and Wang, Y.-C. (2016) Zinc finger proteins in cancer progression. Journal of Biomedical Science 23, 53
- Mitra et al. 2013 Mitra, M., Wang, W., Vo, M.-N., Rouzina, I., Barany, G., and Musier-Forsyth, K. (2013) The N-Terminal Zinc Finger and Flanking Basic Domains Represent the Minimal Region of the Human Immunodeficiency Virus Type-1 Nucleocapsid Protein for Targeting Chaperone Function. Biochemistry 52, 8226–8236
- Jamieson et al. 2003 Jamieson, A. C., Miller, J. C., and Pabo, C. O. (2003) Drug discovery with engineered zinc-finger proteins. Nature Reviews Drug Discovery 2, 361–368
- Balk et al. 2003 Balk, S. P., Ko, Y.-J., and Bubley, G. J. (2003) Biology of prostate-specific antigen. J. Clin. Oncol. 21, 383–391
- Formisano et al. 2015 Formisano, N., Jolly, P., Bhalla, N., Cromhout, M., Flanagan, S. P., Fogel, R., Limson, J. L., and Estrela, P. (2015) Optimisation of an electrochemical impedance spectroscopy aptasensor by exploiting quartz crystal microbalance with dissipation signals. Sens. Actuators B Chem. 220, 369–375
- Aus et al. 2005 Aus, G., Damber, J.-E., Khatami, A., Lilja, H., Stranne, J., and Hugosson, J. (2005) Individualized screening interval for prostate cancer based on prostate-specific antigen level: results of a prospective, randomized, population-based study. Arch. Intern. Med. 165, 1857–1861
- Botchorishvili et al. 2009 Botchorishvili, G., Matikainen, M. P., and Lilja, H. (2009) Early prostate-specific antigen changes and the diagnosis and prognosis of prostate cancer. Current Opinion in Urology 19, 221–226
- Lilja et al. 2008 Lilja, H., Ulmert, D., and Vickers, A. J. (2008) Prostate-specific antigen and prostate cancer: prediction, detection and monitoring. Nature Reviews Cancer 8, 268–278
- Liu et al. 2012 Liu, B., Lu, L., Hua, E., Jiang, S., and Xie, G. (2012) Detection of the human prostate-specific antigen using an aptasensor with gold nanoparticles encapsulated by graphitized mesoporous carbon. Microchim. Acta 178, 163–170
- Lai et al. 2006 Lai, J., Kedda, M.-A., Hinze, K., Smith, R. L., Yaxley, J., Spurdle, A. B., Morris, C., Harris, J., and Clements, J. A. (2006) PSA/KLK3 AREI promoter polymorphism alters androgen receptor binding and is associated with prostate cancer susceptibility. Carcinogenesis 28, 1032–1039
- Laity et al. 2001 Laity, J. H., Lee, B. M., and Wright, P. E. (2001) Zinc finger proteins: new insights into structural and functional diversity. Current Opinion in Structural Biology 11, 39–46
- Wolfe et al. 2000 Wolfe, S. A., Nekludova, L., and Pabo, C. O. (2000) DNA Recognition by Cys2His2Zinc Finger Proteins. Annual Review of Biophysics and Biomolecular Structure 29, 183–212
- Shaffer et al. 2004 Shaffer, P. L., Jivan, A., Dollins, D. E., Claessens, F., and Gewirth, D. T. (2004) Structural basis of androgen receptor binding to selective androgen response elements. Proceedings of the National Academy of Sciences 101, 4758–4763
- Godwin et al. 2017 Godwin, R. C., Melvin, R. L., Gmeiner, W. H., and Salsbury, F. R. (2017) Binding Site Configurations Probe the Structure and Dynamics of the Zinc Finger of NEMO (NF-B Essential Modulator). Biochemistry 56, 623–633
- Godwin et al. 2015 Godwin, R., Gmeiner, W., and Salsbury, F. R. (2015) Importance of long-time simulations for rare event sampling in zinc finger proteins. Journal of Biomolecular Structure and Dynamics 34, 125–134
- Hamed and Arya 2016 Hamed, M. Y., and Arya, G. (2016) Zinc finger protein binding to DNA: an energy perspective using molecular dynamics simulation and free energy calculations on mutants of both zinc finger domains and their specific DNA bases. Journal of Biomolecular Structure and Dynamics 34, 919–934
- Lee et al. 2010 Lee, J., Kim, J.-S., and Seok, C. (2010) Cooperativity and Specificity of Cys2His2Zinc Finger Protein-DNA Interactions: A Molecular Dynamics Simulation Study. The Journal of Physical Chemistry B 114, 7662–7671
- Alberts et al. 2014 Alberts, B., Johnson, A. D., Lewis, J., Morgan, D., Raff, M., Roberts, K., and Walter, P. Molecular Biology of the Cell, 6th ed.; W. W. Norton & Company, 2014
- Lee et al. 2011 Lee, S., Tran, C. V., and Nguyen, T. T. (2011) Inhibition of DNA ejection from bacteriophage by Mg+2 counterions. J. Chem Phys. 134, 125104
- Dudev and Lim 2002 Dudev, T., and Lim, C. (2002) Factors Governing the Protonation State of Cysteines in Proteins: An Ab Initio/CDM Study. Journal of the American Chemical Society 124, 6759–6766
- Peters et al. 2010 Peters, M. B., Yang, Y., Wang, B., Füsti-Molnár, L., Weaver, M. N., and Merz, K. M. (2010) Structural Survey of Zinc-Containing Proteins and Development of the Zinc AMBER Force Field (ZAFF). Journal of Chemical Theory and Computation 6, 2935–2947
- Brandt et al. 2009 Brandt, E. G., Hellgren, M., Brinck, T., Bergman, T., and Edholm, O. (2009) Molecular dynamics study of zinc binding to cysteines in a peptide mimic of the alcohol dehydrogenase structural zinc site. Phys. Chem. Chem. Phys. 11, 975–983
- Grosberg et al. 2002 Grosberg, A. Y., Nguyen, T. T., and Shklovskii, B. (2002) Low temperature physics at room temperature in water: Charge inversion in chemical and biological systems. Rev. Mod. Phys. 74, 329–345
- Nguyen et al. 2017 Nguyen, V. D., Nguyen, T. T., and Carloni, P. (2017) DNA like-charge attraction and overcharging by divalent counterions in the presence of divalent co-ions. Journal of Biological Physics 43, 185–195
- Nguyen 2016 Nguyen, T. T. (2016) Grand-canonical simulation of DNA condensation with two salts, effect of divalent counterion size. The Journal of Chemical Physics 144, 065102
- Hall et al. 2009 Hall, A. R., van Dorp, S., Lemay, S. G., and Dekker, C. (2009) Electrophoretic Force on a Protein-Coated DNA Molecule in a Solid-State Nanopore. Nano Letters 9, 4441–4445
- Netz 2001 Netz, R. R. (2001) Electrostatistics of counterions at and between planar charged walls: From PoissonBoltzmann to the strong-coupling theory. Eur. Phys. J. E 5, 557–574
- Gelbart et al. 2000 Gelbart, W. M., Bruinsma, R. F., Pincus, P. A., and Parsegian, V. A. (2000) DNA-Inspired Electrostatics. Physics Today 53, 38–44
- Grønbech-Jensen et al. 1997 Grønbech-Jensen, N., Mashl, R. J., Bruinsma, R. F., and Gelbart, W. M. (1997) Counterion-Induced Attraction between Rigid Polyelectrolytes. Physical Review Letters 78, 2477–2480
- Naji et al. 2004 Naji, A., Arnold, A., Holm, C., and Netz, R. R. (2004) Attraction and unbinding of like-charged rods. Eur. Phys. Lett. 67, 130–136
- Showalter and Brüschweiler 2007 Showalter, S. A., and Brüschweiler, R. (2007) Validation of molecular dynamics simulations of biomolecules using NMR spin relaxation as benchmarks: application to the AMBER99SB force field. J. Chem. Theory Comput. 3, 961–975
- Ivani et al. 2016 Ivani, I. et al. (2016) Parmbsc1: a refined force field for DNA simulations. Nature Methods 13, 55–58
- Price and Brooks III 2004 Price, D. J., and Brooks III, C. L. (2004) A modified TIP3P water potential for simulation with Ewald summation. J. Chem. Phys. 121, 10096–10103
- Hess et al. 2008 Hess, B., Kutzner, C., Van Der Spoel, D., and Lindahl, E. (2008) GROMACS 4: algorithms for highly efficient, load-balanced, and scalable molecular simulation. J. Chem. Theory Comput. 4, 435–447
- Nosé 1984 Nosé, S. (1984) A molecular dynamics method for simulations in the canonical ensemble. Mol. Phys. 52, 255–268
- Hoover 1985 Hoover, W. G. (1985) Canonical dynamics: Equilibrium phase-space distributions. Phys. Rev. A 31, 1695–1697
- Parrinello and Rahman 1980 Parrinello, M., and Rahman, A. (1980) Crystal Structure and Pair Potentials: A Molecular-Dynamics Study. Physical Review Letters 45, 1196–1199
- Parrinello and Rahman 1981 Parrinello, M., and Rahman, A. (1981) Polymorphic transitions in single crystals: A new molecular dynamics method. J. Appl. Phys. 52, 7182–7190
- Darden et al. 1993 Darden, T., York, D., and Pedersen, L. (1993) Particle mesh Ewald: An N log (N) method for Ewald sums in large systems. J. Chem. Phys. 98, 10089–10092
- Hess et al. 1997 Hess, B., Bekker, H., Berendsen, H. J., and Fraaije, J. G. (1997) LINCS: a linear constraint solver for molecular simulations. J. Comput. Chem. 18, 1463–1472
- Humphrey et al. 1996 Humphrey, W., Dalke, A., and Schulten, K. (1996) VMD: visual molecular dynamics. J Mol Graph 14, 33–38
- Li et al. 2008 Li, W., Zhang, J., Wang, J., and Wang, W. (2008) Metal-Coupled Folding of Cys2His2 Zinc-Finger. Journal of the American Chemical Society 130, 892–900
- Pang 1999 Pang, Y.-P. (1999) Novel Zinc Protein Molecular Dynamics Simulations: Steps Toward Antiangiogenesis for Cancer Treatment. Journal of Molecular Modeling 5, 196–202