Mapping Observations of complex organic molecules around Sagittarius B2 with ARO 12m telescope
Abstract
We performed high-sensitivity mapping observations of several complex organic molecules around Sagittarius B2 with ARO 12m telescope at 3-mm wavelength. Based on their spatial distribution, molecules can be classified as either “extended" that detected not only in Sgr B2(N) and Sgr B2(M), or “compact" that only detected toward or near to Sgr B2(N) and Sgr B2(M). The “extended" molecules including glycolaldehyde (CH2OHCHO), methyl formate (CH3OCHO), formic acid (t-HCOOH), ethanol (C2H5OH) and methyl amine (CH3NH2), while the “compact" molecules including dimethyl ether (CH3OCH3), ethyl cyanide (C2H5CN), and amino acetonitrile (H2NCH2CN). These “compact" molecules are likely produced under strong UV radiation, while “extended" molecules are likely formed under low-temperature, via gas-phase or grain surface reactions. The spatial distribution of “warm" CH2OHCHO at 89 GHz differ from the spatial distribution of “cold" CH2OHCHO observed at 13 GHz. We found evidence for an overabundance of CH2OHCHO compared to that expected from the gas-phase model, which indicates that grain-surface reactions are necessary to explain the origin of CH2OHCHO in Sagittarius B2. Grain-surface reactions are also needed to explain the correlation between the abundances of “cold" CH2OHCHO and C2H5OH. These results demonstrate the importance of grain-surface chemistry in the production of complex organic molecules.
keywords:
ISM: abundances - ISM: clouds - ISM: individual (Saggitarius B2) - ISM: molecules - radio lines: ISM1 Introduction
Complex organic molecules (COMs) are regarded to be related to the origin of life on Earth (Herbst & van Dishoeck, 2009). Thus, understanding property and formation mechanism of prebiotic molecules is key for study of astrobiology. It has been found that prebiotic molecules are very abundant in the Galactic center giant molecular cloud Sagittarius B2 (Sgr B2) (Menten, 2011). Sgr B2 contains two main sites of star formation, Sgr B2(N) and Sgr B2(M), which have been the best hunting ground for prebiotic molecules in the interstellar medium (ISM) since the early 1970s (Belloche et al., 2013). Many COMs are first detected toward Sgr B2(N), such as glycoaldehyde CH2OHCHO (Hollis et al., 2000), ethylene glycol HOCH2CH2OH (Hollis et al., 2002), amino acetonitrile H2NCH2CN (Belloche et al., 2008) and so on. Some COMs, such as glycolaldehyde and ethylene glycol, were found to be widespread in the Galactic center (Hollis et al., 2001; Requena-Torres et al., 2006, 2008; Li et al., 2017).
Theoretical and experimental studies (Garrod et al., 2008; Woods et al., 2013; Skouteris et al., 2018; Öberg et al., 2009; Fedoseev et al., 2015; Chuang et al., 2016; Meinert et al., 2016) show that COMs may be formed on cosmic dusts by radicals that are produced on dust grain surfaces by UV or cosmic ray induced photons. The COMs are then desorbed into the gas phase due to thermal and/or non-thermal processes (Garrod & Herbst, 2006). However, these complex ice compositions cannot be directly observed with telescopes in the infrared; thus, most constraints come from millimeter observations of desorbed ice chemistry products. On the other hand, recent quantum chemical computations show that the combination of radicals trapped in amorphous water ice does not necessarily lead to the formation of COMs (Enrique-Romero et al., 2016). Recently, a new scheme for the gas-phase synthesis of glycolaldehyde, a species with a prebiotic potential, has been proposed. The predicted abundance of glycolaldehyde agrees well with that measured in solar-type hot corinos and shock sites (Skouteris et al., 2018). Thus, how these species are synthesized is a mystery.
Previous mapping observations mainly concentrate on Sgr B2(N) with interferometers like ATCA and ALMA at small spatial scales ( 1 ′) (Corby et al., 2015; Sánchez-Monge et al., 2017; Belloche et al., 2016, 2019; Bonfand et al., 2019; Xue et al., 2019), and only a handful of large-scale spectral line mapping observations toward Sgr B2 has been performed (Jones et al., 2008, 2011; Chengalur & Kanekar, 2003). The large-scale spatial distribution of COMs like C2H5CN, HCOOH are still unclear mainly because of their weak emission (Halfen, Woolf & Ziurys, 2017). Single dish telescopes have ability to probe the structure of weak lines from extended gas of Sgr B2 complex on spatial scales much larger than 1′. In this paper we present high-sensitivity grid imaging results of several COMs around Sgr B2 with the Arizona Radio Observatory (ARO) 12 m telescope. In §2, we describe the observations and data reduction. In §3, we present the mapping result, and spatial distribution of column densities, rotational temperatures, and estimated abundances for the observed COMs. In §4, we discuss molecular formation pathways and compare our results with protostars and then summarize our conclusions in §5.
2 Observations and data reduction
We performed point by point mapping observations of COMs at 3-mm wavelength around Sgr B2 in 2017 April and May with the Arizona Radio Observatory 12 m telescope at Kitt Peak, Arizona. The 85 - 116 GHz Sideband Separating ALMA Band-3 Receiver was used. The beam size is 70 arcsec at 90 GHz. The 2 IF modes of Millemeter Auto Correlator (MAC) were employed as backends. The MAC has 4096 channels with 195 kHz sampling interval, corresponding to 0.65 km s-1at 90 GHz. Though the velocity resolution is not high enough for study of molecular emission from hot cores, but enough for single dish observations of Sgr B2. The FWHM linewidth is up to 20 km s-1 (Rivilla et al., 2018, 2019) due to the extended envelope and several unresolved cores with different velocities and linewidths within the beam. The temperature scale was determined by the chopper wheel method, and is related to the main beam brightness temperature with main beam efficiency of 0.88. The system temperature range from 90 to 150 K. The integration time for each position range from 50 minutes to 90 minutes.
Observations were conducted in position-switching mode, and an offset of +30 arcmin in azimuth was used. The data processing was conducted using GILDAS software package111http://www.iram.fr/IRAMFR/GILDAS., including CLASS and GREG. Linear baseline subtractions were used for most of the spectra. For each transition, the spectra of subscans, including two polarizations, were averaged to reduce rms noise levels. Gaussian fitting is used to derive the physical properties of molecule lines, including peak intensity, VLSR, FWHM line width, and integrated intensity.
3 Observing Results
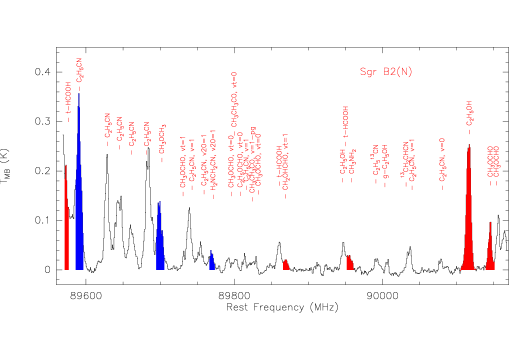
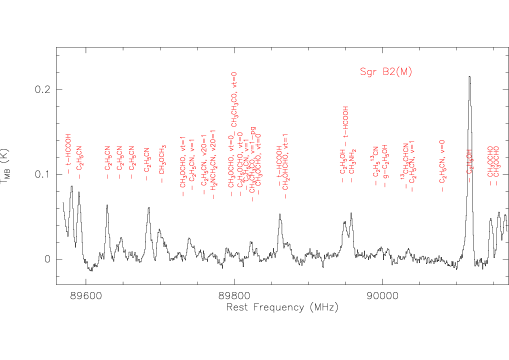
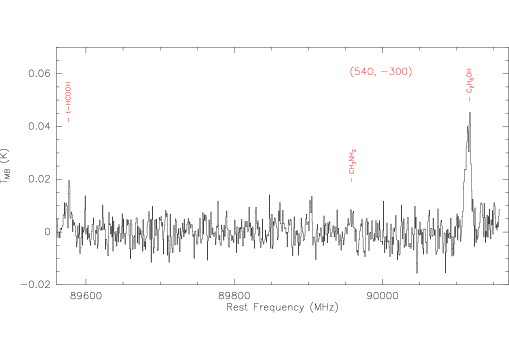
We detected emission lines from t-HCOOH, C2H5CN, CH3OCH3, CH3OCHO, H2NCH2N, CH2OHCHO, CH3NH2, and C2H5OH toward many positions at a rms level of 3 mK. Figure 1 presents spectra observed toward several positions with ARO 12m telescope. As is shown in Figure 1, some molecule lines are only detected toward Sgr B2(N) and Sgr B2(M). Table 1 presents detected transitions, and their spectroscopic properties in Sgr B2(N). The molecular spectroscopic parameters are taken from the current public databases: the CDMS catalog222https://www.astro.uni-koeln.de/cdms/catalog (Müller et al., 2005), the JPL catalog333https://spec.jpl.nasa.gov (Pickett et al., 1998) and the Spectral Line Atlas of Interstellar Molecules (SLAIM) database, which are available in the SPLATALOGUE spectroscopy database444https://www.splatalogue.net.. Note that the strong C2H5CN emission near to t-HCOOH 4(0,4)-3(0,3) (89.57917 GHz) make it difficult to determine the baseline and intensity of t-HCOOH. Only t-HCOOH emission toward Sgr B2(N) was affected since the C2H5CN emission was very weak toward other positions.
| Species | Transitions | Rest Freq. | S | VLSR | dv | |||
|---|---|---|---|---|---|---|---|---|
| (GHz) | (K) | (D2) | (mK) | (km s-1) | (km s-1) | (mK km s-1) | ||
| t-HCOOH∗ | 4(0,4)-3(0,3) | 89.57917(1e-6) | 10.76 | 8.077 | 100 | 64 | 20 | 2000 |
| C2H5CN,v=0 | 10(9,1)-9(9,0) | 89.584987(5e-5) | 109.32 | 28.16 | blended | - | - | - |
| C2H5CN,v=0 | 10(9,2)-9(9,1) | 89.584987(5e-5) | 109.32 | 28.16 | blended | - | - | - |
| C2H5CN,v=0∗ | 10(4,7)-9(4,6) | 89.590028(3e-6) | 41.44 | 124.52 | 160(45) | 63.0(.6) | 22.0(1.4) | 3520(610) |
| C2H5CN,v=0 | 10(4,6)-9(4,5) | 89.591013(3e-6) | 41.44 | 124.52 | 160(45) | 63.0(.6) | 22.0(1.4) | 3520(610) |
| C2H5CN,v=0 | 10(3,8)-9(3,7) | 89.628485(3e-6) | 33.66 | 134.89 | 200(10) | 65.0(1.4) | 21.9(4.0) | 4666(654) |
| C2H5CN,v20=1 | 10(8,3)-9(8,2) | 89.643412(2e-6) | 630.76 | 52.43 | blended | |||
| C2H5CN,v20=1 | 10(4,7)-9(4,6) | 89.661002(5e-5) | 577.94 | 122.32 | 30(3) | 67.2(.4) | 7.0(1.2) | 211(57) |
| C2H5CN,v=0 | 10(3,7)-9(3,6) | 89.684710(3e-6) | 33.66 | 134.88 | 134(3) | 60.9(2.6) | 26.8(2.6) | 3821(236) |
| CH3OCH3,v=0 | 2(2,1)-2(1,2)AE | 89.697737(1e-6) | 8.36 | 8.475 | 91(8) | 66.5(2.6) | 18.4(2.6) | 1783(158) |
| CH3OCH3,v=0∗ | 2(2,1)-2(1,2)EE | 89.699809(1e-6) | 8.36 | 22.31 | 50(8) | 64.2(2.6) | 15.1(2.6) | 797(158) |
| CH3OCH3,v=0 | 2(2,1)-2(1,2)AA | 89.702829(2e-6) | 8.36 | 14.131 | 46(8) | 65.2(.3) | 23.0(2.6) | 1131(158) |
| CH3OCHO, vt=1 | 8(0, 8) - 7(0, 7) A | 89.731695(1e-5) | 207.83 | 41.664 | 29(6) | 64.2(.3) | 7.4(.7) | 228(19) |
| C2H5CN,v20=1 | 10(3,7) - 9(3,6) | 89.754402(5e-5) | 570.24 | 132.51 | 43(5) | 65.9(.4) | 34.3(1.2) | 1579(46) |
| H2NCH2CN∗ | 10(0,10)-9(3,6) | 89.770285(7e-6) | 19.50 | 66.296 | 25(3) | 63.7(0.7) | 14.5(1.6) | 377(40) |
| t-HCOOH | 4(2,3)-3(2,2) | 89.861484(2e-6) | 23.51 | 5.93 | 50(3) | 66.9(.2) | 18.5(.6) | 987(26) |
| CH2OHCHO∗ | 9(1,8)-8(2,7) | 89.868639(6e-6) | 26.43 | 20.565 | 17(3) | 61.5(2.6) | 18.6(2.6) | 338(41) |
| t-HCOOH | 4(3,2)-3(3,1) | 89.94821(2e-6) | 35.09 | 3.536 | blended | |||
| CH3NH2∗ | 1(1)A1-1(0)A2 | 89.956068(2e-5) | 6.45 | 1.5a | 31(3) | 67.8(1.3) | 30.3(2.8) | 982(87) |
| CH3CH2C13N | 10(2,8)-9(2,7) | 89.992750(1.2e-6) | 28.10 | 139.763 | blended | |||
| g-C2H5OH | 13(1,12)-13(1,13),g+ | 90.0077(5e-5) | 135.11 | 13.99 | 28(3) | 64.0(.5) | 6.2(1.2) | 188(53) |
| 13CH2CHCN | 10(1,10)-9(1,9) | 90.032588(1.2e-6) | 25.92 | 432.232 | blended | |||
| CHCH2CN, v=0 | 10(2,8)-9(2,7) | 90.079288(1.3e-6) | 28.00 | 139.77 | 24(3) | 66.3(6) | 17.7(1.3) | 457(29) |
| C2H5OH∗ | 4(1,4)-3(0,3) | 90.11761(2.8e-6) | 9.36 | 5.21 | 266(9) | 68.5(.1) | 22.4(.2) | 6330(37) |
| CH3OCHO∗ | 7(2,5)-6(2,4) E | 90.145634(2.4e-5) | 19.68 | 34.275 | 86(7) | 65.7(.1) | 16.7(.4) | 1523(28) |
| CH3OCHO | 7(2,5)-6(2,4) A | 90.156473(1e-5) | 19.67 | 34.289 | 80(7) | 66.3(.4) | 13.7(.9) | 1166(65) |
Notes.- ∗: Lines used for mapping. Col. (1): chemical formula; Col. (2): transition quantum numbers, Col. (3): rest frequency; Col. (4): upper state energy level (K); Col. (5): dipole-weighted transition dipole matrix elements; Col. (6): peak temperature; Col. (7): centroid velocity; Col. (8): FWHM linewidth; Col. (9): integrated intensity. a: S is taken from (Motiyenko et al., 2014) for CH3NH2.
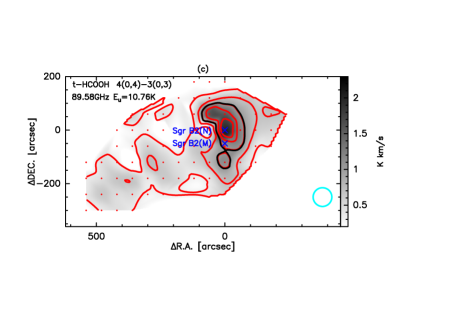
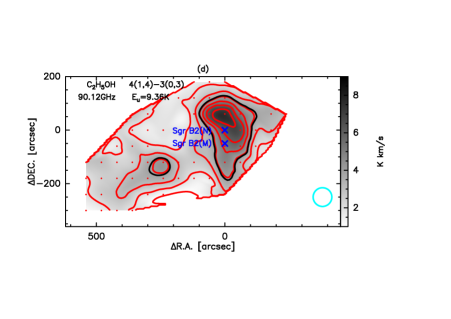
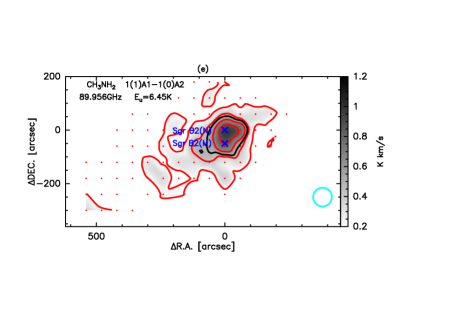
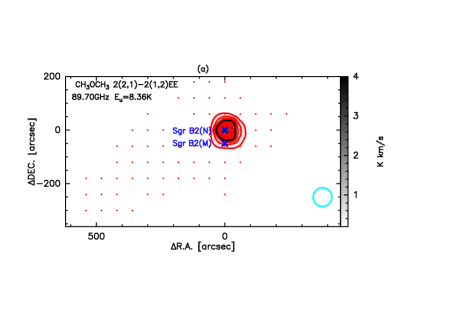
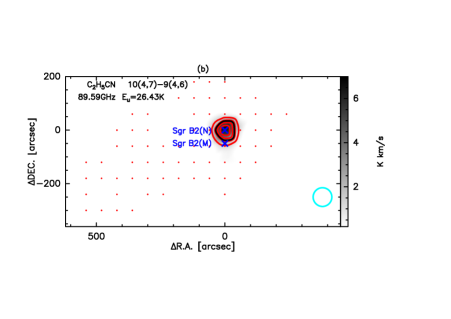
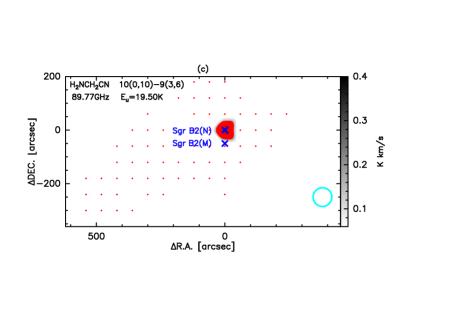
The many hazards of searching for new molecules have been pointed out by Snyder et al. (2005). These authors proposed some of the criteria needed for secure molecular identification, including accurate rest frequencies and consistency among the acquired data set. Halfen et al. (2006) extended Criteria in Snyder et al. (2005) and applied them to the ARO 12m observations. They suggest that for an accurate identification, there must be strong evidence for emission at all favorable, physically connected transitions over a sufficiently large wavelength range. There cannot be ‘missing’ favorable lines. Based on these criteria, CH2OHCHO 9(1,8)-8(2,7) (89.868639 GHz), the glycolaldehyde transition used in this work was found to be strong and relatively clean. Xue et al. (2019) proposed a quantitative method to identify weak and mostly uncontaminated transitions. They used P factor, which is the product of the observed and simulated line profiles, to characterizing the frequency agreement. They used D factor, which is the ratio between the difference of the integrated intensities of the compared spectra and the maximum of the two subtracted from 1, to measure the difference of the line intensities. For CH2OHCHO 9(1,8)-8(2,7) at 89.868639 GHz, the P factor is 94%, while the D factor is 16.8%. For CH3OCHO 7(2,5)-6(2,4) E at 90.145 GHz, the P factor is 99.8%, while the D factor is 25.4% (see appendix in Xue et al. (2019)). Based on the P factors, both of these two transitions are assigned to be unblended transition candidates. The low D factors are likely to be caused by the high excitation temperature (190 K) adopted by Xue et al. (2019). Transitions of other molecules have been identified by Belloche et al. (2013). Velocity integrated images of strong and relatively clean transitions, including CH2OHCHO 9(1,8)-8(2,7), CH3OCHO 7(2,5)-6(2,4)E, t-HCOOH 4(0,4)-3(0,3), C2H5OH 4(1,4)-3(0,3) and CH3NH2 1(1,0)-1(0,1), CH3OCH3 2(2,1)-2(1,2)EE, C2H5CN 10(4,7)-9(4,6) and H2NCH2CN 10(0,10)-9(3,6) were presented in Figure 2 and Figure 3. Positions of Sgr B2(N) and Sgr B2(M) are indicated with crosses. The peak integrated intensity on the Tmb scale are given in the caption. We could see from Figure 2 and Figure 3 that some molecular line emission concentrate on Sgr B2(N) and Sgr B2(M), and some molecular line emission extend to the eastern part of Sgr B2. Based on their spatial distribution, molecules can be classified as either “extended" that detected not only in Sgr B2(N) and Sgr B2(M), or “compact" that only detected toward or near to Sgr B2(N) and Sgr B2(M).
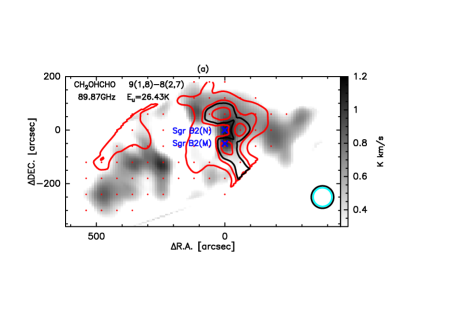
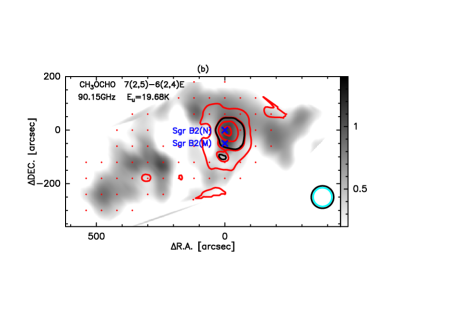
The excitation analysis of glycolaldehyde emissions at millimeter and centimeter wavelengths in Sgr B2(N) indicates that a single temperature component was unable to reproduce all the observed spectra (Hollis et al., 2004). Thus, two temperature components were invoked: a “warm" extended glycolaldehyde envelope surrounded by a “cold" glycolaldehyde halo (Hollis et al., 2004). The 89 GHz transitions with a higher upper-level energy (26.43 K) are regarded as coming from the “warm" phase, while transitions with a lower upper-level energy (1.2 K) are regarded as coming from the “cold" phase. The “cold" glycolaldehyde was found to be widespread around the Sgr B2 complex (Li et al., 2017). Figure 2a shows a contour map of the velocity-integrated intensities of the “warm" glycolaldehyde emission obtained with the ARO 12m telescope overlaid on the “cold" glycolaldehyde emission acquired with the Shanghai Tianma 65m telescope in grey scale (Li et al., 2017). The half-power beamwidths were 70 arcsec and 77 arcsec for ARO 12 m observations and 65m observations, respectively. The “cold" glycolaldehyde is distributed across 800 arcsec (33 pc in diameter), which is substantially more extended than the “warm" glycolaldehyde. The “warm" glycolaldehyde emission shows several peaks, including the north cloud, the peak near Sgr B2(M), and the ridge west of Sgr B2(N). A weak “warm" glycolaldehyde emission at 89 GHz was also detected toward the eastern component of the Sgr B2 complex.
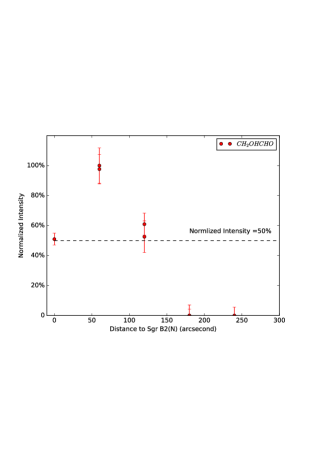
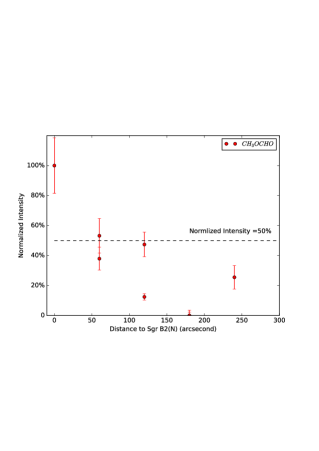
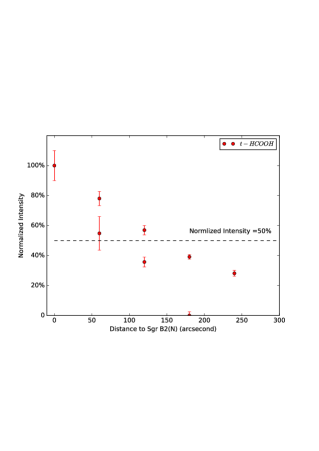
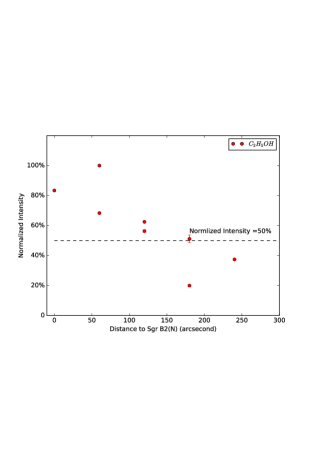
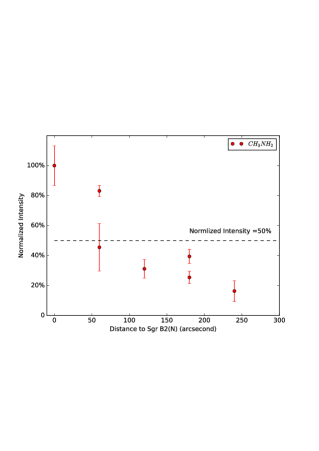
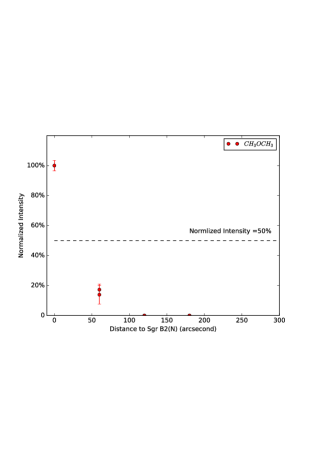
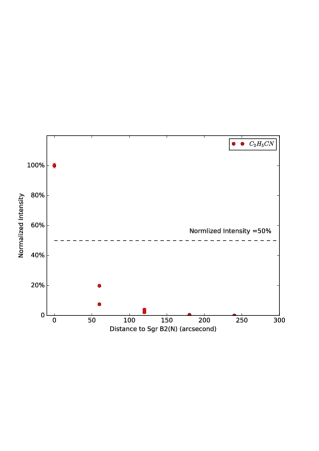
According to BIMA observations (Hollis et al., 2001), glycolaldehyde is greatly extended in comparison to the ethyl cyanide and dimethyl ether, which are largely confined to the Large Molecule Heimat source (LMH) (Snyder, Kuan & Miao, 1994; Miao et al., 1995), so these molecules were classified as either “extended" or “compact" here based on the half-power radius of the spatial distributions in Figures 2 and 3. Figure 4 shows variation of the normalized integrated intensity of observed transitions with the distance to Sgr B2(N) for sampling points with RA=0. The normalized intensity is obtained through dividing the integrated intensity by the maximum integrated intensity of molecule. We change the declination and take a measurement at constant RA (RA=0). FWHM, the full width at half maximum, is always used to evaluate the line width of spectral line. Thus we selected 50% as a metric to evaluate the distribution of molecules. We could see from Figure 4 that the normalized intensity of CH3OCH3, C2H5CN and H2NCH2CN quickly decrease below 50% for sampling points away from Sgr B2(N). The half-power radius of these molecules are smaller than the sampling interval (1′). Thus these three molecules are classified as “compact” molecules. H2NCH2CN was only detected in Sgr B2(N) in our observations, thus it is also classified as “compact" molecules. On the other hand, the normalized intensity of CH2OHCHO, CH3OCHO, t-HCOOH, C2H5OH and CH3NH2 vary slowly as the distance to Sgr B2(N), thus these molecules are classified as “extended" molecules. In order to investigate whether only the strongest lines are extended, the “extended" line profiles were colored with red, while the “compact" line profiles were colored with blue in spectra of Sgr B2N (Figure 1 upper panel). As is shown in Figure 1 upper panel, the strongest emissions come from C2H5CN, C2H5OH, t-HCOOH and CH3OCH3. Among them, C2H5CN and CH3OCH3 emission are confined to Sgr B2N and Sgr B2M. Thus it is sure that not all the strongest lines are the most extended. It is noted that CH2OHCHO peaks away from Sgr B2N, which seems to differ from most COMs presented in this paper. The line blending makes it difficult to obtain the intensity of CH2OHCHO accurately. We have mapped CH2OHCHO around Sgr B2 with IRAM 30m telescope with better spatial and spectral resolution to further investigate this issue. The preliminary result is consistent with ARO 12m result present here. Detailed chemical model is needed to explain the spatial distribution of glycolaldehyde in this region.
3.1 “Extended" Molecules
Glycolaldehyde CH2OHCHO: CH2OHCHO, which is a sugar-related molecule, can react with propenal to form ribose - a central constituent of RNA (Sharma et al., 2016). CH2OHCHO, was first detected in Sgr B2(N) based on the emission spectra in the millimeter-wave range observed with the NRAO 12m telescope (Hollis et al., 2000). The CH2OHCHO 8(0,8)-7(1,7) emission at 89 GHz was regarded to come from “warm" glycolaldehyde, while the 13 GHz emission was regarded to come from “cold" glycolaldehyde (Hollis et al., 2004). The distribution of “warm" glycolaldehyde is extended and seems to be comprised of several emission cores (see Figure 2). Sensitive interferometric observations are needed to resolve and study these cores in detail. The “cold" glycolaldehyde has been found to be widespread around the Sgr B2 complex (Li et al., 2017). The different spatial distribution of “warm" and “cold" glycolaldehyde seems to be caused by different excitation conditions, including temperature and density of molecular gas.
Methyl formate CH3OCHO: ARO observations indicate that the spatial distribution of methyl formate emission significantly differ from both the “warm" and the “cold" glycolaldehyde. It seems to peak toward Sgr B2(N) and Sgr B2(M), and decrease toward the surroundings. Weak emission was seen at the eastern part of Sgr B2 complex.
Formic acid t-HCOOH: t-HCOOH is a key organic molecule as the carboxyl group (C(=O)OH) is one of the main functional groups of amino acids (the structural units of proteins). This species is involved in a chemical route leading to glycine, the simplest amino acid (Redondo et al., 2015). ARO observations indicate that the spatial distribution of t-HCOOH extends to the eastern component and peaks at Sgr B2(N).
Ethanol C2H5OH: C2H5OH was first detected toward Sgr B2 (Zuckerman et al., 1975). This molecular was found to be present only in the dense ( cm-3) and hot (100 K) cores associated with newly formed massive stars (Widicus Weaver et al., 2017; Qin et al., 2010; Bisschop et al., 2007; Martín-Pintado et al., 2001). Martín-Pintado et al. (2001) found that C2H5OH emission in Sgr B2 is widespread. They proposed that C2H5OH formed in grains and released to gas phase by shocks in the last yr. Results present here provide further evidence for the presence of extended ethanol around Sgr B2. The C2H5OH emission peaks at the north of Sgr B2(N).
Methylamine CH3NH2: CH3NH2 was first detected in Sgr B2(OH) (Kaifu et al., 1974). It was also detected in the southern region of Sgr B2 (Halfen et al., 2013). CH3NH2 is thought to be potential interstellar precursors to the amino acid glycine, NH2CH2COOH. The reaction of CH3NH2 with CO2 in water ice has been shown to yield NH2CH2COOH after UV irradiation (Bossa et al., 2009; Lee et al., 2009). Our observations indicate that CH3NH2 emission peaks at Sgr B2(N), and extends to the eastern part of Sgr B2 complex, which is in agreement with previous results.
3.2 “Compact" Molecules
Dimethyl ether CH3OCH3: The CH3OCH3 emission is detected toward Sgr B2(N) and a few points near to Sgr B2(N). Though CH3OCH3 is isomer of C2H5OH, the distribution of these two molecules are strikingly different, implying that they have different chemical route, which is consistent with observations in W51 (Rong et al., 2015). As C2H5OH is thought to be produced by grain-surface reactions, CH3OCH3 is likely to form via gas-phase chemistry. The spatial distribution of CH3OCH3 also differ from those of CH3OCHO, which seem to be different from observations in massive star-forming regions in Galactic disk. Striking similarity was found in the spatial distribution, temperature and column densities of these two molecules in star-forming regions in Galactic disk (Brouillet et al., 2013; Jaber et al., 2014; Rong et al., 2015). CH3OCH3 has been proposed as a precursor molecule to CH3OCHO (Balucani et al., 2015). The obvious difference in spatial distribution of CH3OCH3 and CH3OCHO observed in Sgr B2 suggests that the formation mechanism of these two molecules might differ in the Galactic center and Galactic disk sources.
Ethyl cyanide C2H5CN: Previous observations of C2H5CN in Sgr B2 has shown that this molecule is confined to a small region, and likely to be located in the hot, dense core of the star-forming region (Miao & Snyder, 1997). Our mapping results show that C2H5CN was only detected toward Sgr B2(N), and four points near to Sgr B2(N), which agree with previous studies.
Amino acetonitrile H2NCH2CN: H2NCH2CN was first detected in Sgr B2(N) (Belloche et al., 2008). The source size was estimated to be about 2” FWHM. No evidence for colder, more extended emission was found. Amino acetonitrile may well be a direct precursor of glycine. In our observations, H2NCH2CN was only detected toward Sgr B2(N).
3.3 Column densities
According to IRAM 30m observations of COMS (Requena-Torres et al., 2006), derived from C2H5OH is 72.6 K for Sgr B2N, and 55.4 K for Sgr B2M. derived from C2H5OH range from 9-14 K for other Galactic center clouds, derived from CH3OCHO range from 8-16 K for other Galactic center clouds. Assuming the excitation temperature of 50 K for Sgr B2N and Sgr B2(M), and 14 K for other positions, we calculate the total column densities of “warm" CH2OHCHO, CH3OCHO, C2H5OH and t-HCOOH for the i, j-th grid in the position-position space with the expression reported by Hollis et al. (2004):
| (1) |
in which is the Boltzmann constant in erg K-1, is the observed line integrated intensity in K Km s-1, is the frequency of the transition in Hz, and is the product of the total torsion-rotational line strength and the square of the electric dipole moment. and (=2.73 K) are the excitation temperature and background brightness temperature, respectively. is the upper level energy in K. The partition function, , was estimated by fitting the partition function at different temperatures given in CDMS (Müller et al., 2005). Values of and are also taken from CDMS.
Because of effects of beam dilution, we did not calculate the column densities of “compact" molecules like C2H5CN and CH3OCH3. In the below discussion, we focus only on oxygen-bearing molecules showing extended emission, including “warm" CH2OHCHO, CH3OCHO, C2H5OH and t-HCOOH.
We made use of the H2 column density obtained with BGPS 1.1 mm data (Bally et al., 2010) for abundance estimation of molecules. For each position, we searched for nearest clump identified with BGPS data, and obtained the corresponding hydrogen column density. The H2 column densities range from cm-2 to cm-2 in our observing region, and peak toward Sgr B2(N) and Sgr B2(M).
4 Discussions
A comparison between the abundances of ethanol and “warm" glycolaldehyde relative to that of for each position is shown in Figure 5. We found that , with a correlation coefficient of 0.96. This result agrees well with the relation found for star-forming regions in the Galactic disk: L1157-b1 (Lefloch et al., 2017), IRAS 16293-2422 (Jørgensen et al., 2016), IRAS 2A and IRAS 4A (Taquet et al., 2015) (see Figure 3). The strong correlation between ethanol and “warm" glycolaldehyde suggests that the “warm" glycolaldehyde may be chemically related to ethanol. Recently, theoretical studies have shown that a new gas-phase scheme of reactions, involving ethanol as a parent molecule, can lead to the formation of glycolaldehyde and formic acid (Skouteris et al., 2018). This model can well explain the abundance correlation between “warm" glycolaldehyde and ethanol. This model is further supported by the strong correlation between the abundances of ethanol and formic acid relative to that of (Figure 5), with a correlation coefficient of 0.92. The correlation between the abundances relative to H2 of ethanol, “warm" glycolaldehyde and formic acid suggests that “warm" glycolaldehyde and formic acid are chemically related to ethanol and are possibly produced by ethanol via gas-phase reactions (Skouteris et al., 2018). However, we couldnot exclude the possibility that these molecules are co-spatial in the same gas and trace a warm gas phase. Interferometric observations of a large sample of interstellar sources could help to investigate whether ethanol, formic acid and “warm" glycolaldehyde are co-spatial and constrain their formation pathways (Xue et al., 2019).
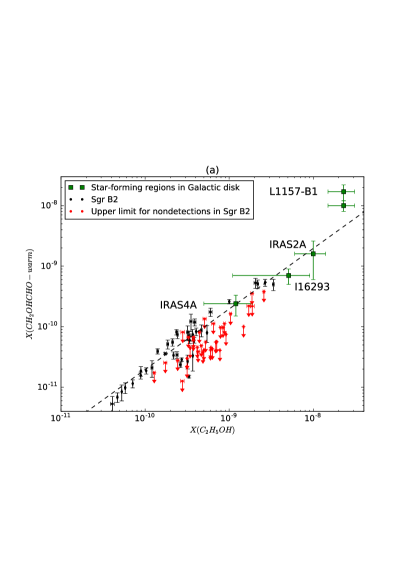
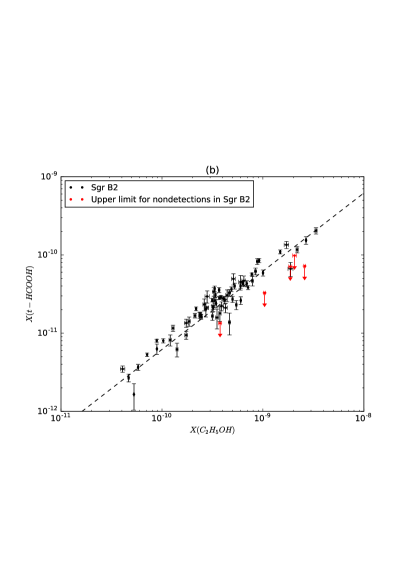
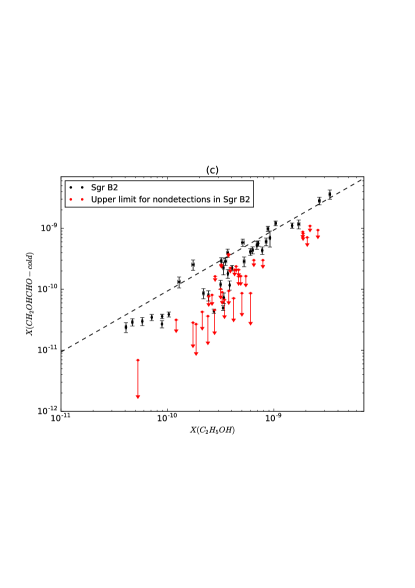
Figure 5 shows a comparison between the abundances relative to H2 of ethanol and “cold" glycolaldehyde for each position. The abundance of “cold" glycolaldehyde was observed at the 13 GHz (Li et al., 2017) range from to , which is similar to the value for ethanol. We found that , with a correlation coefficient of 0.98. Theoretical studies show that gas-phase chemistry cannot produce the observed abundance of ethanol, even under the most favorable conditions (Charnley et al., 1995). Infrared observations also indicate that interstellar ethanol can be formed by grain-surface reactions significantly more efficiently than by gas-phase chemistry (Sandford et al., 1991); thus, ethanol is thought to be a good tracer of dust chemistry. The good correlation (1) between the abundances of ethanol and “cold" glycolaldehyde indicate that the “cold" glycolaldehyde should also be produced by grain-surface reactions. Similar to ethanol, the desorption mechanism for the “cold" glycolaldehyde should be the large-scale shocks in the Galactic center region (Martín-Pintado et al., 2001).
Laboratory studies show that glycolaldehyde always forms on icy grains at low temperatures, regardless of UV-photon absorption (i.e. energetic processes), and methyl formate cannot form efficiently in the absence of energetic processes (Chuang et al., 2017). Overabundant methyl formate would mean that additional UV photons to low-temperature surface chemistry. In contrast, under-abundant methyl formate would mean that only the low-temperature process is important in the production of complex organic molecules. This view agrees well with the results presented here, in which methyl formate emission is concentrated on Sgr B2(N) and Sgr B2(M), where massive star-forming activity takes place and UV-photons are abundant. In contrast, “cold" glycolaldehyde emission is very widespread and extends to the eastern part of the Sgr B2 complex, where no star-forming activity has been found and the UV radiation should be substantially weaker. Thus, the methyl formate and “cold" glycolaldehyde near to Sgr B2(N) and Sgr B2(M) likely form on icy grains under UV radiation, while “cold" glycolaldehyde in regions away from the HII region likely form on icy grains at low temperature.
5 SUMMARY
We have carried out large-scale mapping observations of a series of COMs toward Sgr B2 with the ARO 12m telescope. We obtained large-scale spatial distribution of COMs, including CH2OHCHO, CH3OCHO, t-HCOOH, C2H5OH and CH3NH2, CH3OCH3, C2H5CN, in Sgr B2. The main results of this work include:
1. The spatial distribution of complex organic molecules can be classified as either “extended" or “compact". The “extended" molecules include CH2OHCHO, CH3OCHO, t-HCOOH, C2H5OH and CH3NH2, while the “compact" molecules include CH3OCH3, C2H5CN, and H2NCH2CN.
2. The spatial distribution of CH3OCHO obviously differ from CH3OCH3, which have been observed to have similar spatial distribution and column densities to that in star-forming regions of Galactic disk. These results suggest that the formation mechanisms of these two molecules in Galactic center may differ from that in star-forming regions of Galactic disk.
3. These “compact" molecules likely to be produced under strong UV radiation, while “extended" molecules likely to be formed under low-temperature, via gas-phase or grain surface reactions.
4. We found evidence for an overabundance of CH2OHCHO compared to that expected from the gas-phase model, which indicates that grain-surface reactions are necessary to explain the origin of CH2OHCHO in Sagittarius B2.
Our measurements demonstrate the necessity of grain-surface chemistry for the production of COMs, such as glycolaldehyde in Sgr B2. The results open up an exciting opportunity to study COMs in the circumnuclear disk of starburst galaxies with interferometers including ALMA, the Next Generation Very Large Array (ngVLA) and SKA. Future high-sensitivity interferometric observations possess the potential to probe COM emissions to investigate whether CMZ clouds could serve as a template for the nuclei of starburst galaxies in the nearby and distant universe (Kauffman et al., 2017).
Acknowledgements
The Kitt Peak 12 Meter is operated by the Arizona Radio Observatory (ARO), Steward Observatory, University of Arizona. We thank ARO staff for assisting with the observations. This work is partially supported by the National Key R&D Program of China (No. 2017YFA0402604), the Natural Science Foundation of China (11590780, 11590782, 11590784, U1431125, 11773054 and 11903038), the Special Funding for Advanced Users, budgeted and administrated by Center for Astronomical Mega-Science, Chinese Academy of Sciences (CAMS-CAS) and CAS “Light of West China” Program.
References
- Bally et al. (2010) Bally, J., Aguirre, J., Battersby, C. et al. 2010, ApJ, 721, 137
- Balucani et al. (2015) Balucani, N., Ceccarelli, C. & Taquet, V. 2015, MNRAS, 449, 16
- Belloche et al. (2008) Belloche, A., Menten, K.M., Comito, C. et al. 2008, A&A, 482, 179
- Belloche et al. (2013) Belloche, A., Müller, H.S.P., Menten, K.M., Schilke, P. & Comito, C. 2013, A&A, 559, 47
- Belloche et al. (2014) Belloche, A., Garrod, R.T., Müller, H.S.P. & Menten, K.M. 2014, Science, 345, 1584
- Belloche et al. (2016) Belloche, A., Müller, H.S.P., Garrod, R.T. & Menten, K.M. 2016, A&A, 587, 91
- Belloche et al. (2019) Belloche, A., Garrod, R.T., Müller, H.S.P. & Menten, K.M., Medvedev, I. et al. 2019, A&A, 628, 10
- Bisschop et al. (2007) Bisschop, S. E., Jorgensen, J. K., van Dishoeck, E. F. & de Wachter, E. B. M. 2007, A&A, 465, 913
- Bonfand et al. (2019) Bonfand, M., Belloche, A., Garrod, R.T., Menten, K.M., Stéphan, G. et al. 2019, A&A, 628, 27
- Bossa et al. (2009) Bossa, J. B., Duvernay, F., Theulé, P. et al. 2009, A&A, 506, 601
- Brouillet et al. (2013) Brouillet N. et al., 2013, A&A, 550, A46
- Brouillet et al. (2015) Brouillet, N. et al. 2015, A&A, 576, 129
- Butscher et al. (2015) Butscher, T. et al. 2015, MNRAS, 453, 1587
- Butscher et al. (2016) Butscher, T., Duvernay, F., Danger, G., Chiavassa, T., 2016, A&A, 593, 60
- Charnley et al. (1995) Charnley, S. B., Kress, M. E., Tielens, A. G. G. M., & Millar, T. J. 1995, ApJ, 448, 232
- Chapman et al. (2009) Chapman, J.F., Millar, T.J., Wardle, M., Burton, M. G., Walsh, A.J. 2009, MNRAS, 394, 221
- Chengalur & Kanekar (2003) Chengalur, J. N. & Kanekar, N. 2003, A&A, 403, 43
- Chuang et al. (2016) Chuang, K.-J., Fedoseev, G., Ioppolo, S., van Dishoeck, E. F., Linnartz, H. 2016, MNRAS, 455, 1702
- Chuang et al. (2017) Chuang, K.-J. et al. 2017, MNRAS, 467, 2552
- Corby et al. (2015) Corby, J. F., Jones, P. A., Cunningham, M. R., Menten, K. M., Belloche, A. et al. 2015, MNRAS, 452, 3969
- Coutens et al. (2015) Coutens, A., Persson, M. V., Jørgensen, J. K., Wampfler, S. F., Lykke, J. M. 2015, A&A, 576, 5
- Enrique-Romero et al. (2016) Enrique-Romero, J., Rimola, A., Ceccarelli, C., Balucani, N. 2016, MNRAS Letter, 459, 6
- Fedoseev et al. (2015) Fedoseev, G., Cuppen, H. M., Ioppolo, S., Lamberts, T., Linnartz, H. 2017, MNRAS, 448, 1288
- Fourikis et al. (1974) Fourikis, N., Takagi, K., & Morimoto, M. 1974, ApJL, 191, L139
- Fuente et al. (2014) Fuente, A. et al. 2014, A&A, 568, 65
- Garrod & Herbst (2006) Garrod, R. T. & Herbst, E. 2006, A&A, 457, 927
- Garrod et al. (2008) Garrod, R. T., Weaver, S. L. W., Herbst, E. 2008, ApJ, 682, 283
- Geppert et al. (2006) Geppert, W. D. et al. 2006, Faraday Discussion, 133, 177
- Ginsburg et al. (2016) Ginsburg, A. et al. 2016, A&A, 586, 50
- Gong et al. (2015) Gong, Y. et al. 2015, A&A, 581, 48
- Halfen et al. (2006) Halfen, D.T., Apponi, A.J., Woolf, N., Plot, R., Ziurys, L.M. 2006, A&A, 639, 237
- Halfen et al. (2013) Halfen, D.T., Ilyushin, V.V. & Ziurys, L. M. 2013, ApJ, 767, 66
- Halfen, Woolf & Ziurys (2017) Halfen, D.T., Woolf, N. & Ziurys, L.M. 2017, ApJ, 845, 158
- Herbst & van Dishoeck (2009) Herbst, E., van Dishoeck, E. F. 2009, ARA&A, 47, 427
- Hollis et al. (2000) Hollis, J. M., Lovas, F. J. & Jewell, P. R. 2000, ApJ, 540, L107
- Hollis et al. (2001) Hollis, J. M., Vogel, S. N., Snyder, L. E., Jewell, P. R. & Lovas, F. J. 2001, ApJ, 554, L81
- Hollis et al. (2002) Hollis, J. M., Lovas, F. J., Jewell, P. R. 2002, ApJ, 571, L59
- Hollis et al. (2004) Hollis, J. M., Jewell, P. R., Lovas, F. J., Remijan, A. 2004, ApJ, 613, L45
- Jaber et al. (2014) Jaber, A. A., Ceccarelli, C., Kahane, C. & Caux, E. 2014, ApJ, 791, 29
- Jiménez-Serra et al. (2016) Jiménez-Serra, I. et al. 2016, ApJ, 830, L6
- Jones et al. (2008) Jones, P. A., Burton, M. G., Cunningham, M. R., et al. 2008, MNRAS, 386, 117
- Jones et al. (2011) Jones, P. A., Burton, M. G., Tothill, N.F.H. & Cunningham, M. R. 2011, MNRAS, 411, 2293
- Jørgensen et al. (2016) Jørgensen, J. K. et al. 2016, A&A, 595, 117
- Kaifu et al. (1974) Kaifu, N., Morimoto, M., Nagane, K., et al. 1974, ApJL, 191, L135
- Kaifu et al. (1975) Kaifu, N., Takagi, K., & Kojima, T. 1975, ApJL, 198, L85
- Kauffman et al. (2017) Kauffmann, J. et al. A&A, 2017, A&A, 603, 89
- Kuan et al. (1996) Kuan, Y.-J., Mehringer, D. M., Snyder, L. E., 1996, ApJ, 459, L619
- Lee et al. (2009) Lee, C.-W., Kim, J.-K., Moon, E.-S., Minh, Y. C., & Kang, H. 2009, ApJ, 697, 428
- Lefloch et al. (2017) Lefloch, B., Ceccarelli, C., Codella, C. et al. 2017, MNRAS Letter, 469, 73
- Li et al. (2017) Li, J., Shen, Z.Q., Wang, J.Z. et al. 2017, ApJ, 849, 115
- Lovas (2004) Lovas, F.J. 2004, J.Phys.Chem., 33, 177
- Lykke et al. (2015) Lykke, J. M., Favre, C., Bergin, E. A., Jørgesen, J. K. 2015, A&A, 582, 64
- Martín-Pintado et al. (2001) Martín-Pintado, J., Vicente, P. De, Rodríguez-Fernández, N. J., & Fuente, A. 2001, ApJ, 548, L65
- McGuire et al. (2016) McGuire, B. A. et al. 2016, Science, 352, 1449
- Meinert et al. (2016) Meinert, C. et al. 2016, Science, 352, 208
- Menten (2011) Menten, K. M. 2011, ISTP, To apper in the Proceedings of the 4th Cologne-Bonn-Zermatt-Symposium "The Dense Interstellar Medium in Galaxies" eds. S. Pfalzner, C. Kramer, C. Straubmeier, & Heithausen (Springer: Berlin), 241, 27
- Miao et al. (1995) Miao, Y., Mehringer, D. M., Kuan, Y. -J. & Snyder, L. E. 1995, ApJ, 445, 59
- Miao & Snyder (1997) Miao, Y. & Snyder, L. E. 1997, ApJ, 480, L67
- Millar et al. (1988) Millar, T. J., Brown, P. D., Olofsson, H., & Hjalmarson, H. A. 1988, A&A, 205, L5
- Motiyenko et al. (2014) Motiyenko, R. A., Ilyushin, V.V., Drouin, B. J., Yu, S. & Margulès, L. 2014, A&A, 563, 137
- Müller et al. (2005) Müller, H. S. P., Schloder, F., Stutzki, J., & Winnewisser, G. 2005, JMoSt, 742, 215
- Öberg et al. (2009) Öberg, K. I., Garrod, R. T., van Dishoeck, E. F. , Linnartz, H. 2009, A&A, 504, 891
- Palau et al. (2017) Palau, A. et al. 2017, MNRAS, 467, 2723
- Pickett et al. (1998) Pickett, R.L. et al. 1998, J. Quant. Spectrosc. & Rad. Transfer, 60, 883
- Polehampton et al. (2005) Polehampton, E.T., Baluteau, J.-P., Swinyard, B.M. 2005, A&A, 437, 957
- Qin et al. (2010) Qin, S. L., Wu, Y. F., Huang, M. H. et al. 2010, ApJ, 711, 399
- Reid et al. (2004) Reid, M.J. et al. 2014, ApJ, 783, 130
- Redondo et al. (2015) Redondo, P.A., Largo, A. & Barrientos, C. 2015, A&A, 579, 125
- Requena-Torres et al. (2006) Requena-Torres, M. A. et al. 2006, A&A, 455, 971
- Requena-Torres et al. (2008) Requena-Torres, M. A., Martín-Pintado, J., Martín, S., Morris, M. R. 2008, ApJ, 672, 352
- Rivilla et al. (2018) Rivilla, V. M., Jiménez-Serra, I., Zeng, S., Martín, S., Martín-Pintado, J. et al. 2018, MNRAS, 475, L30
- Rivilla et al. (2019) Rivilla, V. M., Martín-Pintado, J., Jiménez-Serra, I., Zeng, S., Martín, S. et al. 2019, MNRAS, 483, L114
- Rong et al. (2015) Rong, J. L., Qin, S. L., Zapata, L. A. et al. 2015, MNRAS, 455, 1428
- Sánchez-Monge et al. (2017) Sánchez-Monge, Á, Schilke, P., Schmiedeke, A., Ginsburg, A., Cesaroni, R. et al. 2017, A&A, 604, 6
- Sandford et al. (1991) Sandford, S. A. et al. 1991, MNRAS, 371, 607
- Sharma et al. (2016) Sharma, M. K., Sharma, A. K., Sharma, M., Chandra, S. 2016, New Astronomy, 45, 45
- Skouteris et al. (2018) Skouteris, D., Balucani, N., Ceccarelli, C. et al. 2018, ApJ, 854, 135
- Snyder, Kuan & Miao (1994) Snyder, L. E., Kuan, Y. -J., Miao, Y. 1994, LNP, 439, 187
- Snyder et al. (2005) Snyder, L. E. et al. 2005, ApJ, 619, 914
- Taquet et al. (2015) Taquet, V. et al. 2015, ApJ, 804, 81
- Turner et al. (1989) Turner, B. E. 1989, ApJS, 70, 539
- Vasyunin & Herbst (2013) Vasyunin, A. I. & Herbst, E. 2013, ApJ, 769, 34
- Widicus Weaver et al. (2017) Widicus Weaver, S. L., Laas, J. C., Zou, L.Y. et al. 2017, ApJ, 232, 3
- Woods et al. (2013) Woods, P.M. et al. 2013, ApJ, 777, 90
- Xue et al. (2019) Xue, C., Remijan, A. J., Burkhardt, A. M. & Herbst, E. 2019, ApJ, 871, 112
- Zuckerman et al. (1975) Zuckerman, B. et al. 1975, ApJ, 196, L99