Ammonia in circumstellar environment of V Cyg
The HIFI instrument on board of the Herschel Space Observatory (HSO) has been very successful in detecting
molecular lines from circumstellar envelopes around evolved stars, like massive red supergiants,
Asymptotic Giant Branch (AGB) and post-AGB stars, as well as planetary nebulae. Among others, ammonia has
been found in circumstellar envelopes of C-rich AGB stars in amounts that significantly exceeded
theoretical predictions for C-rich stars. Few scenarios have been proposed to resolve this problem: formation
of ammonia behind the shock front, photochemical processes in the inner part of the envelope partly
transparent to UV background radiation due to the clumpy structure of the gas, and formation of ammonia on
dust grains. Careful analysis of observations may help to put constraints on one or another mechanism of
ammonia formation.
Here, we present results of the non-LTE radiative transfer modeling of ammonia
transitions including a crucial process of radiative pumping via v2 = 1 vibrational band (at 10 m)
for V Cyg.
Only ground-based
ammonia transition NH3 J = 10 - 00 at 572.5 GHz has been observed by HIFI. Therefore, to determine abundance of ammonia
we estimate a photodissociation radius of NH3 using chemical model of the envelope consistent with dust grain properties concluded from the spectral energy distribution.
Key words: AGB stars, C-rich stars, ammonia
1Nicolaus Copernicus Astronomical Center, Polish Academy of
Sciences, ul. Rabiańska 8, 87-100 Toruń, Poland
introduction
Ammonia () was discovered in space in 1968 [3] and its first transition was detected at with radiotelescope. Ammonia is mostly observed in interstellar medium [12], and commonly in star forming regions (see e.g. [11], [13], [29]). However, ammonia is also detected in the cricumstellar envelopes of evolved stars (see, e.g. [23] for analysis of ammonia in Asymptotic Giant Branch (AGB) star CW Leo). The Asymptotic Giant Branch stage of stellar evolution is characteristic for stars with initial mass between 1-8 M⊙, that is for stars with low-to-intermediate initial mass, and is characterized by intense mass-loss processes. The AGB stars can be divided into two main types: C-rich and O-rich ones. The C-rich AGB stars contain more carbon than oxygen atoms, i.e. C/O > 1. V Cyg itself belongs to this group of objects. V Cyg is Mira type variable with period of about 417 days, C6 spectral type [30] and a distance of 420 pc [31]. The central star has low effective temperature (2000-3000K). The star in this phase of evolution has very weak gravitational force in the stellar atmosphere and changes periodically its radius, temperature and luminosity. Pulsations are responsible for the dust formation in the outer layers of the atmosphere, and then radiation pressure on dust can initiate the ejection of material form the atmosphere into space. Mater ejected from the star forms Circumstellar Envelope (CSE) around the star, where new molecules, like for example ammonia, are formed. The observed abundance of the NH3 is several magnitudes larger than models of stellar atmosphere for AGB stars predict (e.g. [14]). The formation process of ammonia is unknown. The two scenarios have been proposed for ammonia formation in CSE. In the first scenario ammonia may be formed by passage of shocks. In this scenario N2 molecules have been dissociated and atoms of nitrogen are available to form the ammonia molecule [32]. Unfortunately, the last calculations have been shown that this process change the abundance of NH3 only marginally [9]. The second mechanism is dissociation of N2 by the UV radiation because of the CSE is inhomogeneous and the UV radiation may penetrate almost through the whole envelope [5].
In Section 2 we present the description of the molecular model of ammonia. The observations and data reductions are described in Section 3. Section 4 is devoted to description of modelling process of ammonia lines in CSE of V Cyg. At the last, in Section 5 we discuss results of our modelling.
Model of ammonia
Ammonia molecule exists in two species: ortho and para. These two species differ in the orientations of the three hydrogen spins. Symmetry properties of the ro-vibrational (including inversion) levels are described by the symmetry group (C3v if the inversion mode is neglected). Because of the Pauli exclusion principle, the ro-vibrational levels must belong to and (para states) and and (ortho states) representations of [2]. Ammonia oscillates in six vibrational modes, of which two pairs are degenerate, and which are described by the four quantum vibrational numbers (, , , ) and the two vibrational angular momentum l3, and l4.
Ammonia molecule has inversional nature. It is because the potential energy surface has double minimum corresponding to two positions of the nitrogen atom on opposite sides of the plane defined by hydrogen atoms. The molecule may change rapidly its geometry, because its potential barrier between the two minima is small and equal ( ). In this case energy levels are not strongly separated and wavefunctions mix together resulting in two kinds of levels: symmetric (s, +) and antisymmetric (a, -) [1].
For calculations of excitation of a molecule in circumstellar envelope one needs the input file containing the list of adopted energy levels, list of radiative transitions between energy levels and the set of collisional rates. For limited number of levels the input file is available in the database LAMDA (https://home.strw.leidenuniv.nl/~moldata, [6], [20]). Hereby, we followed Schmidt et al. (2016) and the set of levels extracted from the theoretical EXOMOL database (http://exomol.com,[28]) has been used. The advantage of using computed database instead of laboratory is its completeness.
Data
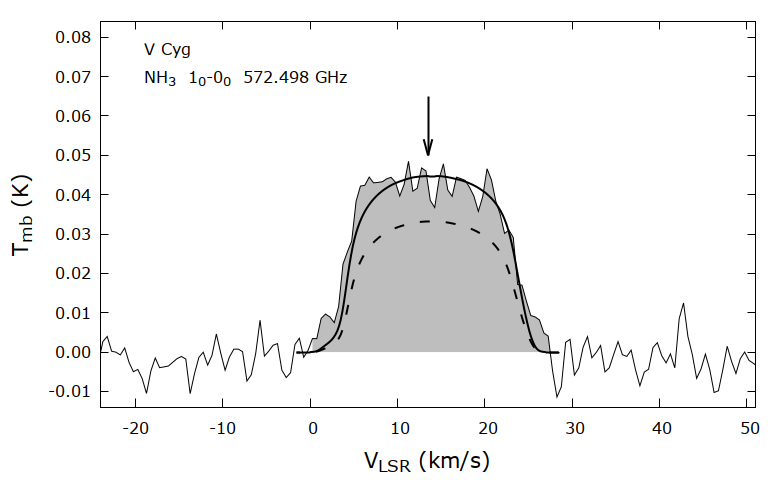
Observations of V Cyg were obtained with the HIFI (Heterodyne Instrument for the Far Infrared) instrument on board of the HSO (Herschel Space Observatory) in the point mode. The observations were part of the HIFISTARS Guaranteed Time Key Program (Proposal Id: KPGT_vbujarra_1, PI: V.Bujarrabal). Details of available observations are presented in Table 1. For each observations we give spectroscopic designation, frequency of transition in GHz, band of the HIFI instrument, energy of the upper level in K, observational identification of, date of observation, the phase of observation, half power beam with (HPBW) of HIFI instrument, and the main beam efficiency () (Mueller et al. 2014111http://hertwiki.esac.esa.int/twiki/pub/Public/HifiCalibrationWeb/HifiBeamReleaseNote_Sep2014.pdf). The observational phase of variability was determined relative to the reference data of maximum, selected from the visual variability curve (see below) ( 0 for Julian Date 2450330), and assuming variability period of 417 days [22]). Only the ground rotational transition of ortho-NH3 was recorded in two instrumental settings observed at the same time. The reduction of data was conducted using HIPE (v.15.0.1) software222https://www.cosmos.esa.int/web/herschel/hipe-download. The reduction process was limited to extraction of data from level 2, tracing continuum and removing baseline, averaging of two H and V polarizations, and final averaging of two settings. For comparison with theoretical models, the antenna temperature was converted to the main beam temperature using main beam coefficients. The final profile of the 10-00 ortho-ammonia line is shown in Figure 2 on a Doppler velocity scale relative to the Local Standard of Rest VLSR. The root mean square (r.m.s.) in the continuum amounts to 3 mK. The uncertainty of the flux is expected to be less than 10 percent [16].
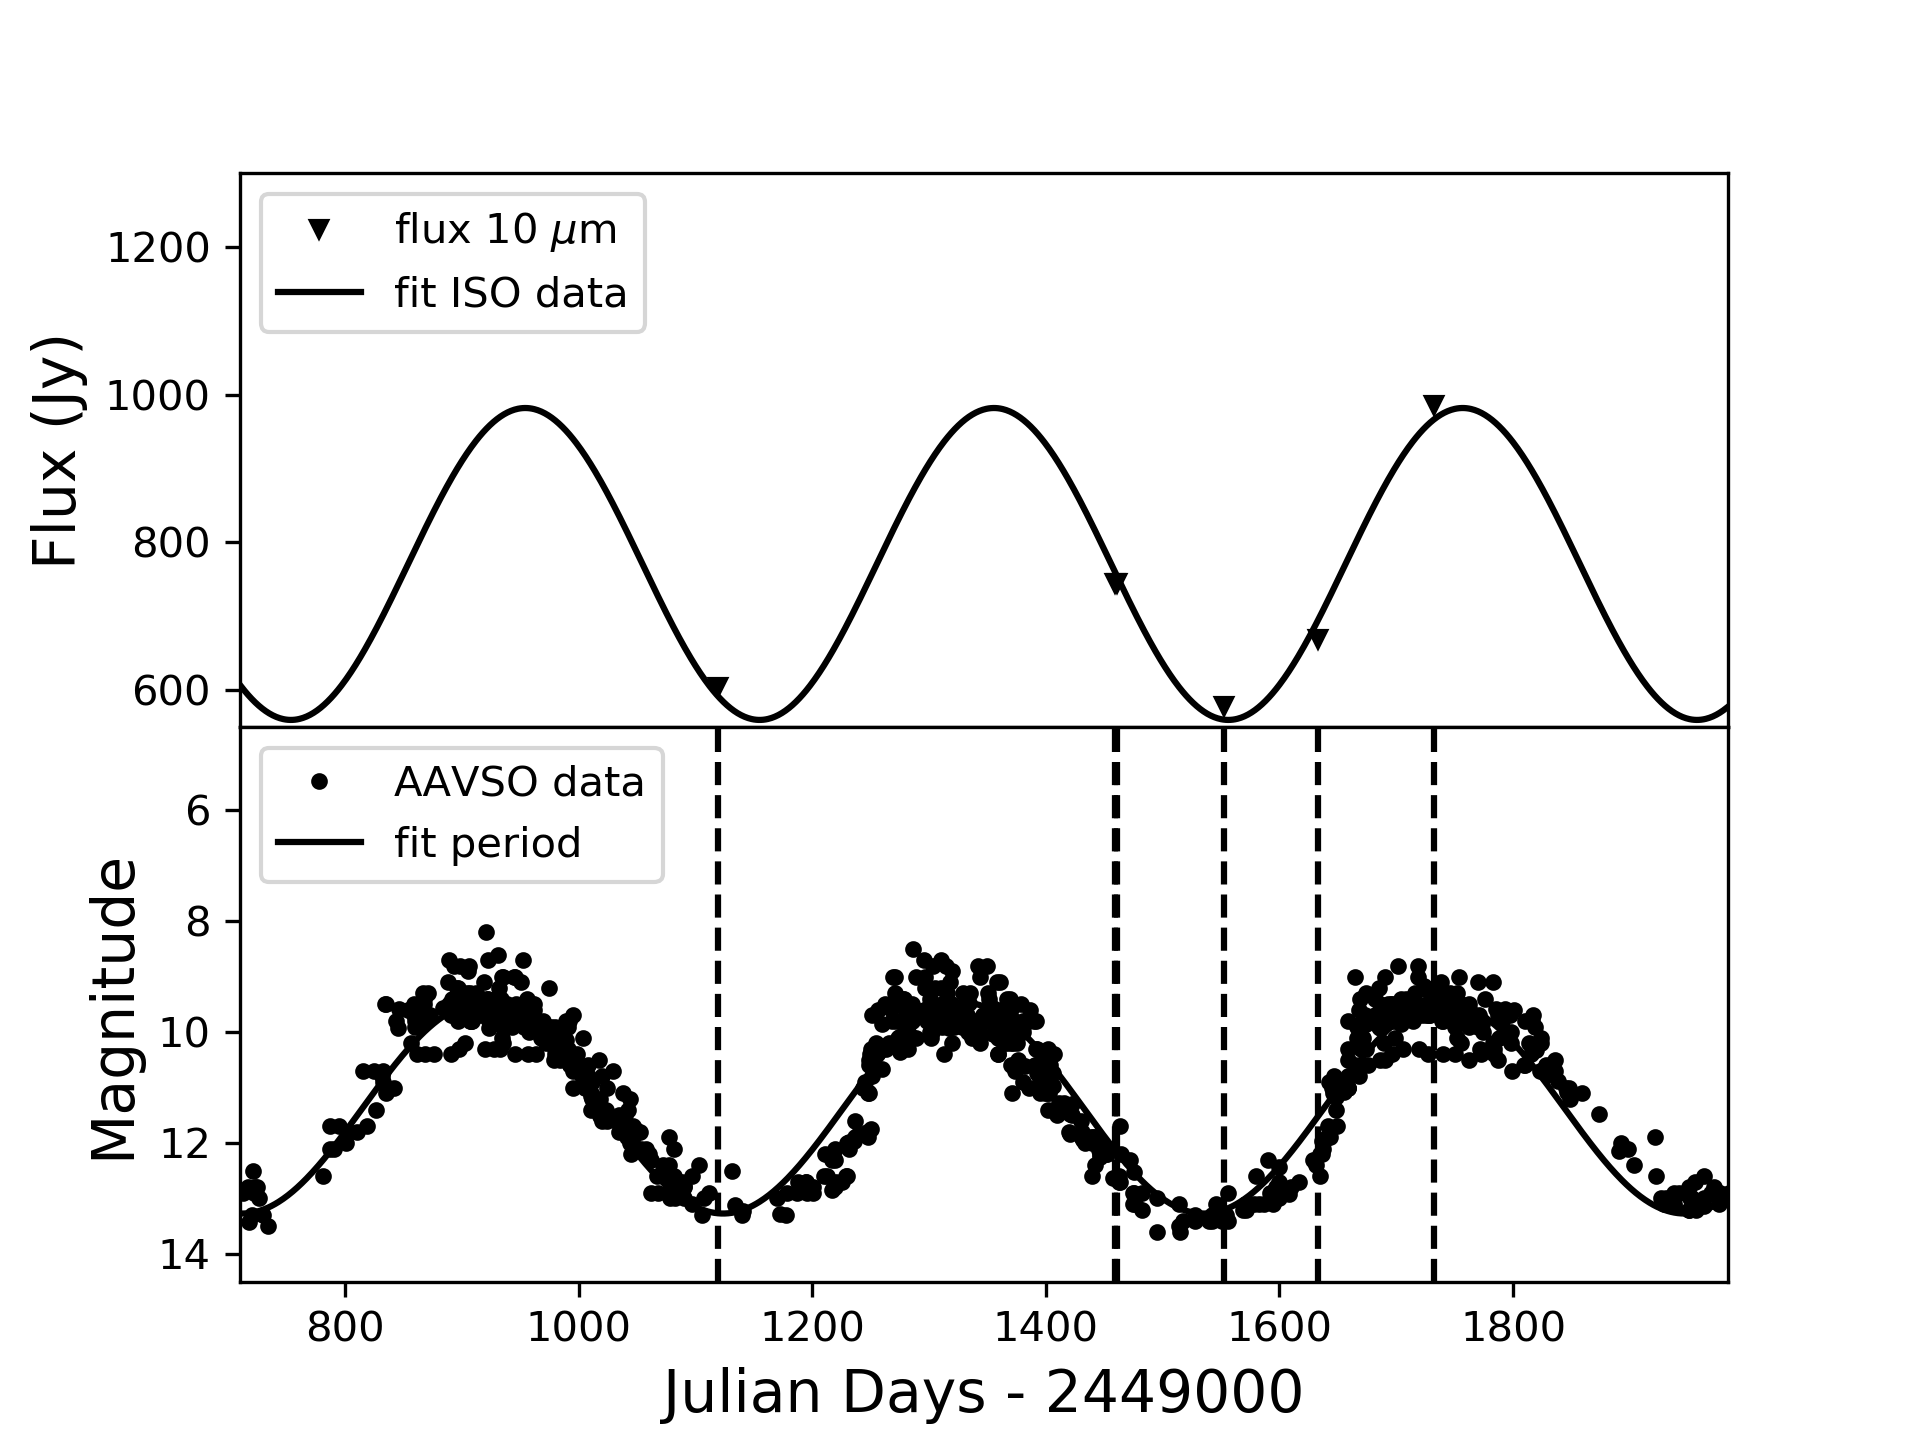
For the analysis of variability we used data available in AAVSO database333https://www.aavso.org/. AAVSO database provides a very long sequence of photometric observations in visual covering both HIFI and ISO periods of observations. Sequence of data covering ISO observations is shown in Figure 2.
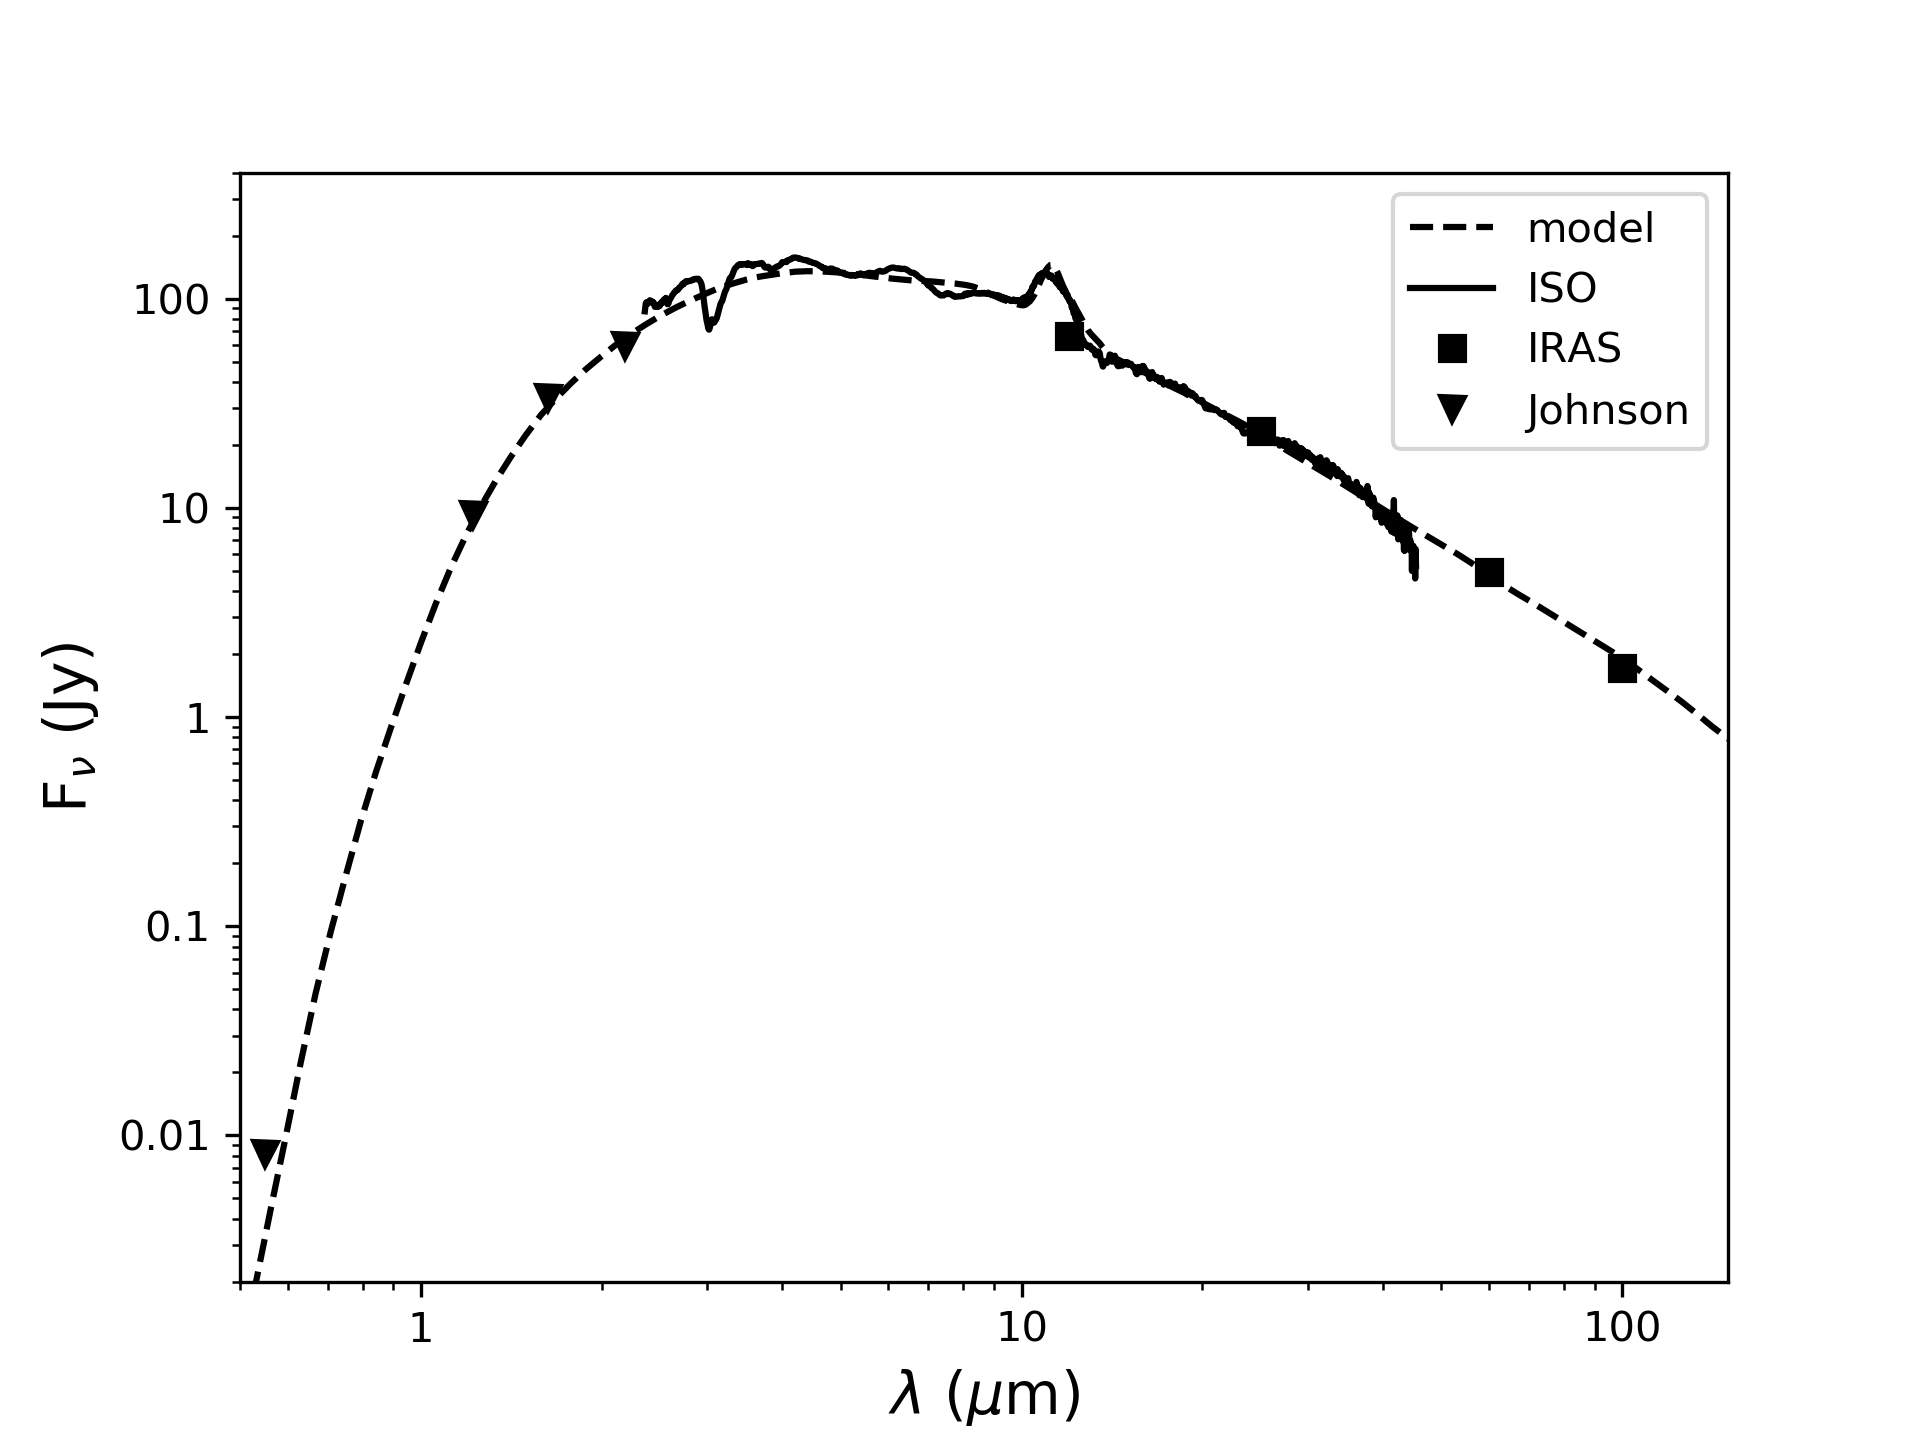
The main source of data for the Spectral Energy Distribution (SED) modelling is atlas of ISO (Infrared Space Observatory) observations available on https://users.physics.unc.edu/~gcsloan/library/swsatlas/aot1.html ([15], [26]). This catalogue includes 1239 full-scan AOT1 spectra from Short Wavelength Spectrometer (SWS). These spectra contain photometric scan between about 2.4 to 45.4 m for each object. All spectra were reduced and ready to use for modelling [26]. In collection of spectra we found six spectral scans of our object (Table 2). One spectral scan was observed at variability phase close to that of HIFI observations (ID = 69500110) and was used for modelling of the SED (Figure 4). Photometry was updated with photometrical measurements of V444http://simbad.u-strasbg.fr/simbad/sim-ref?querymethod=bib&simbo=on&submit=submit+bibcode&bibcode=2002yCat.2237....0D, J, H and K bands ([4], date of observation: 2000-05-04, JD date: 2451668.9397, phase: 0.2)555http://vizier.u-strasbg.fr/viz-bin/VizieR?-source=II/246 and with IRAS measurements for 12, 25, 60 and 100 m666http://vizier.u-strasbg.fr/viz-bin/VizieR-5?-out.add=.&-source=II/125/main,II/126/sources&IRAS==20396%2b4757%2a (in this case the flux reported in the catalogue is average value of the IRAS observations at each band, and the phase is unknown 777https://lambda.gsfc.nasa.gov/product/iras/colorcorr.cfm).
| Transition | Frequency | Band | Eu | Herschel | Obs. date | Phase | HPBW | |
|---|---|---|---|---|---|---|---|---|
| (GHz) | (K) | OBSID | ||||||
| 10(s) - 00(a) | 572.498 | 1b | 29 | 1342199153 | 2010-23-06 | 0.1 | 37.5" | 0.62 |
| 1342199154 | 2010-23-06 | 0.1 | 37.5" | 0.62 |
| Source name | ID | Date | Time of observation (s) | Phase |
|---|---|---|---|---|
| V Cyg | 08001855 | 1996-05-02 | 1044 | 0.49 |
| 42100111 | 1997-10-01 | 1912 | 0.31 | |
| 42300307 | 1997-12-01 | 1913 | 0.31 | |
| 51401308 | 1997-13-04 | 1912 | 0.53 | |
| 59501909 | 1997-03-07 | 1912 | 0.73 | |
| 69500110 | 1997-10-10 | 1912 | 0.99 |
Modelling
The first step in modelling was preparation of the model of the dusty envelope of V Cyg. For that purpose, we used MRT code for a dust radiative transfer [27]. In SED modelling we assumed that the amplitude of luminosity variation is about 40 % relative to the average value deduced from the period-luminosity relation [31] of 6600 L⊙. Such an amplitude was deduced for the similar case for the best examined C-rich star - CW Leo [19]. Hence, in the phase of maximum the obtained luminosity equals 9200 L⊙. The optimal model of the dusty envelope reproduces well observed SED for V Cyg both in the maximum phase (presented on Figure 2) and in the minimum phase. The adopted parameters of the central source and of the dust are presented in Table 3.
| RA (2000) | 20 41 18.27 | Luminosity (mean) | 66002 L⊙ |
| Dec (2000) | +48 08 28.94 | Luminosity (max) | 92004 L⊙ |
| Period | 417 days1 | Luminosity (min) | 40004 L⊙ |
| Distance | 420 pc2 | Teff,max | 25004 K |
| Vexp | 11.5 km s-1 3 | Teff,min | 20004 K |
| VLSR | 13.5 km s-1 6 | f(ortho-NH3) | 3.3 10-6 4 |
| Rphot | 1.5 1016 cm | f(NH3) | 6.6 10-6 4 |
| Mloss | 1.7 10-6 M⊙ yr-1 5 |
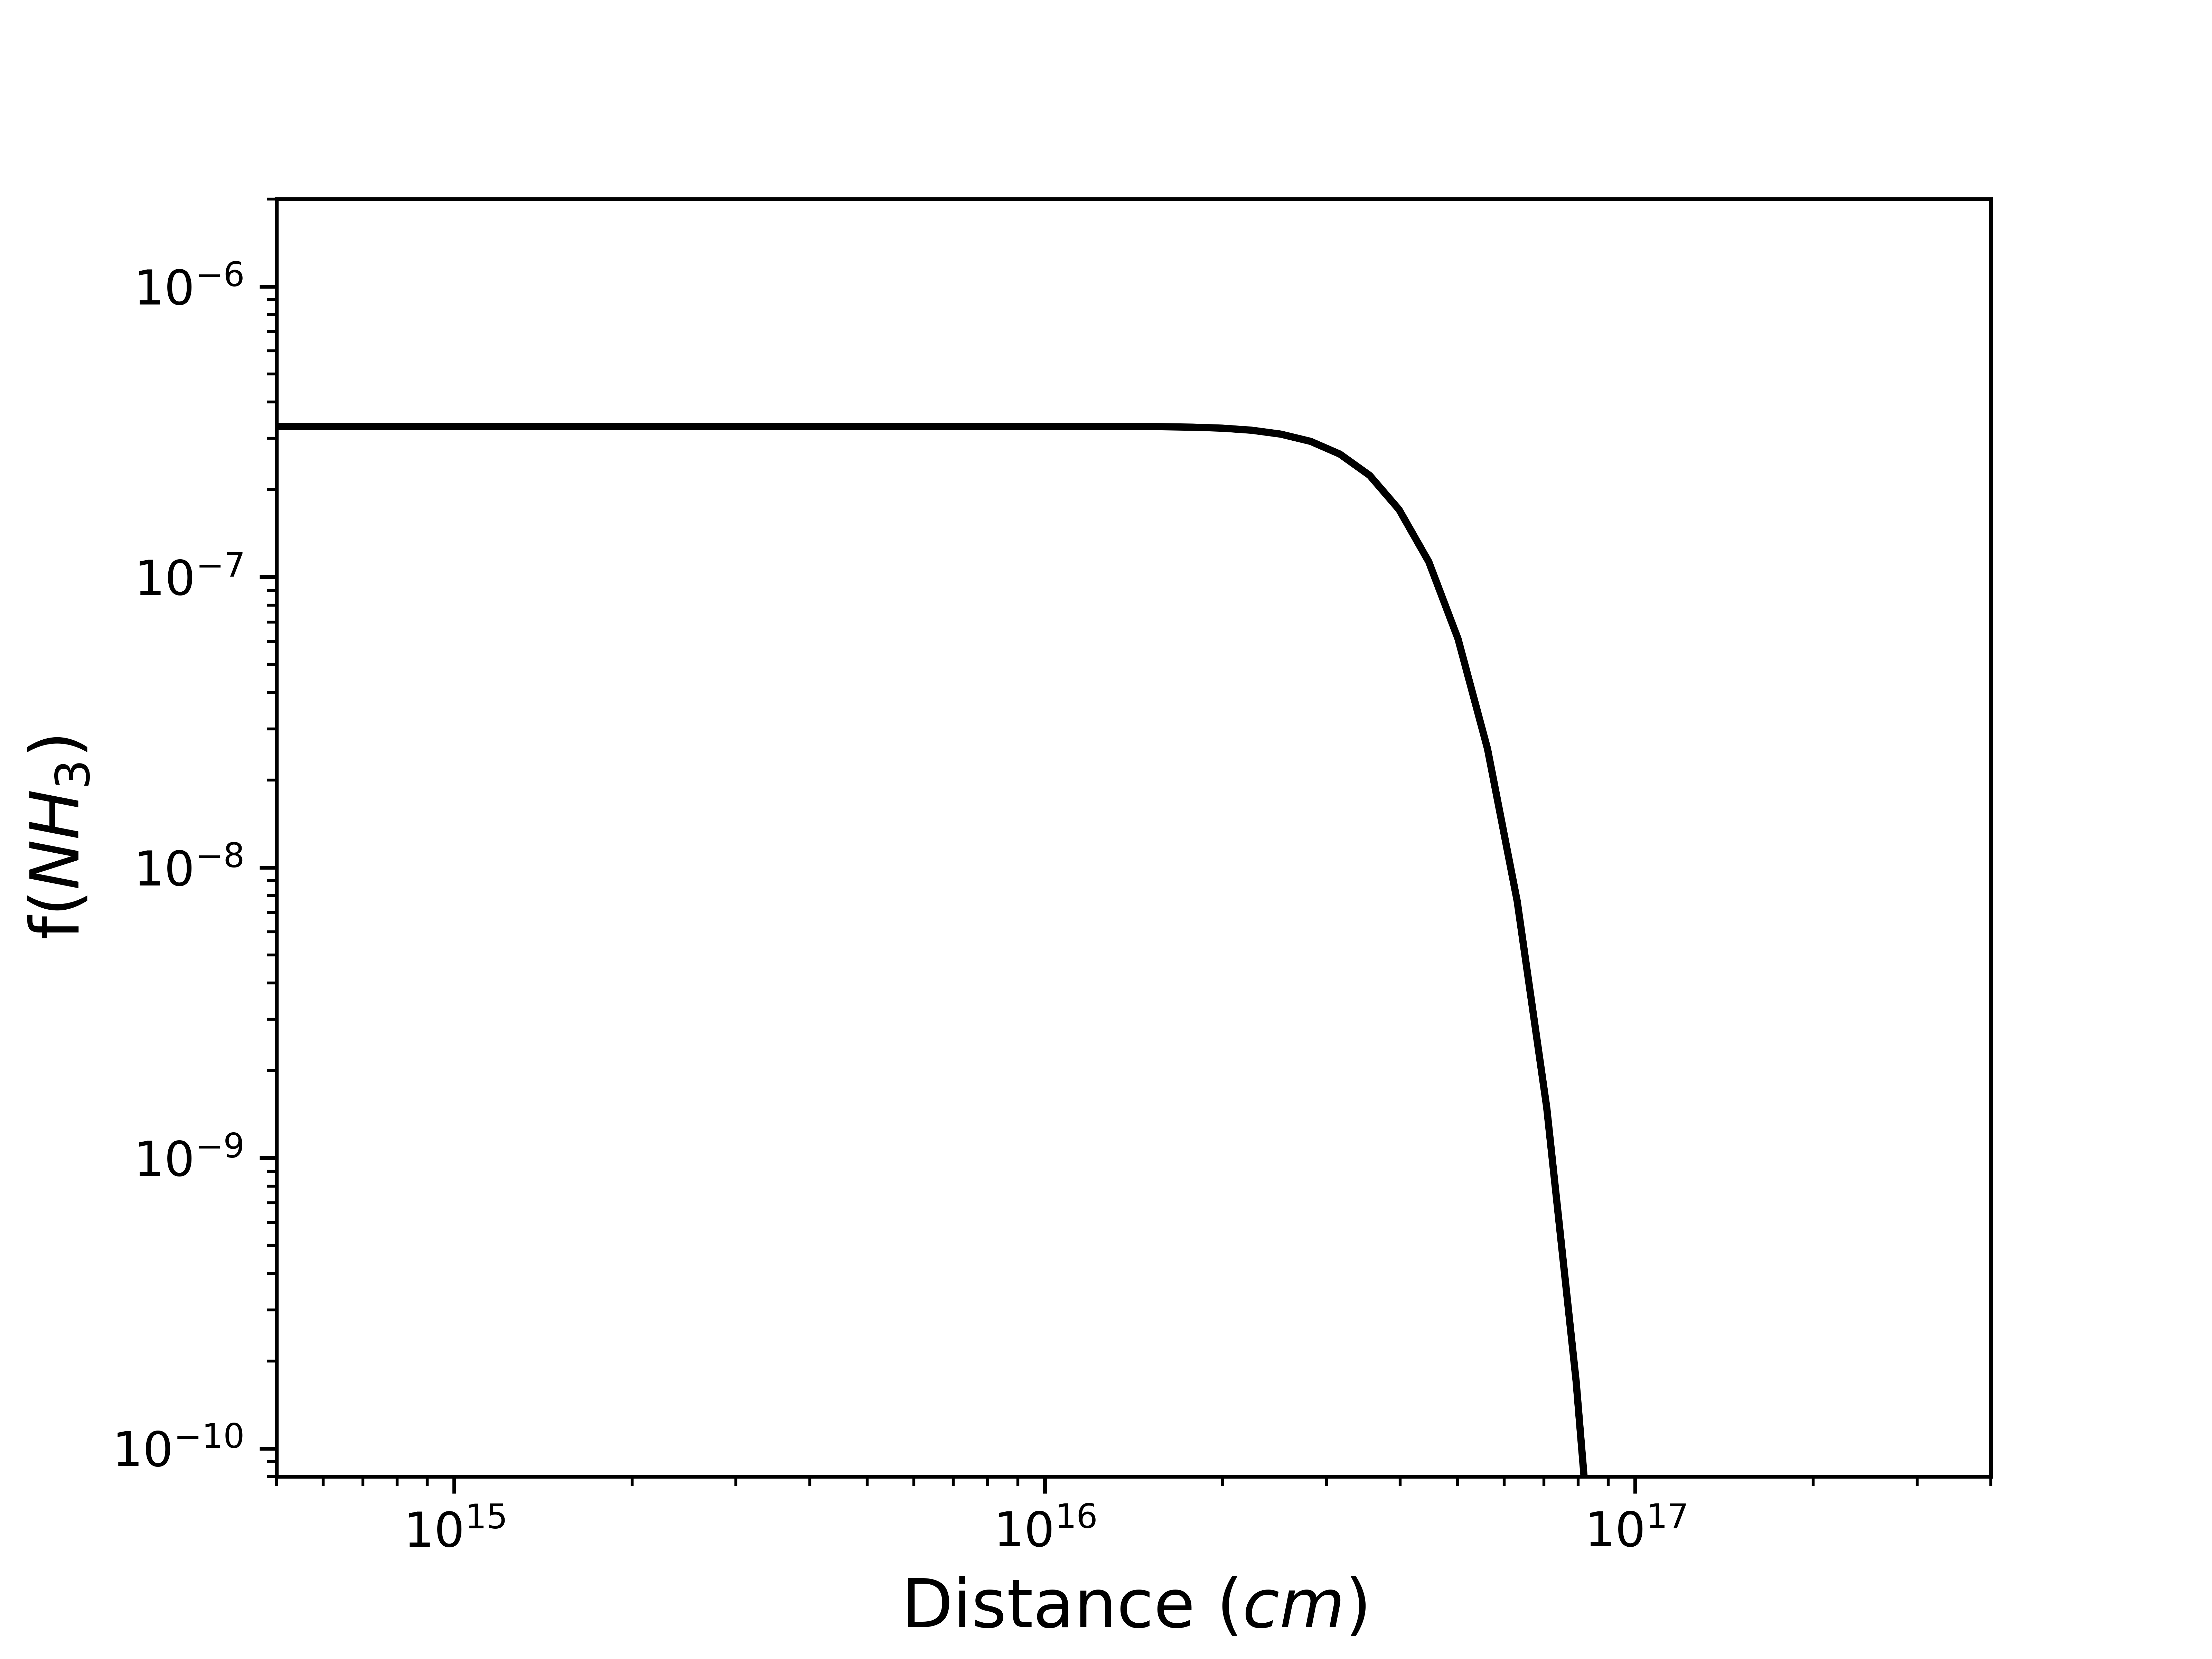
The optical properties of the dust obtained from the SED modelling were used to calculate the photodissociation radius of ammonia. For that purpose, we used CSENV (CircumStellar ENVelopes) code for the calculations of chemistry in expanding envelope [7]. The chemical contents of the input was restricted to ammonia and products of its photodissociation. The photodissociation radius, Rph is defined as the radius at which the initial abundance of ammonia drops twice. In our calculations we have used the latest cross-section rates of ammonia molecules [10]. In case of V Cyg we obtained value of 1.5 1016 cm (for the mass loss rate 1.7 10-6 M⊙ yr-1 and expansion velocity V 11.5 km s-1). Applying the same approach to analysed earlier CW Leo [23], we found theoretical Rph equal to 4 1016 cm, close to the value obtained observationally of 3.5 1016 cm for the rotational transitions of ortho-NH3 (2.0 1016 cm suggested by inversional transitions). We estimate that the uncertainty of the theoretical value may be of factor 2.
For modelling of ammonia lines we used a radiative transfer code MOLEXCSE (Molecular Line EXcitation in CircumStelar Envelope) code. This code solves the non-LTE radiative transfer in molecular lines in presence of the continuum. The code reproduces well flux in continuum for the absorption, scattering and emissivity provided by MRT code. The density structure of the gas envelope is determined by the assumed mass loss rate and constant expansion velocity. The gas kinetic temperature distribution in the envelope of V Cyg was determined by finding the best fit to CO emission lines including both radio, milimeter and sub-milimeter HIFI transitions ([21]).
The model of ortho-ammonia molecule includes 172 levels (all the ground vibrational and the first excited bending mode =1 levels with J 15), 1579 radiative transitions and collisional excitation by H2. For the details of treatment of collisional rates see [23]. Inclusion of the rovibrational transitions (about 10 m) is of key importance for the proper modelling of excitation of ammonia in circumstellar envelope (see e.g. [23]).
Result and conclusion
For adopted parameters the abundance of ortho-NH3 molecules in V Cyg star in maximum phase which reproduces at best observed line profile amounts to 3.3 10-7 relative to the molecular hydrogen. The resulting theoretical profile is shown on Figure 4 with the black line. The computed profile seems to reproduce very well almost flat top shape of the observed transition.
To illustrate expected variability in line profile, we computed the theoretical profile of 10-00 transition also from the minimum phase, using abundance determination in the maximum phase. The resulting profile is presented on Figure 4 by means of the dotted line. In that case we used ISO data in the minimum phase (ID: 08001855, phase: 0.49). For the model of the SED in the phase of minimum, we adopted central star luminosity to be equal 4000 L⊙ and the temperature to be 2000 K. The brightness of the 572.498 GHz line is then reduced by 40 % relative to its maximum.
No observations of para-ammonia are available for V Cyg. If ortho-to-para ratio corresponds to the equilibrium conditions at higher temperatures, i.e. it is equal to one, then the total amount of ammonia in the envelope of V Cyg is 6.6 10-7. The abundance of ammonia in the archetypical C-rich AGB star IRC+10216 amounts 6 10-8 [23] for the adopted there mass loss rate of 3.25 10-5 M⊙ yr-1. Thus, within uncertainties one may conclude that mass production rate of ammonia in envelopes of both objects is similar despite significantly different gas densities. If photochemical reactions would be responsible for the production of ammonia in the envelopes of C-rich AGB stars, then higher abundance of ammonia in V Cyg could be explained by the higher probability that UV photons may penetrate into inner parts of the envelope while its density is smaller. The analysis of other 6 objects in the sample, now under consideration, will reveal if that expectations will be confirmed.
acknowledgement
We acknowledge support from the grant 2016/21/B/ST09/01626 of the National Science Centre, Poland.
references
- [1] Bernath P. F. 2005, ‘Spectra of atoms and molecules’, Oxford University Press, New York
- [2] Bunker P. R. & Jensen P. 2006, National Research Council of Canada, 1, 496-502
- [3] Cheung A. C., Rank D. M., Townes C. H. et al. 1968, Physical Review Letters, 21, 1701-1705
- [4] Cutri R. M., Skrutskie M. F., van Dyk S., Beichman C. A. Carpenter J. M. et all 2003, II/246
- [5] Decin L., Agúndez M., Barlow M. J., Daniel F., Cernicharo J., Lombaert R., De Beck, et all. 2010, Nature, 467, 64
- [6] Danby, G., Flower D. R., Valiron P. et al., 1988, MNRAS, 229-238
- [7] Glassgold A. E., Lucas R., Omont A. 1986, A&A, 157, 35-48
- [8] Glassgold A. E., Mamon G. A., Omont A. et al. 1987, A&A, 183-190
- [9] Gobrecht D., Cherchneff I, Sarangi A., Plane J. M. C., Bromley S. T. 2016, A&A, 585, A6
- [10] Heays A. N., Bosman A. D., van Dishoeck E. F. 2017, 602, 1-72
- [11] Harju J., Walmsley C. M., Wouterloot J. G. A. 1993, A&AS, 98, 51
- [12] Ho P. T. P. & Townes C. H. 1983, ARA&A, 21, 239
- [13] Jijina J., Myers P. C., Adams F. C. 1999, APjS, 125, 161
- [14] Johnson H. R., Sauval A. J. 1982, A&A, 49, 77
- [15] Kraemer K. E., Sloan G. C., Price S. D., Walker H., J., AphJ, 140, 389-406
- [16] Roelfsema P. R., Helmich F. P., Teyssier D. et al., 2012, A&A, 537, A17
- [17] Massalkhi S., Agúndez M., Cernicharo J., Velilla Prieto L., Goicoechea J. R. 2018, 611, A29
- [18] Mamon G. A., Glassgold A. E., Huggins P. J. 1988, AphJ, 328, 797-808
- [19] Men’shchikov A. B., Balega Y., Blöcker T., Osterbart R., Weigelt G. 2001, ApJ, 368, 497-526
- [20] Maret S., Faure A., Scifoni E.et al., 2009, MNRAS, 425-431
- [21] Neufeld D. A., González-Alfonso, E., Melnick, G. et al., 2010, A&A, 521, L5
- [22] Samus N. N., Kazarovets E. V., Pastukhova E.,N. et al., 2009, AphJ, 121, 1378
- [23] Schmidt M. R., He J. H., Szczerba R. et al. 2016, A&A, 592, A131
- [24] Schmidt M. R., Szczerba R., 2019
- [25] Schöier F. L., Ramstedt S., Olofsson H. et al., 2013, A&A, 550, A78
- [26] Sloan G. C., Kramear K A, Price S. D., Shipman R. F, 2003, ApJS, 147, 37
- [27] Szczerba R., Omont A., Volk K., Cox P., Kwok S. 1997, 317, 859-870
- [28] Tennyson J., Yurchenko S. N., Al-Refaie A. F. et al. 2016, 327, 73-94
- [29] Wienen M., Wyrowski F., Schuller F. et al., 2012, A&A, 544, A146
- [30] Wallerstein G. & Knapp G. R. 1998, Annual Review of Astronomy and Astrophysics, 36, 369-434
- [31] Whitelock P. A., Feast M. W., Van Leeuwen F., 2008, MNRAS, 386, 313-323
- [32] Willacy K., & Cherchneff I. 1998, A&A, 330, 676