Binding and segregation of proteins in membrane adhesion: Theory, modelling, and simulations
Abstract
The adhesion of biomembranes is mediated by the binding of membrane-anchored receptor and ligand proteins. The proteins can only bind if the separation between apposing membranes is sufficiently close to the length of the protein complexes, which leads to an interplay between protein binding and membrane shape. In this article, we review current models of biomembrane adhesion and novel insights obtained from the models. Theory and simulations with elastic-membrane and coarse-grained molecular models of biomembrane adhesion indicate that the binding of proteins in membrane adhesion strongly depends on nanoscale shape fluctuations of the apposing membranes, which results in binding cooperativity. A length mismatch between protein complexes leads to repulsive interactions that are caused by membrane bending and act as a driving force for the length-based segregation of proteins during membrane adhesion.
Keywords
cell adhesion; membrane bending energy; membrane shape fluctuations; protein binding; binding cooperativity
1 Introduction
Cell adhesion and the adhesion of vesicles to the biomembranes of cells or organelles are central processes in immune responses, tissue formation, and cell signaling [1]. These processes are mediated by a variety of receptor and ligand molecules that are anchored in the membranes. Biomembrane adhesion is inherently multivalent – the two apposing membranes contain numerous receptors and ligands and adhere via numerous receptor-ligand complexes, which “clamp” the membranes together. A striking feature are the largely different length scales from nanometers to micrometers involved in cell adhesion. Cells have typical diameters of tens of micrometers, but the separation of the apposing membranes in equilibrated cell adhesion zones is only about 15 to 40 nanometer [2]. For typical concentrations of receptor-ligand complexes of the order of , the average separation between neighboring complexes is of the order of nm. The membrane shape and shape fluctuations between neighboring receptor-ligand complexes are then dominated by the bending energy of the membranes with bending rigidity . On length scales of several hundred nanometers or microns, in contrast, the shape of cell membranes is dominated by the membrane tension and by the membrane-connected actin cortex. The crossover from the dominance of the bending energy on small length scales to the dominance of membrane tension and actin cortex on large scales depends on the characteristic mesh size of the actin cortex of about 50 to 100 nm [3, 4, 5] and on the characteristic length . For typical values of the bending rigidity of lipid membranes in the range from 10 to 40 [6, 7] and typical tensions of a few [8, 9, 10], the characteristic length adopts values between 100 and 400 nm.
Receptor and ligand molecules anchored in apposing membranes can only bind if the membrane separation at the site of these molecules is sufficiently close to the length of the receptor-ligand complex. Understanding biomembrane adhesion requires therefore an understanding of the interplay between (i) the specific binding of membrane-anchored receptor and ligand molecules and (ii) the membrane shape as well as shape fluctuations between and around the receptor-ligand complexes. This review is focused on theory, modelling, and simulations of the interplay of protein binding and membrane shape in biomembrane adhesion. In chapter 2, we review various models of biomembrane adhesion that differ in their representation of the membranes and of the membrane-anchored receptors and ligands. In elastic-membrane models of biomembrane adhesion, the two adhering membranes are described as discretized elastic surfaces, and the receptors and ligands as molecules that diffuse along these surfaces. In molecular models of biomembrane adhesion, the membrane lipids are captured as individual molecules, either coarse-grained or atomistic, on the same level as the receptors and ligands. Finally, multiscale modelling combines detailed molecular modelling of individual receptor-ligand complexes on short length scales with elastic-membrane modelling on large length scales. In chapter 3, we review insights on the binding equilibrium and binding constant of receptors and ligands in membrane adhesion zones obtained from elastic-membrane, coarse-grained molecular, and multiscale modelling. A central result confirmed by recent experiments is the binding cooperativity of membrane-anchored receptors and ligands from membrane shape fluctuations on nanoscales [11, 12, 13]. In chapter 4, we consider the length-based segregation and domain formation of receptor-ligand complexes in membrane adhesion zones. Short receptor-ligand complexes tend to segregate from long receptor-ligand complexes or molecules because the membranes need to curve to compensate the length mismatch, which costs bending energy [14, 15]. The article ends with a summary and outlook.
2 Modelling biomembrane adhesion
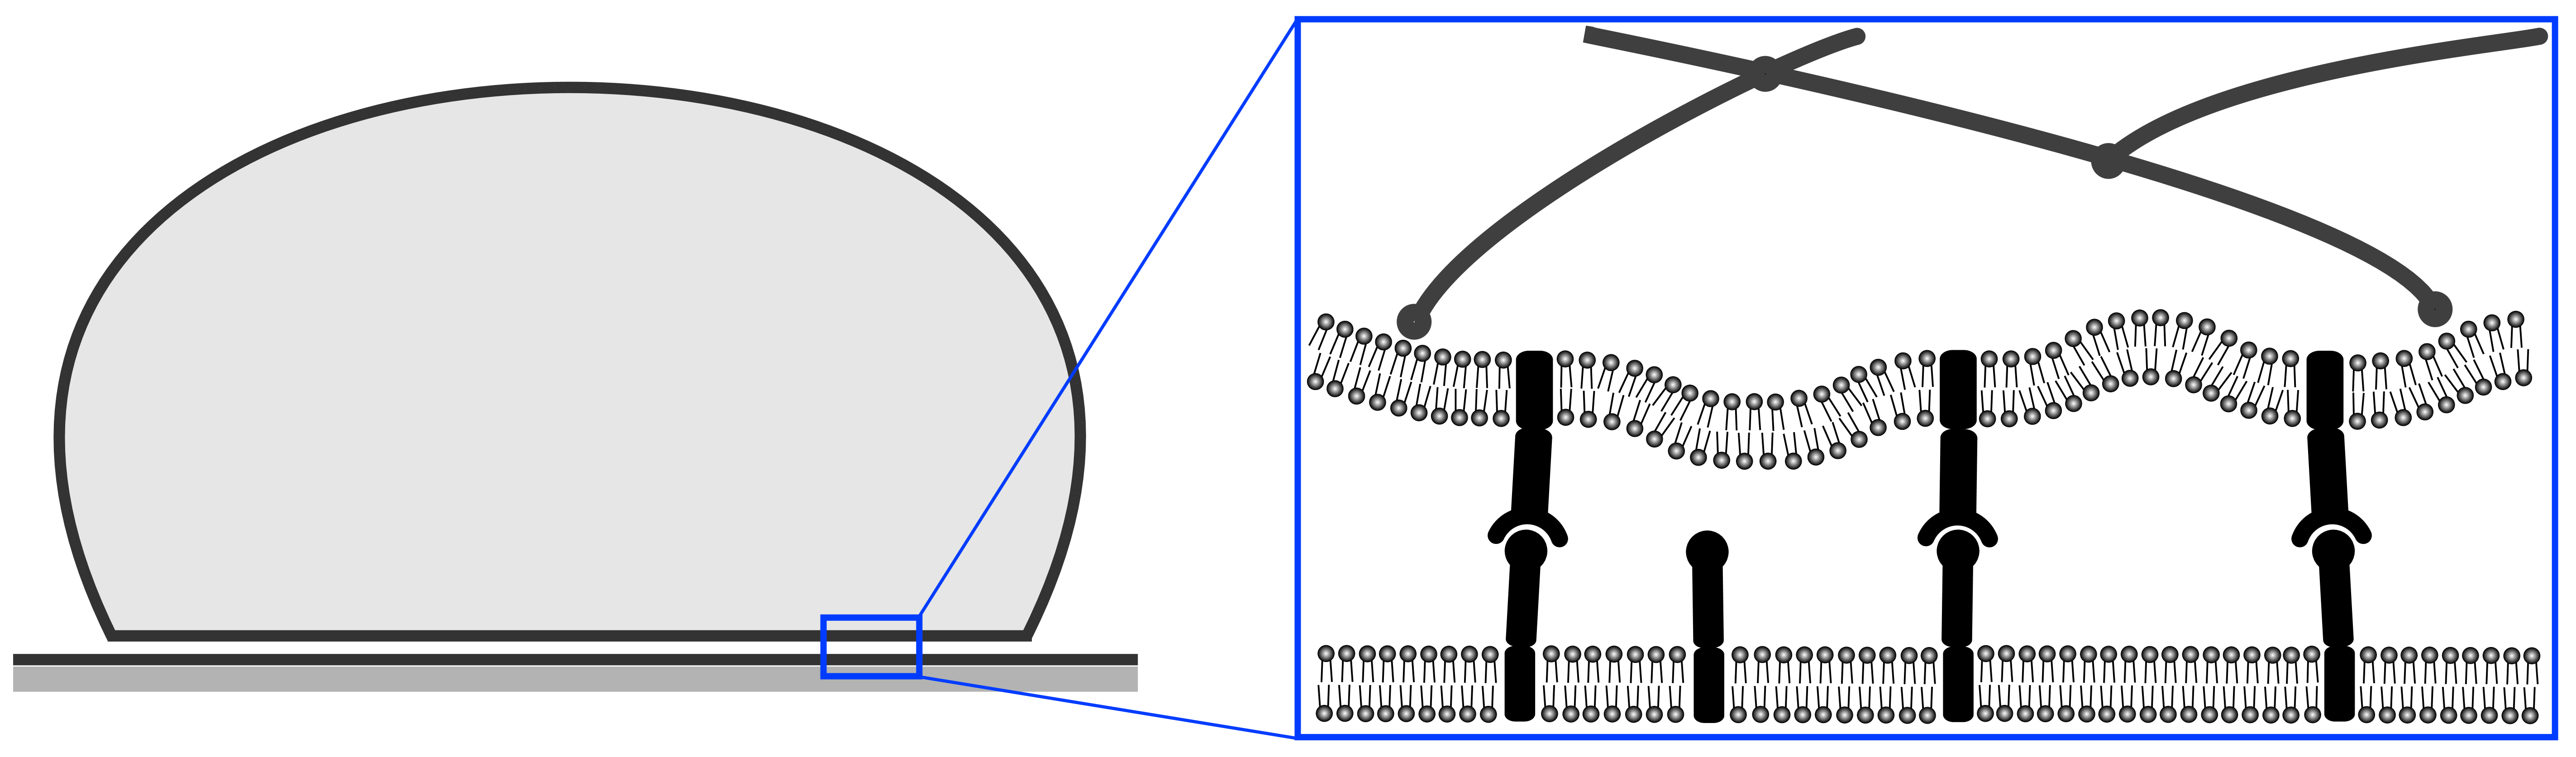
The adhesion of cells or vesicles leads to an adhesion zone in which receptors anchored in the cell or vesicle membrane interact with ligands anchored in the apposing membrane (see Fig. 1). The challenge of modelling biomembrane adhesion is to model the interplay between the binding of these receptors and ligands and the membrane shape and shape fluctuations in the membrane adhesion zone. The theoretical models reviewed here differ in their spatial resolution and describe this interplay for smaller or larger segments of the adhesion zone and for mobile receptors that can diffuse within the membranes and are not strongly coupled to the cytoskeleton of an adhering cell. We first introduce the bending energy of adhering membranes, which is the basis of elastic-membrane and multiscale models of biomembrane adhesion.
2.1 Bending energy of adhering membranes
Biomembranes can be seen as thin elastic shells because their lateral extensions up to micrometers greatly exceed their thickness of a few nanometers. In general, such thin shells can be deformed by shearing, stretching, or bending. Biomembranes are hardly stretchable and pose no shear resistance because of their fluidity. The dominant deformation of biomembranes therefore is bending. The bending energy depends on the local curvature of the membranes, which can be characterized by the two principal curvatures and , or alternatively by the mean curvature and Gaussian curvature . The overall bending energy of a membrane is the integral [16]
| (1) |
over the membrane area . The characteristic elastic parameters of the membrane are the bending rigidity and the modulus of Gaussian curvature . The spontaneous curvature reflects an intrinsic preference for bending, which can result from an asymmetry in either the composition of the two monolayers or in the concentration of solutes on both sides of the membranes [17].
Our focus here is on symmetric membranes with zero spontaneous curvature. For typical values in the range from 10 to 40 [6, 7] and typical values between and of lipid membranes [18], the bending energy (1) of symmetric membranes with is minimal in the planar state [19, 18]. Membrane shape changes and fluctuations relative to the planar minimum-energy state with zero bending energy can be described by the perpendicular deviation out of a reference --plane. For typically small angles between the membrane and the reference --plane, the mean curvature can be approximated as , and the bending energy is [20]
| (2) |
because the integral over the Gaussian curvature in Eq. (1) is zero for all deviations and fluctuations that do not change the membrane topology of the planar state, according to the Gauss-Bonnet theorem. Contributions from boundary terms of the Gauss-Bonnet theorem vanish for appropriate choices of the boundary conditions, e.g. for periodic boundaries.
The overall bending energy of two adhering membranes with negligible spontaneous curvature is the sum of the bending energies (2) of the membranes. Here, and are the bending rigidities of the two membranes, and and are the deviation fields out of a reference --plane. In analogy to the two-body problem, a transformation of variables to the separation field and ‘center-of-mass’ field allows to rewrite the overall bending energy as with the effective bending energy [21]
| (3) |
for the separation field and the ‘center-of-mass’ energy . The effective binding rigidity in Eq. (3) is . Because the binding of receptors and ligands typically depends only on the local membrane separation [22], the energy is irrelevant for the specific binding of receptors and ligands. If one of the membranes, e.g. membrane 2, is a planar supported membrane, the effective bending rigidity equals the rigidity of the apposing membrane because the rigidity of the supported membrane can be taken to be much larger than .
In simulations, elastic membranes are usually discretized. A discretization of the effective bending energy (3) of two adhering membranes can be achieved by discretizing the reference --plane into a square lattice of lattice sites with lattice constant and local separations . A discretized version of the effective bending energy (3) is [23, 24]
| (4) |
with the discretized Laplacian . Here, to are the membrane separations at the four nearest-neighbor sites of site on the square lattice. The linear size of the membrane patches is typically chosen to be around 5 nm to capture the whole spectrum of bending deformations of the lipid membranes [25].
2.2 Elastic models of biomembrane adhesion
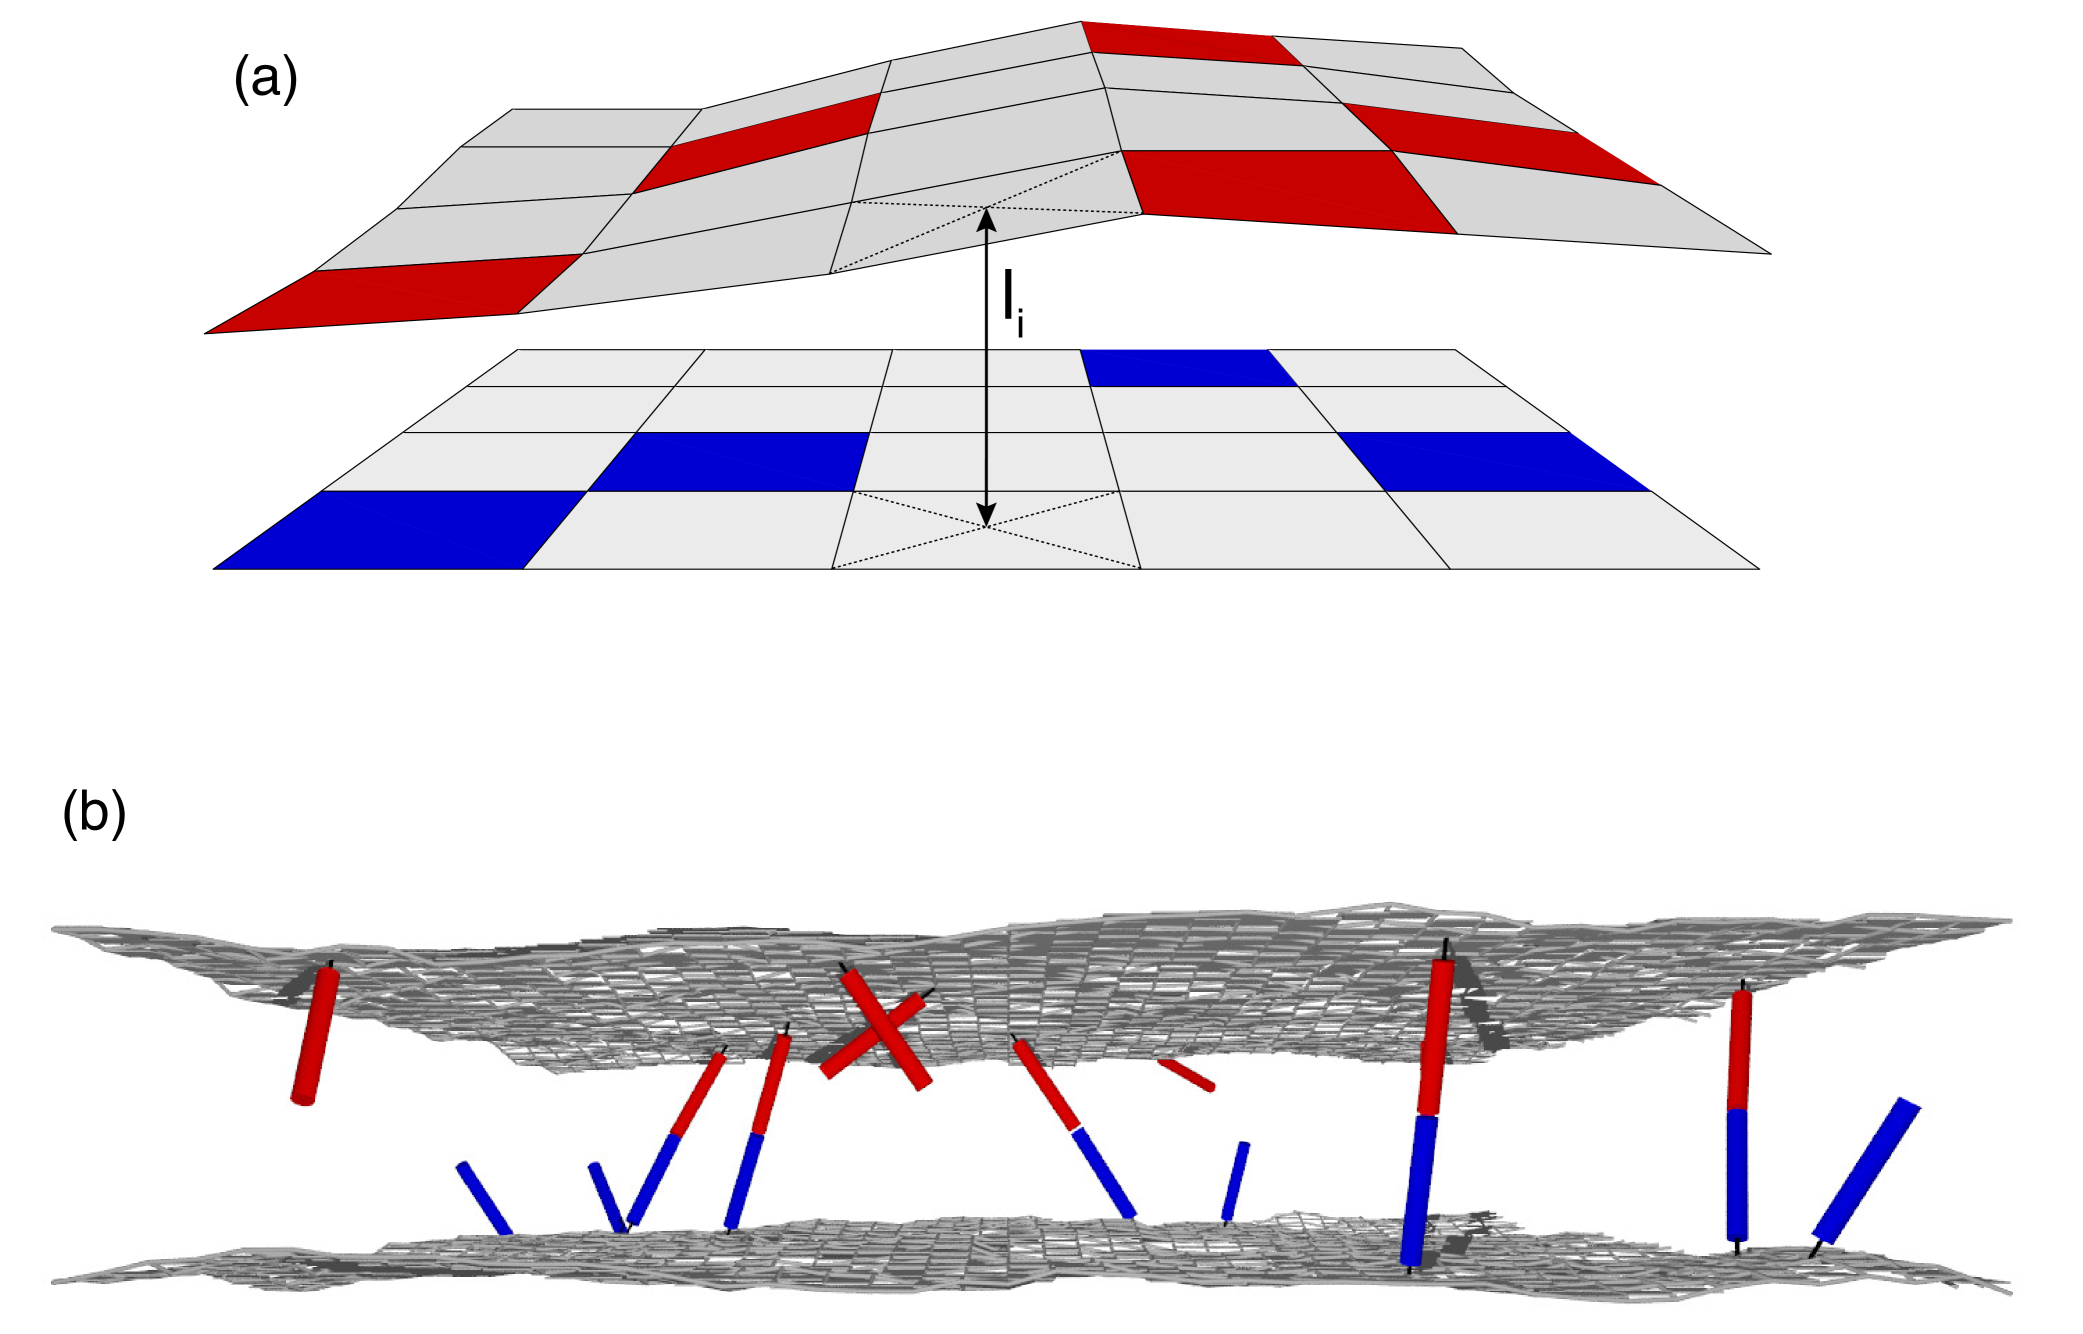
The discretization of the reference plane in the effective bending energy (4) implies a discretization of two adhering membranes into apposing pairs of nearly quadratic membrane patches. Discrete elastic models of biomembrane adhesion can be constructed by including receptor and ligand molecules in these membrane patches [23, 24, 26, 27, 28, 29, 30, 31, 12, 32, 33, 34, 35, 36, 37]. If the adhesion is mediated by a single type of receptor-ligand complexes, the distribution of receptors in one of the membranes can be described by the occupation numbers or , which indicate whether a receptor is present or absent in patch of this membrane. In the same way, the distribution of ligands in the apposing membrane can be described by occupation numbers or (see Fig. 2(a)). The specific interactions of the receptors and ligands can then be taken into account by the interaction energy [26, 12]
| (5) |
Here, is the interaction potential of a receptor and a ligand that are present at the apposing membrane patches , which implies and . The interaction potential depends on the local separation of the apposing patches. A simplified interaction potential is the square-well potential
| (6) | |||||
with the binding energy , effective length , and binding range of a receptor-ligand complex. For this interaction potential, a receptor and ligand are bound with energy if the local separation of their apposing membrane patches is within the binding range .
The total energy of the model is the sum of the effective bending energy (4) of the membranes and the interaction energy (5) of the receptors and ligands. The binding equilibrium of the biomembranes can be determined from the free energy , where is the partition function of the system, is Boltzmann’s constant, and is the temperature. The partition function is the sum over all possible membrane configurations, with each configuration weighted by the Boltzmann factor . A membrane configuration is characterized by the local separations of the apposing membrane patches and by the distributions and of the receptors and ligands. In this model, the partial summation in the partition function over all possible distributions and of receptors and ligands can be performed exactly, which leads to an effective adhesion potential. The effective adhesion potential is a square-well potential with the same binding range as the receptor-ligand interaction (6) and an effective potential depth that depends on the concentrations and binding energy of receptors and ligands [26, 24, 12]:
| (7) | |||||
For typical concentrations of receptors and ligands up to hundred or several hundred molecules per square micrometer in cell adhesion zones, the average distance between neighboring pairs of receptor and ligand molecules is much larger than the lattice spacing nm of the discretized membranes. For these small concentrations, the effective binding energy of the membranes is
| (8) |
where is the area concentration of unbound receptors, is the area concentration of unbound ligands, and is the binding constant for local separations inside the binding well [12]. The binding equilibrium in the contact zone can therefore be determined from considering two membranes with the discrete elastic energy (5) that interact via the effective adhesion potential (7) with well depth and width .
An important quantity is the fraction of membrane patches that are bound in the square well of the effective adhesion potential (7). The bound membrane fraction can be determined in Monte Carlo simulations [26, 24] and continuously decays to zero when the effective binding energy approaches the critical binding energy for the unbinding of the membranes [38]. The unbinding transition of the membranes results from an interplay of the effective adhesion (7) and the steric repulsion of the membranes that is caused by thermally excited membrane shape fluctuations [39]. For effective binding energies smaller than , the effective adhesion potential (7) is not strong enough to hold the membranes together against their steric, fluctuation-induced repulsion.
Biomembrane adhesion via a single type of receptor-ligand bond occurs in experiments with a single type of ligand that binds to a single type of receptor in cells [40, 41, 42], reconstituted vesicles [43, 44, 45, 46, 47, 48, 49, 31, 50, 51, 52, 53, 54], or cell-membrane-derived vesicles [13]. The ligands in these experiments are either anchored in substrate-supported membranes, or directly deposited on substrates. But cell adhesion is often mediated by several types of receptor-ligand complexes. The adhesion of T cells, natural killer (NK) cells, and B cells is mediated by receptor-ligand complexes of different lengths [55, 56, 57, 58, 59, 60]. Cell adhesion via long and short receptor-ligand complexes has been investigated in experiments in which the cells adhere to supported membranes that contain two types of ligands [57, 61, 62, 63, 64, 65].
Adhesion via two types of receptors and ligands can be modeled with occupation numbers and that adopt the values 0, 1, and 2, where and indicate the presence of a receptor and ligand of type 1 at the apposing pair of membrane patches, and and indicate the presence of a receptor and ligand of type 2. The interaction energy
| (9) |
of the membranes then includes two interaction potentials and for the two types of receptor-ligand complexes [14, 29]. The Kronecker symbol in Eq. (9) adopts the value for and the value for . For square-well interaction potentials and with binding energies and , effective lengths and of the complexes, and well widths and , a summation over all possible distributions and of the receptors and ligands leads to an effective double-well adhesion potential if the length difference of the receptor-ligand complexes is larger than the potential widths and . The two wells of this effective adhesion potential are located at and , have the widths and , and the effective depths
| (10) |
and
| (11) |
which depend on the concentrations , , , and of unbound receptors and ligands of type 1 and 2, and on the binding constants and of the receptors and ligands for local membrane separations inside their binding wells [14].
In elastic-membrane models with the interaction energies (5) and (9), the binding of receptors and ligands is described by interaction potentials of membrane patches that contain receptors and ligands. In a more recent elastic-membrane model, the receptors and ligands are modelled as anchored rods that diffuse continuously along the discretized membranes and rotate around their anchoring points (see Fig. 2(b)) [22]. The total energy in this model is the sum of the discretized bending energies (2) of both membranes, the overall interaction energy of the rod-like receptors as ligands, and the overall anchoring energy . The overall anchoring energy is the sum of the anchoring potentials of the receptors and ligands. A simple anchoring potential is the harmonic potential with anchoring strength and anchoring angle of the receptors or ligands relative to the local membrane normal [22]. The overall interaction energy in this model is the sum over the distance- and angle-dependent interaction potentials of the binding sites located at the tips of the receptors and ligands.
In both types of elastic-membrane models illustrated in Fig. 2, the receptors and ligands are modelled as individual molecules that can bind and unbind. In other elastic-membrane models, receptors and ligands have been described via concentration fields and not as individual molecules [66, 67, 68, 69, 70, 71, 72, 73, 74, 75], or receptor-ligand bonds have been treated as constraints on the local membrane separation [76, 77, 78, 79, 80].
2.3 Molecular models of biomembrane adhesion
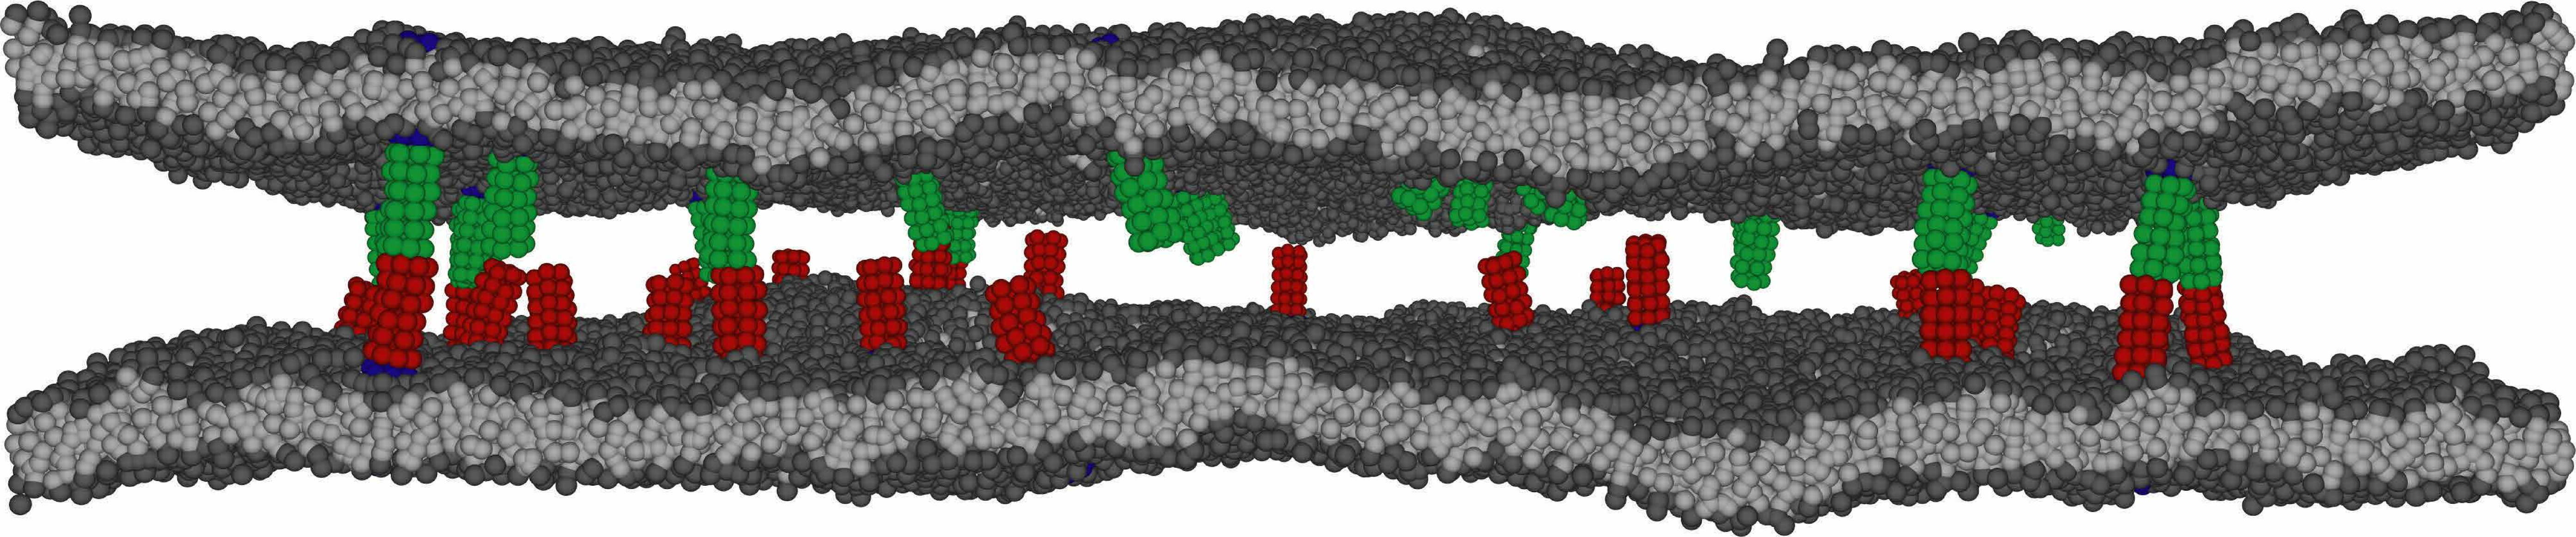
In molecular models of biomembrane adhesion, both the membrane lipids and the anchored receptors and ligands are modelled as individual molecules. Coarse-grained modelling and simulations have been widely used to investigate the self-assembly [82, 86, 87, 88], fusion [89, 90, 84, 85, 91, 92], and lipid domains [93, 94, 95, 96, 97] of membranes as well as the diffusion [98, 99], aggregation [100], and curvature generation [101, 102, 103, 104] of membrane inclusions and membrane proteins. In the coarse-grained molecular model of biomembrane adhesion [11, 81] shown in Fig. 3, the lipid molecules consist of three hydrophilic head beads (dark gray) and two hydrophobic chains with four beads each (light grey) [82, 83, 84, 85]. The receptors and ligands are composed of an interaction domain that protrudes out of the membrane (green, red), and a membrane anchor (not visible). The interaction domain consists of hydrophilic beads arranged in a cylindrical shape, with an ‘interaction bead’ as binding site at the center of the tip. This interaction domain is either rigidly connected to a cylindrical transmembrane anchor that contains hydrophobic beads, or is flexibly connected to a lipid molecule [81]. The specific binding of the receptors and ligands is modeled via a distance- and angle-dependent binding potential between two interaction beads at the tip of the molecules. The binding potential has no barrier to ensure an efficient sampling of binding and unbinding events of receptors and ligands in our simulations. The average binding times of receptors and ligands in this potential are of the order of 10 . Total simulation times of tens of milliseconds then lead to typically thousands of binding and unbinding events, which allows to determine the binding equilibrium and kinetics with high precision [11, 81]. The length and time scales of this coarse-grained model have been estimated by comparing to experimental data for the bilayer thickness and lipid diffusion constant of fluid membranes.
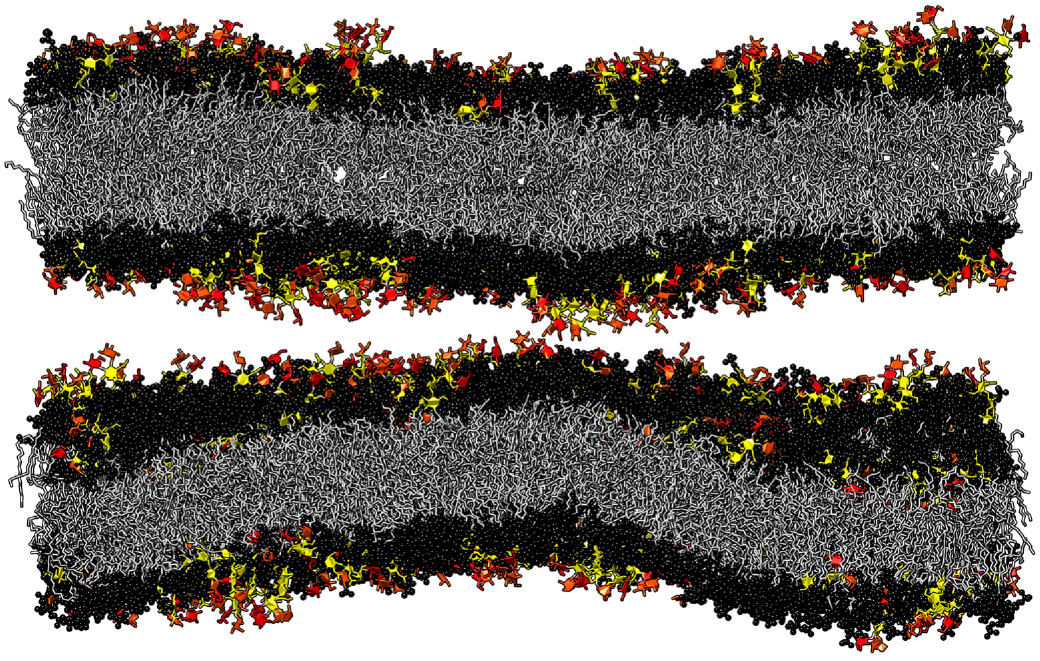
Atomistic simulation trajectories of protein binding and biomembrane adhesion are currently limited to typical timescales of microseconds [106, 107, 105], which is orders of magnitude smaller than the binding times of receptor and ligand proteins in membrane adhesion [63, 108, 109, 64, 65]. The binding equilibrium of proteins in membrane adhesion systems is therefore beyond the scope of current atomistic simulations. But in some systems, membrane adhesion can also be mediated by glycolipids [110] with binding times of nanoseconds in the atomistic simulations of Fig. 4 [105]. Simulation times of one microsecond are therefore sufficient to reach binding equilibrium. In the atomistic simulations of Fig. 4, the two membranes are composed of 1620 lipids and 180 glycolipids each and have an area of about nm2. The glycolipids contain five sugar rings that are connected to lipid tails [110].
Besides reaching the binding equilibrium of receptors and ligands, a challenge for coarse-grained and atomistic simulations of biomembrane adhesion is to equilibrate the thermal shape fluctuations of the membranes. The equilibration time depends on the lateral correlation length of the membranes [111, 112], which in turn depends on the concentration of the receptor-ligand bonds [22], and on the lateral size of the membrane in simulations of small membrane systems with few bonds [11]. In the membrane systems of Figs. 3 and 4, the correlation length is smaller than the lateral extension of the membranes and, thus, dominated by the concentration of bonds, which constrain the membrane shape fluctuations. Membrane shape fluctuations lead to variations in the local separation of the membranes, which can be quantified by the relative roughness . The relative roughness is the standard deviation of the variations in the local separation. For fluid membranes, the thermal roughness is proportional to the correlation length [113], which in turn is proportional to the average distance between neighboring bonds for sufficiently large membrane adhesion systems. Theory and simulations indicate the approximate scaling relation [22]
| (12) |
with the effective bending rigidity introduced in Eq. (3). The scaling relation (12) holds for roughnesses smaller than the length of the receptor-ligand bonds. For such roughnesses, the fluctuation-induced, steric repulsion of the membranes is negligible. For a typical concentration of receptor-ligand bonds in cell adhesion and for typical values of the bending rigidities and of lipid membranes between 10 and 40 [6, 7], the relative membrane roughness attains values between 3 nm and 6 nm according to Eq. (12). These calculated roughness values are smaller than the lengths of receptor-ligand bonds in cell adhesion, which are typically between 15 and 40 nanometers [2].
2.4 Multiscale modelling
The detailed modelling of protein binding in membrane adhesion is complicated by the relatively long binding times of proteins from milliseconds to seconds [63, 108, 109, 64, 65] and by the relatively large lateral membrane sizes of tens or hundreds of nanometers that are required to capture the full spectrum of membrane shape fluctuations up to the correlation length of the adhering membranes. A promising approach is multiscale modelling, i.e. a combination of molecular modelling of proteins on short length scales and elastic modelling of membranes on longer length scales. Fig. 5 illustrates a multiscale-modelling approach for the adhesion of vesicle membranes with the marker-of-self protein CD47 to SIRP proteins immobilized on a surface. This approach combines (i) coarse-grained molecular modelling and simulations of a single CD47-SIRP complex (see Fig. 5(a)) to determine the effective spring constant of the complex, and (ii) simulations of large elastic membrane segments adhering via CD47-SIRP complexes, modelled as elastic springs (see Fig. 5(b)).
The molecular simulations of the CD47-SIRP complex are based on the Kim-Hummer model, in which large multi-domain proteins are divided into rigid domains and unstructured linkers that connect these domains [114]. CD47 is divided into a rigid trans-membrane domain (green) and a rigid binding domain (yellow), which are connected by a rather short linker segment and an additional harmonic bond that mimics a disulfide bridge. The rigid SIRP interaction domain (blue) is connected to a surface-bound GST domain by a relatively long linker. In the molecular simulations, the CD47 transmembrane domain can rotate in a plane parallel to the substrate surfaces but keeps its orientation relative to the substrate in order to mimic the membrane embedding of this domain. The separation between the CD47 transmembrane domain and the substrate varies in the simulations and depends on the molecular architecture and flexibility of the CD47-SIRP complex. The flexibility of the complex is dominated by the rather long unstructured linker segment that connects SIRP and GST, which leads to the standard deviation nm in the separation of the CD47 transmembrane domain and the substrate. This standard deviation of the membrane-substrate separation corresponds to an effective spring constant of the complex. The mean value nm of the separation is the preferred membrane-substrate separation of the complex.
The elastic-membrane simulations of Fig. 5(b) are based on the discretized bending energy described in section 2.1. The large adhering membrane segments in these simulations are discretized into quadratic patches with linear size nm. This larger patch size allows to equilibrate the largescale membrane shape fluctuations, which dominate the membrane roughness, for the rather small complex concentrations of of CD47-SIRP. Membrane patches that contain CD47-SIRP complexes (black dots) are bound to the substrate via a harmonic potential with the preferred separation and spring constant of the complexes obtained from the molecular simulations. Repulsive interactions between the protein layer on the substrate and the membrane are taken into account by allowing only local separations between the membrane patches and the substrate, with . The CD47-SIRP complexes in the simulations are mobile and diffuse along the membrane by hopping from patch to patch. In the experiments, the mobility of complexes results from unbinding and rebinding of the relatively few CD47 proteins to the many SIRP proteins on the substrate [13].
3 Binding of membrane-anchored receptor and ligand proteins
3.1 General theory for the binding constant of proteins in membrane adhesion
Adhesion processes of cells depend sensitively on the binding affinity of the membrane-anchored receptor and ligand molecules that mediate adhesion. Binding affinities are typically quantified by binding equilibrium constants. For soluble receptor and ligand molecules that are free to diffuse in three dimensions, the binding constant is fully determined by the binding free energy of the receptor-ligand complex RL. Here, , , and are the volume concentrations of the complex RL and of the unbound receptors R and ligands L. A corresponding quantity for membrane-anchored receptors and ligands is where , , and are the area concentrations of the complex RL and of the unbound receptors R and ligands L [115, 116] (see Fig. 6). In contrast to , the quantity is not fully determined by the receptors and ligands, but depends also on properties of the membranes. For example, is zero if the membrane separation is significantly larger than the length of the receptor-ligand complex, because RL complexes cannot form at such large membrane separations.
A membrane-anchored receptor can only bind to an apposing membrane-an- chored ligand if the local membrane separation at the site of the receptor and ligand is within an appropriate range. This local separation of the membranes varies – along the membranes, and in time – because of thermally excited membrane shape fluctuations. Measurements of imply an averaging in space and time over membrane adhesion regions and measurement durations. Theory and simulations with the elastic-membrane model of Fig. 2(b) and the coarse-grained molecular model of Fig. 3 indicate that this averaging can be expressed as [22, 81]
| (13) |
where is the binding equilibrium constant of the receptors and ligands as a function of the local membrane separation , and is the distribution of local membrane separations that reflects the spatial and temporal variations of . The binding constant function is determined by molecular properties of the membrane-anchored receptors and ligands and is, thus, the proper equivalent of the binding konstant of soluble receptors and ligands. However, the set of molecular features that affect is rather large and includes the lengths, flexibility, and membrane anchoring of the receptors and ligands, besides the interactions at the binding site [22, 81]. A softer membrane anchoring, for example, leads to smaller values of because softly anchored receptors and ligands have more rotational entropy to loose during binding, compared to more rigidly anchored receptors and ligands. The anchoring elasticity depends on whether the receptors and ligands are anchored via lipids or trans-membrane protein domains, and on the length and flexibility of unstructured linker segments that connect the extracellular domains of the receptors and ligands to these membrane anchors. If the adhesion is mediated by a single type of receptor-ligand complex with a length that is larger than the relative roughness of the fluctuating membranes from thermally excited shape fluctuations, the distribution of the local separation can be approximated by the Gaussian function [81, 22]
| (14) |
The mean of the distribution is the average separation of the membranes, and the standard deviation of this distribution is the relative roughness .
Fig. 7 illustrates the modelling of simulation results for based on Eq. (13). The data points in Fig. 7(a) and (b) result from MD simulations with the coarse-grained molecular model of Fig. 3. In these simulations, has been measured for a variety of membrane systems that differ in membrane area, in the number of receptors and ligands, or in the membrane potential [81], at ‘optimal’ average membrane separations at which is maximal. These optimal average separations correspond to average separations in equilibrated adhesion zones of cell, because maxima in correspond to minima in the adhesion free energy [11, 22]. In the MD simulations, the average separation is determined by the number of water beads between the membranes and is, thus, constant. The relative membrane roughness depends on the area of the membranes because the periodic boundaries of the simulation box suppress membrane shape fluctuations with wavelength larger than . In membrane systems with several anchored receptors and ligands, the roughness is affected by the number of receptor-ligand bonds because the bonds constrain the membrane shape fluctuations. For the small numbers of receptors and ligands in the MD simulations, the binding constants can be determined from the times spent in bound and unbound states [11, 81].
With increasing size of the membrane systems, the relative roughness strongly increases, while strongly decreases. The decrease of with increasing roughness can be understood from Eq. (13). An increase in implies a broadening of , which leads to smaller values of the integral at the optimal average separation of binding. In Fig. 7(c) and (d), the distributions at the optimal average separation are illustrated for several values of the membrane roughness . The function for the lipid-anchored receptors and ligands in Fig. 7(c) is significantly broader than for the transmembrane receptors and ligands in Fig. 7(d). The functions are asymmetric because the receptor-ligand complexes can tilt at local separations smaller than the ‘preferred’ separation at which the functions are maximal, but need to stretch at local separations larger than .
Because is difficult to measure in adhesion experiments, an important question is how is related to the binding equilibrium constant of soluble variants of the receptors and ligands that lack the membrane anchors [115, 116, 12, 117, 118, 119, 11, 120, 22, 81]. The binding constant can be quantified with standard experimental methods [121, 122, 123]. In Fig. 7, is given in units of nm where nm3 is determined by the binding potential of the coarse-grained model [11, 81]. For the rod-like receptors and ligands of this coarse-grained molecular model and of the elastic-membrane model of Fig. 2(b), the ratio can be calculated from the loss of rotational and translational entropy during binding [22, 81]:
| (15) |
Here, , , and are the rotational phase space volumes of the unbound receptors R, unbound ligands L, and bound receptor-ligand complex RL relative to the membranes, and and are the translational phase space area and translational phase space volume of the bound ligand relative to the receptor in 2D and 3D. The rotational phase space volume depends on the local separation of the membranes and can be calculated by modelling the membrane-anchored complex as a harmonic spring that can tilt [22, 81]. The Eqs. (13), (14), and (15) provide a general relation between and . The ratio has units of an inverse length, but depends on several length scales: the average separation and relative roughness of the membranes, the width of the function , and the ratio in Eq. (15). The ratio is a characteristic length for the binding interface of the receptor-ligand complex and can be estimated as the standard deviation of the binding-site distance in the direction of the complex [22].
3.2 Cooperative protein binding from membrane shape fluctuations on nanoscales
As discussed in the previous section, two important length scales in the general theory for are the relative membrane roughness and the average membrane separation , i.e. the standard deviation and mean of the distribution of local membrane separations. A third important length scale is the width of the function in Eq. (13), which reflects the membrane confinement exerted by a single receptor-ligand complex. Coarse-grained molecular modelling indicates that the standard deviation of the function is about 1 nm or less, depending on the anchoring of the receptors and ligands [13, 81] (see Figs. 7 and 9). The relative membrane roughness depends on the concentration of receptor-ligand complexes, which ‘clamp’ the membranes together and thus suppress membrane shape fluctuations, and on the bending rigidities and of the adhering membranes. The scaling relation (12) leads to values between 3 nm and 6 nm for a typical concentration of receptor-ligand bonds in cell adhesion and for typical values of the bending rigidities and of lipid membranes between 10 and 40 [6, 7]. For such relative membrane roughnesses, the distribution of local membrane separations is significantly broader than the function . Eq. (13) with the Gaussian distribution of Eq. (14) can then be approximated as [22]
| (16) |
for average separations close to the preferred separation of the bonds. Eq. (16) implies an inverse proportionality between and at the optimal average separation for binding, which has been first observed in coarse-grained MD simulations with transmembrane receptors and ligands [11]. For these transmembrane receptors and ligands, the standard deviation of the function in Fig. 7(d) is about 0.37 nm and, thus, smaller than all roughness values of Fig. 7(b), and the black line in Fig. 7(b) is [124]. For the lipid-anchored receptors and ligands of Fig. 7, the standard deviation of the function in Fig. 7(c) is about 1.4 nm, and the inverse proportionality of Eq. (16) holds for roughness values larger than about 2 nm. Together with the scaling relation (12) between the relative roughness and the concentration of receptor-ligand bonds, the inverse proportionality of and leads to the law of mass action [11, 12]:
| (17) |
The quadratic dependence of the bond concentration on the concentrations and of unbound receptors and ligands in Eq. (17) indicates cooperative binding. The binding cooperativity results from a smoothening of the membranes with increasing bond concentration , which facilitates the binding of additional receptors and ligands (see Fig. 8).
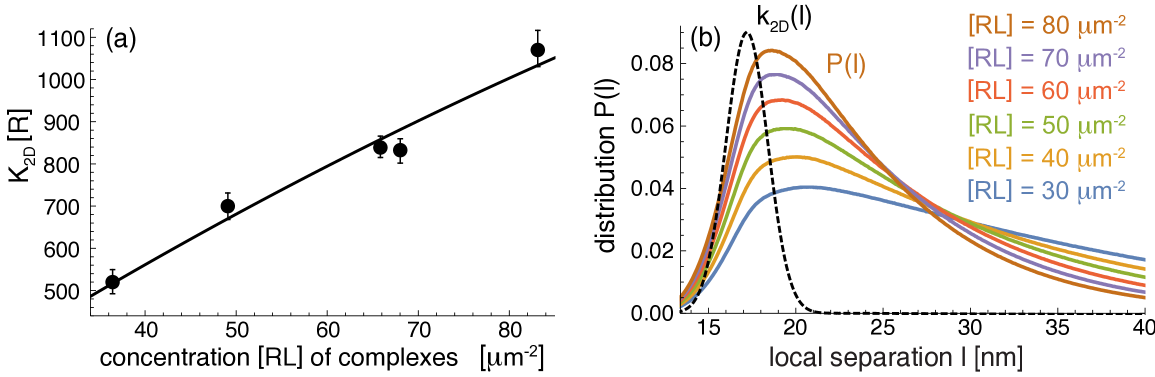
The cooperative binding of receptors and ligands in membrane adhesion has been recently confirmed in experiments in which CD47 proteins in giant vesicles generated from cell membranes bind to SIRP proteins immobilized on a planar substrate [13]. The experimental data points in Fig. 9(a) show that increases with increasing concentration of receptor-ligand bonds. The multiscale modelling illustrated in Fig. 5 confirms that this experimentally observed increase in results from a smoothening of the membranes with increasing . In the multiscale modelling approach, the shape of the function is determined from coarse-grained simulations of a single CD47-SIRP complex (see Fig. 5(a)). The distribution of membrane-substrate separations at the site of complex obtained from these simulations is equivalent to the shape of , because of where is the binding free energy of the complex [22], and because the Boltzmann factor determines the distributions of local separations at the site of the complex. The coarse-grained molecular simulations indicate that the variations of the local separation at the site of the complex are dominated by the rather long unstructured linker segment that connects SIRP to the substrate-bound GST domain in Fig. 5(a). The resulting distribution of local separations is approximately Gaussian, with a standard deviation nm that corresponds to the width of . In the elastic-membrane simulations of Fig. 5(b), bound CD47-SIRP complexes are therefore modelled as harmonic springs with effective spring constant . The distributions for the large adhering membrane segments of these simulations are shown in Fig. 9(b) for various concentrations of CD47-SIRP complexes. The distributions are asymmetric because the width of these distributions, the relative membrane roughness , is larger than the separation nm between the membrane and the protein layer in the simulations. Steric interactions between the protein layer on the substrate and the membrane are taken into account by allowing only local separations where is the preferred membrane-substrate separation of CD47-SIRP complex. The steric interactions lead to a fluctuation-induced repulsion of the membrane from the protein layer on the substrate. Because of this fluctuation-induced repulsion, the average membrane-substrate separation , i.e. the mean of , is larger than the preferred membrane-substrate separation of CD47-SIRP complex, which is nm according to the coarse-grained molecular simulations of Fig. 5(a). With increasing concentration , the distributions of Fig. 9(b) become narrower and shift towards , which both leads to larger values of according to Eq. (13) due to a larger overlap of with . The line in Fig. 9(a) results from the distributions in (b) with the fit parameter for the maximal value of , where is the concentration of unbound SIRP on the substrate. Similar lines are obtained for values of the modelling parameter between 1 nm and 5 nm [13].
4 Adhesion-induced domain formation of membrane-anchored proteins
4.1 Length-based segregation of receptor-ligand complexes
The adhesion of T cells and other immune cells is mediated by receptor-ligand complexes of different lengths, which tend to segregate into domains of long and short complexes [55, 56, 57, 58, 59, 60]. Long and short receptor-ligand complexes in membrane adhesion zones repel each other because the membranes need to curve to compensate the length mismatch (see Fig. 10). The strength of this curvature-mediated repulsion and segregation depends both on the length difference and the concentrations of the receptor-ligand complexes.
Calculations and simulations with the elastic-membrane model of Fig. 2 with the interaction energy (9) for short complexes of length and long complexes of length indicate that the curvature-mediated segregation of the complexes is stable for bond concentrations
| (18) |
with the numerical prefactor [15, 29, 14]. Here, is the effective bending rigidity of the two membranes with rigidities and (see section 2.1). In equilibrium, the concentration of the short complexes in domain 1 is equal to the concentration of the long complexes in domain 2. For complex concentrations and smaller than the critical concentration of Eq. (18), the domains are unstable because the entropy of mixing of the bonds then dominates over the curvature-mediated repulsion.
The derivation of Eq. (18) is based on the effective double-well potential of the elastic-membrane model with well depths and that depend on the concentrations of the receptors and ligands and on their binding constants and for membrane separations within the potential wells (see Eq. (10) and (11)). Elastic membranes interacting via this double-membrane potential exhibit stable domains for with where and are the widths the two wells [29]. For typical relative membrane roughnesses in the domains larger than the well widths and , the bond concentrations and with are proportional to the square of concentrations of the unbound receptors and ligands [12, 14] (see also Eq. (17). Together, these equations lead to Eq. (18) [15].
In T cell adhesion zones, nanoclusters and domains of short TCR-MHCp complexes and long integrin complexes form at sufficiently large concentrations of MHCp [57, 125, 126, 61, 127]. For the preferred membrane separations nm and nm of the TCR-MHCp and integrin complexes [2] and for typical membrane bending rigidities between 10 and 40 , the critical concentrations of Eq. (18) for curvature-mediated segregation into domains vary between 25 and 200 complexes per square micron. These bond concentrations are smaller than the experimentally measured concentrations of TCR and integrin complexes [57], which indicates that the curvature-mediated repulsion of these complexes is sufficiently strong to drive the domain formation.
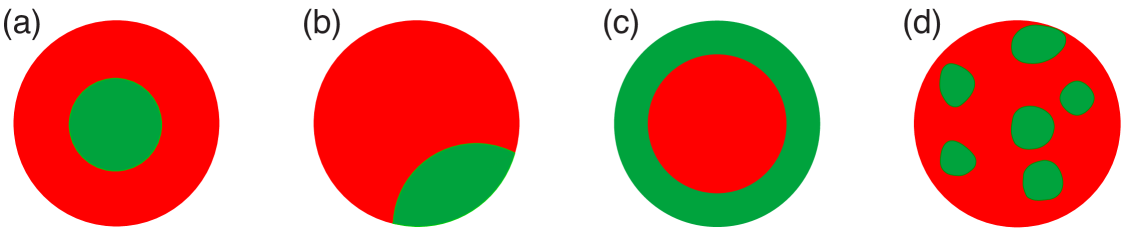
The domains of long and short receptor-ligand complexes formed during T cell adhesion evolve in characteristic patterns. The final domain pattern in the T-cell contact zone is formed within 15 to 30 minutes and consists of a central TCR domain surrounded by a ring-shaped integrin domain [56, 57] (see Fig. 11(a)). In contrast, the intermediate patterns formed within the first minutes of T-cell adhesion are either the inverse of the final pattern, with a central integrin domain surrounded by a ring-shaped TCR domain (see fig. 11(c)), or exhibit several nearly circular TCR domains in the adhesion zone (see fig. 11(d)) [57, 55]. To understand this pattern evolution, several groups have modelled and simulated the time-dependent pattern formation during adhesion [68, 27, 128, 129, 70, 28, 71, 130, 30, 131, 54, 36]. Monte Carlo simulations with a discretized elastic-membrane model indicate that the central TCR cluster is only formed if TCR molecules are actively transported by the cytoskeleton towards the center of the adhesion zone [28]. The active transport has been simulated by a biased diffusion of TCRs towards the adhesion zone center, which implies a weak coupling of TCRs to the cytoskeleton. In the absence of active TCR transport, the Monte Carlo simulations lead to the final, equilibrium pattern shown in Fig. 11(b), which minimizes the energy of the boundary line between the TCR and the integrin domain [28]. In agreement with these simulations, T-cell adhesion experiments on patterned substrates indicate that cytoskeletal forces drive the TCRs towards the center of the adhesion zone [61, 132], by a weak frictional coupling of the TCRs to the cytoskeletal flow initiated by T cell activation. The intermediate patterns formed in the Monte Carlo simulations closely resemble the intermediate T cell patterns shown in Figs. 11(c) and (d). In the simulations, these patterns emerge from small TCR clusters that are formed within the first seconds of adhesion [28]. The diffusion of free TCR and MHC-peptide molecules into the adhesion zone leads to faster growth of TCR clusters close to the periphery of the adhesion zone. For sufficiently large TCR-MHC-peptide concentrations, the peripheral TCR clusters grow into the ring-shaped domain of Fig. 11(c). At smaller TCR-MHC-peptide concentration, the initial clusters evolve into the multifocal pattern of Fig. 11(d).
Experiments on reconstituted membrane systems and simulations show that curvature-mediated segregation also occurs between small receptor-ligand complexes and larger membrane-anchored proteins that sterically prevent the preferred local separation of the receptors and ligands for binding [133]. Calculations and simulations with discretized elastic-membrane models indicate segregation of sterically repulsive proteins of length and receptor-ligand complexes with preferred local separation if the concentration of the repulsive proteins exceeds the critical concentration with a numerical prefactor [27]. The interplay of receptor-ligand binding and steric repulsion from glycocalyx proteins has also been investigated in models for the clustering of integrin receptors during cell adhesion [75, 134, 135, 136]. In addition, segregation of long and short bonds has been observed in experiments with reconstituted membranes that adhere via anchored DNA [137]. Segregation can also result from the interplay of specific receptor-ligand binding and generic adhesion if the minimum of the generic adhesion potential is located at membrane separations that are significantly larger than the lengths of the receptor-ligand complexes [138, 66, 54].
4.2 Fluctuation-mediated attraction of adhesion complexes
Complexes of receptor and ligand proteins that are anchored in apposing membranes ‘clamp’ the membranes together and constrain the shape fluctuations of the membranes. These constraints lead to attractive fluctuation-induced interactions between identical receptor-ligand bonds, or receptor-ligand bonds of equal lengths. The interaction of two neighboring bonds is attractive because the membrane shape fluctuations are less constrained if the bonds are close to each other. The membranes then are effectively clamped together at a single site, and not at two sites as for larger bond distances. A single receptor-ligand bond that pins two fluctuating membranes locally together leads to a cone-shaped average membrane profile around the pinning site, i.e. the average local separation of the membranes increases linearly with the distance from the receptor-ligand bond [139, 140] because of the steric, fluctuation-induced repulsion of the membranes [39, 38]. Pair interactions of two isolated receptor-ligand bonds can be understood as interactions of two cone-shaped profiles around the bonds [141], but this interaction appears artificial because membrane adhesion is typically mediated by many bonds, and the apposing membranes are on average planar and parallel to each other in adhesion zones with many bonds of the same type or length. As an alternative, pair interactions of receptor-ligand bonds can be calculated for membranes held together by an additional generic harmonic potential, but these pair interactions then depend on the potential strength and the location of the potential minimum [78].
A more suitable approach is to quantify the overall strength of the fluctuation-mediated interactions between receptor-ligand bonds from the phase behavior and aggregation tendency of many bonds [142, 26]. The overall strength of the fluctuation-mediated attraction between identical receptor-ligand complexes depends on the length of the complexes, on the strength of the membrane confinement exerted by a complex, and on the concentration of the complexes. Because of the fluctuation-induced attraction, the receptor-ligand bonds in Fig. 5(b) tend to be in the vicinity of other receptor-ligand complexes. However, the fluctuation-mediated interactions are not sufficiently strong to induce aggregation and domain formation on their own, irrespective of the confinement strength and concentration of the bonds [26, 24]. Aggregation only due to fluctuation-mediated interactions does not occur in the elastic-membrane model of Fig. 2(a) because the unbinding transition of membranes in the effective adhesion potential (7) of this model is continuous [38], which precludes a discontinuity in concentrations during adhesion that is necessary for aggregation and domain formation [26, 24]. Bond aggregation either requires additional direct attractive interactions [26, 79], an additional local stiffening of the membranes by the membrane anchors of the receptors or ligands [26], or a preclustering into multimeric receptors and ligands [142].
5 Summary and outlook
Biomembrane adhesion involves an interplay between protein binding and membrane shape fluctuations, because the binding of the proteins that mediate the adhesion depends on the separation of the two adhering membranes. The elastic-membrane and coarse-grained molecular models of biomembrane adhesion reviewed here indicate that the binding equilibrium resulting from this interplay can be understood based on Eq. (13) for the apparent binding constant of the proteins (see section 3.1). The apparent binding constant depends on properties of the protein molecules as well as on properties of the membranes and is therefore not a proper binding constant. The proper quantification of the binding affinity of proteins in membrane adhesion is the function in Eq. (13), i.e. the binding constant of the proteins as a function of the local membrane separation . The function depends only on molecular properties of the proteins, i.e. on their membrane anchoring, lengths, flexibility, and binding interaction, and is thus an equivalent of the binding constant of soluble proteins. The dependence of on overall properties of the membranes is captured by the distribution of local membrane separations in Eq. (13). The distribution depends on the concentration of the protein complexes because the protein complexes constrain the membrane shape fluctuations, which leads to a binding cooperativity (see section 3.2). Membrane shape fluctuations also lead to attractive interactions between receptor-ligand bonds of similar lengths (see section 4.2), besides cooperative binding. However, these fluctuation-mediated interactions are not sufficiently strong to induce domains of receptor-ligand bonds on their own. In contrast, the curvature-mediated repulsion between receptor-ligand bonds of different lengths is a strong driving force for segregation and domain formation (see section 4.1). This curvature-mediated repulsion results from the membrane curvature required to compensate the length mismatch between short protein bonds and long bonds or proteins.
A future challenge of simulations and experiments is to determine the binding constant function of membrane-anchored proteins. For the CD47-SIRP complex of Fig. 5(a), the shape of the function has been obtained from simulations with a coarse-grained molecular model of the bound complex (see Fig. 9(b)). In principle, values of at selected local separations can be obtained from modelling and simulations by determining the probability that the membrane-anchored proteins are bound at these local separations. A promising approach is to focus on the ratio because this ratio is determined by the molecular architecture and anchoring flexibility of the membrane-anchored proteins, which can be well described with coarse-grained modelling (see also Eq. (15) for rod-like receptors and ligands). The free-energy contribution of the binding site drops out from this ratio because the binding site can be assumed to be identical for the soluble and membrane-anchored proteins. Absolute values for can then be obtained if the binding constant of soluble variants of the proteins without membrane anchors is known from experiments. A further experimental challenge is to measure the relative roughness of the adhering membranes. Experimental measurements of the relative membrane roughness require a spatial resolution in the nanometer range both in the directions parallel and perpendicular to the membranes, which is beyond the scope of current methods [143, 144, 145].
Acknowledgements
We would like to thank Mesfin Asfaw, Heinrich Krobath, Emanuel Schneck, Guang-Kui Xu, and in particular Reinhard Lipowsky for numerous discussions and joint work on topics of this review.
BR has been supported by the National Science Centre, Poland, grant number 2016/21/B/NZ1/00006. JH has been supported by the National Science Foundation of China, grant numbers 21504038 and 21973040. Part of the simulations have been performed on the computing facilities in the High Performance Computing Center (HPCC) of Nanjing University.
References
- [1] B. Alberts, A. Johnson, J. Lewis, D. Morgan, M. Raff, K. Roberts, P. Walter, J. Wilson, T. Hunt, Molecular Biology of the Cell, 6th ed., Garland Science, New York, 2014.
- [2] M. L. Dustin, J. A. Cooper, The immunological synapse and the actin cytoskeleton: molecular hardware for T cell signaling, Nat. Immunol. 1 (2000) 23–29.
- [3] N. Morone, T. Fujiwara, K. Murase, R. S. Kasai, H. Ike, S. Yuasa, J. Usukura, A. Kusumi, Three-dimensional reconstruction of the membrane skeleton at the plasma membrane interface by electron tomography, J. Cell Biol. 174 (6) (2006) 851–862.
- [4] A. C. N. Brown, I. M. Dobbie, J.-M. Alakoskela, I. Davis, D. M. Davis, Super-resolution imaging of remodeled synaptic actin reveals different synergies between NK cell receptors and integrins, Blood 120 (18) (2012) 3729–3740.
- [5] F. Etoc, C. Vicario, D. Lisse, J.-M. Siaugue, J. Piehler, M. Coppey, M. Dahan, Magnetogenetic control of protein gradients inside living cells with high spatial and temporal resolution, Nano Lett. 15 (5) (2015) 3487–94.
- [6] J. F. Nagle, Introductory lecture: Basic quantities in model biomembranes, Faraday Discuss. 161 (2013) 11–29.
- [7] R. Dimova, Recent developments in the field of bending rigidity measurements on membranes, Adv. Colloid Interface Sci. 208 (2014) 225–234.
- [8] R. Simson, E. Wallraff, J. Faix, J. Niewohner, G. Gerisch, E. Sackmann, Membrane bending modulus and adhesion energy of wild-type and mutant cells of dictyostelium lacking talin or cortexillins, Biophys. J. 74 (1998) 514–522.
- [9] G. Popescu, T. Ikeda, K. Goda, C. A. Best-Popescu, M. Laposata, S. Manley, R. R. Dasari, K. Badizadegan, M. S. Feld, Optical measurement of cell membrane tension, Phys. Rev. Lett. 97 (21) (2006) 218101.
- [10] T. Betz, M. Lenz, J.-F. Joanny, C. Sykes, ATP-dependent mechanics of red blood cells, Proc. Natl. Acad. Sci. USA 106 (36) (2009) 15320–15325.
- [11] J. Hu, R. Lipowsky, T. R. Weikl, Binding constants of membrane-anchored receptors and ligands depend strongly on the nanoscale roughness of membranes, Proc. Natl. Acad. Sci. USA 110 (38) (2013) 15283–15288.
- [12] H. Krobath, B. Rozycki, R. Lipowsky, T. R. Weikl, Binding cooperativity of membrane adhesion receptors, Soft Matter 5 (2009) 3354–3361.
- [13] J. Steinkühler, B. Rozycki, C. Alvey, R. Lipowsky, T. R. Weikl, R. Dimova, D. E. Discher, Membrane fluctuations and acidosis regulate cooperative binding of ’marker of self’ protein CD47 with the macrophage checkpoint receptor SIRP, J. Cell. Sci. 132 (2019) jcs216770.
- [14] T. R. Weikl, M. Asfaw, H. Krobath, B. Rozycki, R. Lipowsky, Adhesion of membranes via receptor-ligand complexes: Domain formation, binding cooperativity, and active processes, Soft Matter 5 (2009) 3213–3224.
- [15] T. R. Weikl, Membrane-mediated cooperativity of proteins, Annu. Rev. Phys. Chem. 69 (2018) 521–539.
- [16] W. Helfrich, Elastic properties of lipid bilayers: theory and possible experiments, Z. Naturforsch. C 28 (1973) 693–703.
- [17] R. Lipowsky, Spontaneous tubulation of membranes and vesicles reveals membrane tension generated by spontaneous curvature, Faraday Discuss. 161 (2013) 305–331.
- [18] M. Hu, J. J. Briguglio, M. Deserno, Determining the Gaussian curvature modulus of lipid membranes in simulations, Biophys. J. 102 (6) (2012) 1403–1410.
- [19] D. P. Siegel, M. M. Kozlov, The Gaussian curvature elastic modulus of N-monomethylated dioleoylphosphatidylethanolamine: relevance to membrane fusion and lipid phase behavior, Biophys. J. 87 (1) (2004) 366–374.
- [20] S. A. Safran, Statistical Thermodynamics of Surfaces, Interfaces, and Membranes, Addison-Wesley, Reading, USA, 1994.
- [21] R. Lipowsky, Lines of renormalization group fixed points for fluid and crystalline membranes, Europhys. Lett. 7 (1988) 255–261.
- [22] G.-K. Xu, J. Hu, R. Lipowsky, T. R. Weikl, Binding constants of membrane-anchored receptors and ligands: A general theory corroborated Monte Carlo simulations, J. Chem. Phys. 143 (2015) 243136.
- [23] R. Lipowsky, Adhesion of membranes via anchored stickers, Phys. Rev. Lett. 77 (1996) 1652–1655.
- [24] T. R. Weikl, R. Lipowsky, Membrane adhesion and domain formation. In Advances in Planar Lipid Bilayers and Liposomes. A. Leitmannova Liu, editor, Academic Press, 2006.
- [25] R. Goetz, G. Gompper, R. Lipowsky, Mobilitiy and elasticity of self-assembled membranes, Phys. Rev. Lett. 82 (1999) 221–224.
- [26] T. R. Weikl, R. Lipowsky, Adhesion-induced phase behavior of multicomponent membranes, Phys. Rev. E. 64 (2001) 011903.
- [27] T. R. Weikl, J. T. Groves, R. Lipowsky, Pattern formation during adhesion of multicomponent membranes, Europhys. Lett. 59 (2002) 916–922.
- [28] T. R. Weikl, R. Lipowsky, Pattern formation during T-cell adhesion, Biophys. J. 87 (2004) 3665–3678.
- [29] M. Asfaw, B. Rozycki, R. Lipowsky, T. R. Weikl, Membrane adhesion via competing receptor/ligand bonds, Europhys. Lett. 76 (2006) 703–709.
- [30] P. K. Tsourkas, N. Baumgarth, S. I. Simon, S. Raychaudhuri, Mechanisms of B-cell synapse formation predicted by Monte Carlo simulation, Biophys. J. 92 (2007) 4196–4208.
- [31] E. Reister-Gottfried, K. Sengupta, B. Lorz, E. Sackmann, U. Seifert, A. S. Smith, Dynamics of specific vesicle-substrate adhesion: From local events to global dynamics, Phys. Rev. Lett. 101 (2008) 208103.
- [32] B. Różycki, R. Lipowsky, T. R. Weikl, Segregation of receptor–ligand complexes in cell adhesion zones: phase diagrams and the role of thermal membrane roughness, New J. Phys. 12 (2010) 095003.
- [33] H. Krobath, B. Rozycki, R. Lipowsky, T. R. Weikl, Line tension and stability of domains in cell-adhesion zones mediated by long and short receptor-ligand complexes, PLoS One 6 (8) (2011) e23284.
- [34] T. Bihr, U. Seifert, A.-S. Smith, Nucleation of ligand-receptor domains in membrane adhesion, Phys. Rev. Lett. 109 (25) (2012) 258101.
- [35] L. Li, J. Hu, X. Shi, Y. Shao, F. Song, Lipid rafts enhance the binding constant of membrane-anchored receptors and ligands, Soft Matter 13 (23) (2017) 4294–4304.
- [36] M. Knezevic, H. Jiang, S. Wang, Active tuning of synaptic patterns enhances immune discrimination, Phys. Rev. Lett. 121 (23) (2018) 238101.
- [37] L. Li, J. Hu, L. Li, F. Song, Binding constant of membrane-anchored receptors and ligands that induce membrane curvatures, Soft Matter 15 (17) (2019) 3507–3514.
- [38] R. Lipowsky, S. Leibler, Unbinding transitions of interacting membranes, Phys. Rev. Lett. 56 (1986) 2541–2544.
- [39] W. Helfrich, Steric interaction of fluid membranes in multilayer systems, Z. Naturforsch. A 33 (1978) 305–315.
- [40] M. L. Dustin, L. M. Ferguson, P. Y. Chan, T. A. Springer, D. E. Golan, Visualization of CD2 interaction with LFA-3 and determination of the two-dimensional dissociation constant for adhesion receptors in a contact area, J. Cell. Biol. 132 (1996) 465–474.
- [41] D.-M. Zhu, M. L. Dustin, C. W. Cairo, D. E. Golan, Analysis of two-dimensional dissociation constant of laterally mobile cell adhesion molecules, Biophys. J. 92 (2007) 1022–1034.
- [42] T. P. Tolentino, J. Wu, V. I. Zarnitsyna, Y. Fang, M. L. Dustin, C. Zhu, Measuring diffusion and binding kinetics by contact area FRAP, Biophys. J. 95 (2008) 920–930.
- [43] A. Albersdörfer, T. Feder, E. Sackmann, Adhesion-induced domain formation by interplay of long-range repulsion and short-range attraction force: A model membrane study, Biophys. J. 73 (1) (1997) 245–257.
- [44] A. Kloboucek, A. Behrisch, J. Faix, E. Sackmann, Adhesion-induced receptor segregation and adhesion plaque formation: A model membrane study, Biophys. J. 77 (1999) 2311–2328.
- [45] C. W. Maier, A. Behrisch, A. Kloboucek, D. A. Simson, R. Merkel, Specific biomembrane adhesion - indirect lateral interactions between bound receptor molecules, Eur. Phys. J. E 6 (2001) 273–276.
- [46] A.-S. Smith, B. G. Lorz, U. Seifert, E. Sackmann, Antagonist-induced deadhesion of specifically adhered vesicles, Biophys. J. 90 (2006) 1064–1080.
- [47] B. G. Lorz, A.-S. Smith, C. Gege, E. Sackmann, Adhesion of giant vesicles mediated by weak binding of sialyl-Lewisx to E-selectin in the presence of repelling poly(ethylene glycol) molecules, Langmuir 23 (2007) 12293–12300.
- [48] O. Purrucker, S. Goennenwein, A. Foertig, R. Jordan, M. Rusp, M. Baermann, L. Moroder, E. Sackmann, M. Tanaka, Polymer-tethered membranes as quantitative models for the study of integrin-mediated cell adhesion, Soft Matter 3 (2007) 333–336.
- [49] A.-S. Smith, K. Sengupta, S. Goennenwein, U. Seifert, E. Sackmann, Force-induced growth of adhesion domains is controlled by receptor mobility, Proc. Natl. Acad. Sci. USA 105 (2008) 6906–6911.
- [50] S. F. Fenz, R. Merkel, K. Sengupta, Diffusion and intermembrane distance: case study of avidin and E-cadherin mediated adhesion, Langmuir 25 (2009) 1074–85.
- [51] C. Monzel, S. F. Fenz, R. Merkel, K. Sengupta, Probing biomembrane dynamics by dual-wavelength reflection interference contrast microscopy, Chemphyschem 10 (2009) 2828–2838.
- [52] P. Streicher, P. Nassoy, M. Bärmann, A. Dif, V. Marchi-Artzner, F. Brochard-Wyart, J. Spatz, P. Bassereau, Integrin reconstituted in GUVs: a biomimetic system to study initial steps of cell spreading, Biochim Biophys Acta 1788 (2009) 2291–2300.
- [53] A.-S. Smith, S. F. Fenz, K. Sengupta, Inferring spatial organization of bonds within adhesion clusters by exploiting fluctuations of soft interfaces, Europhys. Lett. 89 (2010) 28003.
- [54] S. F. Fenz, T. Bihr, D. Schmidt, R. Merkel, U. Seifert, K. Sengupta, A.-S. Smith, Membrane fluctuations mediate lateral interaction between cadherin bonds, Nat. Phys. 13 (9) (2017) 906–913.
- [55] D. M. Davis, M. L. Dustin, What is the importance of the immunological synapse?, Trends. Immunol. 25 (2004) 323–327.
- [56] C. R. Monks, B. A. Freiberg, H. Kupfer, N. Sciaky, A. Kupfer, Three-dimensional segregation of supramolecular activation clusters in T cells, Nature 395 (1998) 82–86.
- [57] A. Grakoui, S. K. Bromley, C. Sumen, M. M. Davis, A. S. Shaw, P. M. Allen, M. L. Dustin, The immunological synapse: a molecular machine controlling T cell activation, Science 285 (1999) 221–227.
- [58] D. M. Davis, I. Chiu, M. Fassett, G. B. Cohen, O. Mandelboim, J. L. Strominger, The human natural killer cell immune synapse, Proc. Natl. Acad. Sci. USA 96 (26) (1999) 15062–15067.
- [59] F. D. Batista, D. Iber, M. S. Neuberger, B cells acquire antigen from target cells after synapse formation, Nature 411 (6836) (2001) 489–494.
- [60] M. J. Taylor, K. Husain, Z. J. Gartner, S. Mayor, R. D. Vale, A DNA-based T cell receptor reveals a role for receptor clustering in ligand discrimination, Cell 169 (1) (2017) 108–119.e20.
- [61] K. D. Mossman, G. Campi, J. T. Groves, M. L. Dustin, Altered TCR signaling from geometrically repatterned immunological synapses, Science 310 (2005) 1191–1193.
- [62] O. Milstein, S.-Y. Tseng, T. Starr, J. Llodra, A. Nans, M. Liu, M. K. Wild, P. A. van der Merwe, D. L. Stokes, Y. Reisner, M. L. Dustin, Nanoscale increases in CD2-CD48-mediated intermembrane spacing decrease adhesion and reorganize the immunological synapse, J Biol Chem 283 (2008) 34414–34422.
- [63] J. B. Huppa, M. Axmann, M. A. Mörtelmaier, B. F. Lillemeier, E. W. Newell, M. Brameshuber, L. O. Klein, G. J. Schütz, M. M. Davis, TCR-peptide-MHC interactions in situ show accelerated kinetics and increased affinity, Nature 463 (2010) 963–967.
- [64] M. Axmann, J. B. Huppa, M. M. Davis, G. J. Schütz, Determination of interaction kinetics between the T cell receptor and peptide-loaded MHC class II via single-molecule diffusion measurements, Biophys. J. 103 (2012) L17–L19.
- [65] G. P. O’Donoghue, R. M. Pielak, A. A. Smoligovets, J. J. Lin, J. T. Groves, Direct single molecule measurement of TCR triggering by agonist pMHC in living primary T cells, Elife 2 (2013) e00778.
- [66] S. Komura, D. Andelman, Adhesion-induced lateral phase separation in membranes, Eur. Phys. J. E 3 (2000) 259–271.
- [67] R. Bruinsma, A. Behrisch, E. Sackmann, Adhesive switching of membranes: experiment and theory, Phys. Rev. E 61 (2000) 4253–4267.
- [68] S. Y. Qi, J. T. Groves, A. K. Chakraborty, Synaptic pattern formation during cellular recognition, Proc. Natl. Acad. Sci. USA 98 (2001) 6548–6553.
- [69] H.-Y. Chen, Adhesion-induced phase separation of multiple species of membrane junctions, Phys. Rev. E 67 (2003) 031919.
- [70] S. Raychaudhuri, A. K. Chakraborty, M. Kardar, Effective membrane model of the immunological synapse, Phys. Rev. Lett. 91 (2003) 208101.
- [71] D. Coombs, M. Dembo, C. Wofsy, B. Goldstein, Equilibrium thermodynamics of cell-cell adhesion mediated by multiple ligand-receptor pairs, Biophys. J. 86 (2004) 1408–1423.
- [72] V. B. Shenoy, L. B. Freund, Growth and shape stability of a biological membrane adhesion complex in the diffusion-mediated regime, Proc. Natl. Acad. Sci. USA 102 (2005) 3213–3218.
- [73] J.-Y. Wu, H.-Y. Chen, Membrane-adhesion-induced phase separation of two species of junctions, Phys. Rev. E 73 (2006) 011914.
- [74] C.-Z. Zhang, Z.-G. Wang, Nucleation of membrane adhesions, Phys. Rev. E 77 (2008) 021906.
- [75] E. Atilgan, B. Ovryn, Nucleation and growth of integrin adhesions, Biophys J 96 (9) (2009) 3555–72.
- [76] D. Zuckerman, R. Bruinsma, Statistical mechanics of membrane adhesion by reversible molecular bonds, Phys. Rev. Lett. 74 (19) (1995) 3900–3903.
- [77] H. Krobath, G. J. Schütz, R. Lipowsky, T. R. Weikl, Lateral diffusion of receptor-ligand bonds in membrane adhesion zones: Effect of thermal membrane roughness, Europhys. Lett. 78 (2007) 38003.
- [78] T. Speck, E. Reister, U. Seifert, Specific adhesion of membranes: Mapping to an effective bond lattice gas, Phys. Rev. E 82 (2) (2010) 021923.
- [79] N. Weil, O. Farago, Entropy-driven aggregation of adhesion sites of supported membranes, Eur. Phys. J. E 33 (1) (2010) 81–87.
- [80] N. Dharan, O. Farago, Formation of adhesion domains in stressed and confined membranes, Soft Matter 11 (19) (2015) 3780–3785.
- [81] J. Hu, G.-K. Xu, R. Lipowsky, T. R. Weikl, Binding kinetics of membrane-anchored receptors and ligands: Molecular dynamics simulations and theory, J. Chem. Phys 143 (2015) 243137.
- [82] R. Goetz, R. Lipowsky, Computer simulations of bilayer membranes: Self-assembly and interfacial tension, J. Chem. Phys. 108 (1998) 7397–7409.
- [83] J. C. Shillcock, R. Lipowsky, Equilibrium structure and lateral stress distribution of amphiphilic bilayers from dissipative particle dynamics simulations, J. Chem. Phys. 117 (2002) 5048–5061.
- [84] A. Grafmüller, J. Shillcock, R. Lipowsky, Pathway of membrane fusion with two tension-dependent energy barriers, Phys. Rev. Lett. 98 (2007) 218101.
- [85] A. Grafmüller, J. Shillcock, R. Lipowsky, The fusion of membranes and vesicles: pathway and energy barriers from dissipative particle dynamics, Biophys. J. 96 (2009) 2658–2675.
- [86] J. C. Shelley, M. Y. Shelley, R. C. Reeder, S. Bandyopadhyay, M. L. Klein, A coarse grain model for phospholipid simulations, J. Phys. Chem. B 105 (2001) 4464–4470.
- [87] S. J. Marrink, A. H. de Vries, A. E. Mark, Coarse grained model for semiquantitative lipid simulations, J. Phys. Chem. B 108 (2004) 750–760.
- [88] A. Y. Shih, A. Arkhipov, P. L. Freddolino, K. Schulten, Coarse grained protein-lipid model with application to lipoprotein particles, J. Phys. Chem. B. 110 (2006) 3674–3684.
- [89] S. J. Marrink, A. E. Mark, The mechanism of vesicle fusion as revealed by molecular dynamics simulations, J. Am. Chem. Soc. 125 (37) (2003) 11144–11145.
- [90] J. C. Shillcock, R. Lipowsky, Tension-induced fusion of bilayer membranes and vesicles, Nat. Mater. 4 (3) (2005) 225–228.
- [91] Y. G. Smirnova, S.-J. Marrink, R. Lipowsky, V. Knecht, Solvent-exposed tails as prestalk transition states for membrane fusion at low hydration, J. Am. Chem. Soc. 132 (19) (2010) 6710–6718.
- [92] H. J. Risselada, C. Kutzner, H. Grubmueller, Caught in the act: Visualization of SNARE-mediated fusion events in molecular detail, ChemBioChem 12 (7) (2011) 1049–1055.
- [93] G. Illya, R. Lipowsky, J. C. Shillcock, Two-component membrane material properties and domain formation from dissipative particle dynamics, J. Chem. Phys. 125 (11) (2006) 114710.
- [94] H. J. Risselada, S. J. Marrink, The molecular face of lipid rafts in model membranes, Proc. Natl. Acad. Sci. USA 105 (45) (2008) 17367–17372.
- [95] F. J.-M. de Meyer, A. Benjamini, J. M. Rodgers, Y. Misteli, B. Smit, Molecular simulation of the DMPC-cholesterol phase diagram, J. Phys. Chem. B 114 (32) (2010) 10451–10461.
- [96] T. Apajalahti, P. Niemela, P. N. Govindan, M. S. Miettinen, E. Salonen, S.-J. Marrink, I. Vattulainen, Concerted diffusion of lipids in raft-like membranes, Faraday Discuss. 144 (2010) 411–430.
- [97] W. F. D. Bennett, D. P. Tieleman, Computer simulations of lipid membrane domains, Biochim. Biophys. Acta-Biomembr. 1828 (8) (2013) 1765–1776.
- [98] Y. Gambin, R. Lopez-Esparza, M. Reffay, E. Sierecki, N. S. Gov, M. Genest, R. S. Hodges, W. Urbach, Lateral mobility of proteins in liquid membranes revisited, Proc. Natl. Acad. Sci. USA 103 (7) (2006) 2098–2102.
- [99] G. Guigas, M. Weiss, Size-dependent diffusion of membrane inclusions, Biophys. J. 91 (7) (2006) 2393–2398.
- [100] B. J. Reynwar, G. Illya, V. A. Harmandaris, M. M. Müller, K. Kremer, M. Deserno, Aggregation and vesiculation of membrane proteins by curvature-mediated interactions, Nature 447 (2007) 461–464.
- [101] A. Arkhipov, Y. Yin, K. Schulten, Four-scale description of membrane sculpting by BAR domains, Biophys. J. 95 (6) (2008) 2806–2821.
- [102] M. Simunovic, A. Srivastava, G. A. Voth, Linear aggregation of proteins on the membrane as a prelude to membrane remodeling, Proc. Natl. Acad. Sci. USA 110 (51) (2013) 20396–20401.
- [103] A. R. Braun, M. M. Lacy, V. C. Ducas, E. Rhoades, J. N. Sachs, -synuclein-induced membrane remodeling is driven by binding affinity, partition depth, and interleaflet order asymmetry, J. Am. Chem. Soc. 136 (28) (2014) 9962–72.
- [104] R. Dasgupta, M. S. Miettinen, N. Fricke, R. Lipowsky, R. Dimova, The glycolipid GM1 reshapes asymmetric biomembranes and giant vesicles by curvature generation, Proc. Natl. Acad. Sci. USA 115 (22) (2018) 5756–5761.
- [105] B. Kav, Membrane adhesion mediated via lipid-anchored saccharides, Ph.D. thesis, University of Potsdam (2019).
- [106] N. Plattner, S. Doerr, G. De Fabritiis, F. Noe, Complete protein-protein association kinetics in atomic detail revealed by molecular dynamics simulations and markov modelling, Nat. Chem. 9 (10) (2017) 1005–1011.
- [107] F. Paul, C. Wehmeyer, E. T. Abualrous, H. Wu, M. D. Crabtree, J. Schöneberg, J. Clarke, C. Freund, T. R. Weikl, F. Noé, Protein-peptide association kinetics beyond the seconds timescale from atomistic simulations, Nat. Commun. 8 (1) (2017) 1095.
- [108] J. Huang, V. I. Zarnitsyna, B. Liu, L. J. Edwards, N. Jiang, B. D. Evavold, C. Zhu, The kinetics of two-dimensional TCR and pMHC interactions determine T-cell responsiveness, Nature 464 (2010) 932–936.
- [109] P. Robert, A. Nicolas, S. Aranda-Espinoza, P. Bongrand, L. Limozin, Minimal encounter time and separation determine ligand-receptor binding in cell adhesion, Biophys. J. 100 (11) (2011) 2642–2651.
- [110] E. Schneck, B. Deme, C. Gege, M. Tanaka, Membrane adhesion via homophilic saccharide-saccharide interactions investigated by neutron scattering, Biophys. J. 100 (9) (2011) 2151–2159.
- [111] Lipowsky, Zielinska, Binding and unbinding of lipid membranes: A monte carlo study, Phys. Rev. Lett. 62 (13) (1989) 1572–1575.
- [112] U. Seifert, S. A. Langer, Hydrodynamics of membranes - the bilayer aspect and adhesion, Biophys. Chem. 49 (1) (1994) 13–22.
- [113] R. Lipowsky, Generic interactions of flexible membranes. In Handbook of Biological Physics, Vol. 1. R. Lipowsky and E. Sackmann, editors, Elsevier/North Holland, 1995.
- [114] Y. C. Kim, G. Hummer, Coarse-grained models for simulations of multiprotein complexes: application to ubiquitin binding, J. Mol. Biol. 375 (5) (2008) 1416–1433.
- [115] M. L. Dustin, S. K. Bromley, M. M. Davis, C. Zhu, Identification of self through two-dimensional chemistry and synapses, Annu. Rev. Cell Dev. Biol. 17 (2001) 133–157.
- [116] C. E. Orsello, D. A. Lauffenburger, D. A. Hammer, Molecular properties in cell adhesion: a physical and engineering perspective, Trends Biotechnol. 19 (2001) 310–316.
- [117] Y. Wu, J. Vendome, L. Shapiro, A. Ben-Shaul, B. Honig, Transforming binding affinities from three dimensions to two with application to cadherin clustering, Nature 475 (2011) 510–513.
- [118] D. Leckband, S. Sivasankar, Cadherin recognition and adhesion, Curr. Opin. Cell. Biol. 24 (2012) 620–627.
- [119] V. Zarnitsyna, C. Zhu, T cell triggering: insights from 2D kinetics analysis of molecular interactions, Phys. Biol. 9 (4) (2012) 045005.
- [120] Y. Wu, B. Honig, A. Ben-Shaul, Theory and simulations of adhesion receptor dimerization on membrane surfaces, Biophys. J. 104 (6) (2013) 1221–1229.
- [121] P. Schuck, Use of surface plasmon resonance to probe the equilibrium and dynamic aspects of interactions between biological macromolecules, Annu. Rev. Biophys. Biomol. Struct. 26 (1997) 541–566.
- [122] R. L. Rich, D. G. Myszka, Advances in surface plasmon resonance biosensor analysis, Curr. Opin. Biotechnol. 11 (2000) 54–61.
- [123] J. M. McDonnell, Surface plasmon resonance: towards an understanding of the mechanisms of biological molecular recognition, Curr. Opin. Chem. Biol. 5 (2001) 572–577.
- [124] T. R. Weikl, J. Hu, G.-K. Xu, R. Lipowsky, Binding equilibrium and kinetics of membrane-anchored receptors and ligands in cell adhesion: Insights from computational model systems and theory, Cell Adh. Migr. 10 (5) (2016) 576–589.
- [125] G. Campi, R. Varma, M. Dustin, Actin and agonist MHC-peptide complex-dependent T cell receptor microclusters as scaffolds for signaling, J. Exp. Med. 202 (2005) 1031–1036.
- [126] T. Yokosuka, K. Sakata-Sogawa, W. Kobayashi, M. Hiroshima, A. Hashimoto-Tane, M. Tokunaga, M. Dustin, T. Saito, Newly generated T cell receptor microclusters initiate and sustain T cell activation by recruitment of Zap70 and SLP-76, Nat. Immunol. 6 (2005) 1253–1262.
- [127] K. Choudhuri, M. L. Dustin, Signaling microdomains in T cells, FEBS Lett. 584 (2010) 4823–4831.
- [128] N. J. Burroughs, C. Wülfing, Differential segregation in a cell-cell contact interface: the dynamics of the immunological synapse, Biophys. J. 83 (2002) 1784–1796.
- [129] S.-J. E. Lee, Y. Hori, A. K. Chakraborty, Low T cell receptor expression and thermal fluctuations contribute to formation of dynamic multifocal synapses in thymocytes, Proc. Natl. Acad. Sci. USA 100 (2003) 4383–4388.
- [130] M. T. Figge, M. Meyer-Hermann, Geometrically repatterned immunological synapses uncover formation mechanisms, PLoS Comput. Biol. 2 (2006) e171.
- [131] P. K. Tsourkas, M. L. Longo, S. Raychaudhuri, Monte Carlo study of single molecule diffusion can elucidate the mechanism of B cell synapse formation, Biophys. J. 95 (2008) 1118–1125.
- [132] A. L. DeMond, K. D. Mossman, T. Starr, M. L. Dustin, J. T. Groves, T cell receptor microcluster transport through molecular mazes reveals mechanism of translocation, Biophys. J. 94 (2008) 3286–3292.
- [133] E. M. Schmid, M. H. Bakalar, K. Choudhuri, J. Weichsel, H. S. Ann, P. L. Geissler, M. L. Dustin, D. A. Fletcher, Size-dependent protein segregation at membrane interfaces, Nat. Phys. 12 (7) (2016) 704.
- [134] M. J. Paszek, D. Boettiger, V. M. Weaver, D. A. Hammer, Integrin clustering is driven by mechanical resistance from the glycocalyx and the substrate, PLoS Comput. Biol. 5 (12) (2009) e1000604.
- [135] M. J. Paszek, C. C. DuFort, O. Rossier, R. Bainer, J. K. Mouw, K. Godula, J. E. Hudak, J. N. Lakins, A. C. Wijekoon, L. Cassereau, M. G. Rubashkin, M. J. Magbanua, K. S. Thorn, M. W. Davidson, H. S. Rugo, J. W. Park, D. A. Hammer, G. Giannone, C. R. Bertozzi, V. M. Weaver, The cancer glycocalyx mechanically primes integrin-mediated growth and survival, Nature 511 (7509) (2014) 319–325.
- [136] G.-K. Xu, J. Qian, J. Hu, The glycocalyx promotes cooperative binding and clustering of adhesion receptors, Soft Matter 12 (20) (2016) 4572–4583.
- [137] M. Chung, B. J. Koo, S. G. Boxer, Formation and analysis of topographical domains between lipid membranes tethered by DNA hybrids of different lengths, Faraday Discuss. 161 (2013) 333–345.
- [138] T. R. Weikl, D. Andelman, S. Komura, R. Lipowsky, Adhesion of membranes with competing specific and generic interactions, Eur. Phys. J. E 8 (2002) 59–66.
- [139] R. Bruinsma, M. Goulian, P. Pincus, Self-assembly of membrane junctions, Biophys J. 67 (1994) 746–750.
- [140] R. R. Netz, Inclusions in fluctuating membranes: Exact results, J. Phys. I 7 (1997) 833–852.
- [141] O. Farago, Fluctuation-induced attraction between adhesion sites of supported membranes, Phys. Rev. E 81 (5) (2010) 050902.
- [142] T. R. Weikl, R. R. Netz, R. Lipowsky, Unbinding transitions and phase separation of multicomponent membranes, Phys. Rev. E. 62 (2000) R45–R48.
- [143] A. Pierres, A.-M. Benoliel, D. Touchard, P. Bongrand, How cells tiptoe on adhesive surfaces before sticking, Biophys J. 94 (2008) 4114–4122.
- [144] C.-C. Lin, J. Seikowski, A. Pérez-Lara, R. Jahn, C. Höbartner, P. J. Walla, Control of membrane gaps by synaptotagmin-Ca2+ measured with a novel membrane distance ruler, Nat. Commun. 5 (2014) 5859.
- [145] C. Monzel, D. Schmidt, C. Kleusch, D. Kirchenbuechler, U. Seifert, A.-S. Smith, K. Sengupta, R. Merkel, Measuring fast stochastic displacements of bio-membranes with dynamic optical displacement spectroscopy, Nat. Commun. 6 (2015) 8162.