Complementarity of Peculiar Velocity Surveys and Redshift Space Distortions for Testing Gravity
Abstract
Peculiar-velocity surveys of the low-redshift universe have significant leverage to constrain the growth rate of cosmic structure and test gravity. Wide-field imaging surveys combined with multi-object spectrographs (e.g. ZTF2, LSST, DESI, 4MOST) can use Type Ia supernovae as informative tracers of the velocity field, reaching few percent constraints on the growth rate at where density tracers cannot do better than . Combining the high-redshift DESI survey mapping redshift space distortions with a low-redshift supernova peculiar velocity survey using LSST and DESI can determine the gravitational growth index to , testing general relativity. We study the characteristics needed for the peculiar velocity survey, and how its complementarity with clustering surveys improves when going from a CDM model assumption to a – cosmology.
I Introduction
The spatial distribution of large scale structure encodes abundant information on the cosmological model. The inhomogeneous clustering is matched by motions – peculiar velocities – with respect to the cosmic expansion, and this also contains important information. These velocities appear, for example, in redshift space distortions (RSD) whose measurement is a major focus of galaxy surveys such as the Dark Energy Spectroscopic Instrument (DESI DESI Collaboration et al. (2016)). However, RSD maps the velocity field in a statistical sense in that velocities are not determined per object but are inferred through the clustering of objects.
One can also seek to measure peculiar velocities directly from individual objects, and then carry out statistical analysis of the velocity field. This, however, requires accurate separation of the cosmic expansion redshift from the measured redshift, which can be accomplished through measured distances and a tight distance-redshift relation. This is generally only practical at low redshifts where the redshift from velocities is not negligible compared to the cosmic redshift. Such peculiar velocity (PV) surveys have employed distance measurements by the fundamental plane relation for elliptical galaxies (e.g. 6dFGS Adams and Blake (2017) and TAIPAN da Cunha et al. (2017)), and the Tully-Fisher relation for spiral galaxies (e.g. WALLABY+WNSHS Johnston et al. (2008)); recently Type Ia supernova (SN) standardized candles have been considered Gordon et al. (2007); Abate and Lahav (2008); Johnson et al. (2014); Huterer et al. (2015, 2017); Kim et al. (2019).
In the next decade, the Zwicky Transient Facility (ZTF, Bellm et al., 2019), its proposed successor (ZTF-II), and the Large Synoptic Survey Telescope (LSST, Howlett et al., 2017a) will find SNe at , and DESI and 4MOST Swann et al. (2019) can determine accurate redshifts for the host galaxies. With such a number density of distance indicators accurate to perhaps 4-5% each, the velocity field can be mapped with good signal to noise and the cosmic growth rate measured to the equivalent of in each of two redshift bins at and (although there is no need to bin).
This is interesting for cosmology, but especially for testing gravity. That is because the velocity field is an especially robust way to test gravity: density and velocity are simply related by the continuity equation (due to mass conservation), and velocity is proportional to acceleration (in linear perturbation theory) by Euler’s equation for any central force law. Thus these should hold in a wide class of gravity theories. Acceleration is related to density perturbations through Poisson’s equation, and causes the peculiar velocities. Thus peculiar velocities can test the strength of gravity.
In this article we will not assume a particular model of gravity but rather constrain deviations from general relativity in terms of the gravitational growth index Linder (2005). The growth index is an accurate way of expressing deviations in the growth rate for a wide range of gravity theories, as long as they are scale independent on the scales of interest (linear theory) and do not affect the early universe initial conditions Linder and Cahn (2007).
Another robust feature of velocity measurements is that the probes (e.g. galaxies) are merely test particles that lie in and map the velocity field sourced by all matter, including dark matter. This in contrast to overdensity measurements, in which the connection between the baryonic probes (e.g. galaxy light) and dark matter is less direct.
In Sec. II we briefly summarize the survey characteristics and method of using the peculiar velocity power spectrum (and cross-correlation with the matter density power spectrum) to constrain cosmological parameters. We present the results on and other parameters in Sec. III, especially the complementarity with higher redshift RSD surveys. We conclude in Sec. IV.
II Surveys and Method
The properties of peculiar velocity surveys that most strongly determine their sensitivity to the growth of structure are:
-
•
The survey volume: We assume a volume of the shape of a shell defined by its minimum () and maximum () radial distances, and its solid angle (). At small galaxy separations, observed redshifts can be dominated by peculiar rather than cosmological redshifts, a regime that is not well-described by linear theory: we thus adopt an that corresponds to . While source detections are generally based on source magnitude, for convenience we set up to which complete SN Ia telescope follow-up is reasonable and beyond which large velocity uncertainties limit the precision in measuring the growth of structure. We consider that to cover half of the extra-galactic sky, , using both northern and southern hemisphere resources.
-
•
Number density of the probes : While different classes of object may be used as density and velocity probes, in this article we consider one class used for both. For transient probes such as SNe Ia, the density is directly related to the survey duration. We consider a 10-year survey with 0.65 efficiency and a SN-frame rate of Dilday et al. (2010).
-
•
: Intrinsic magnitude dispersion of the probe: A fixed magnitude dispersion transforms into a distance-dependent velocity dispersion through , where is the comoving distance. We consider a value of mag Barone-Nugent et al. (2012); Burns et al. (2014); Fakhouri et al. (2015); Stanishev et al. (2018) that could be achieved using data beyond optical photometry.
-
•
Range of included in the analysis: and are set respectively according to the linear extent of the survey volume and the smallest scales that are confidently modelled. We use /Mpc and /Mpc.
A cosmological model predicts the statistical properties of the spatial distribution and velocities of the probe through the density-density (), velocity-velocity (), and the cross density-velocity () power spectra. In linear perturbation theory, the dark-matter overdensity field can be decomposed into independent temporal and spatial components, where the temporal component is known as the growth function. To first order, , the SN Ia host-galaxy count overdensity power spectrum , and the galaxy-velocity cross-correlation Song and Percival (2009), where , is the bias between the SN hosts and dark matter, and the angle between the lines of sight toward the two galaxies is given by . Note that the commonly used mass fluctuation amplitude is proportional to .
We consider two approaches to extracting cosmological information from the power spectra. For the first approach, is taken to have constant, independent values in a set of redshift bins, and is taken to have a constant value over all redshift bins (stable clustering). The parameter set is then for redshift bins. This model is commonly used to project and report the results of peculiar velocity surveys Howlett et al. (2017b).
The second approach puts the focus on gravity. References Linder (2005); Linder and Cahn (2007) found that provides a highly accurate () description of the growth of structure, where a wide range of gravity models can be described by single values of the growth index . The mass density in units of the critical density, , itself depends on cosmological parameters describing the background expansion; for this article we consider a flat cosmology with the standard dark energy equation of state. The bias is taken to be constant in the narrow redshift range. The density and velocity covariances then depend on the parameter set , where (without an argument) is the mass density today.
We project parameter uncertainties111The code is available at https://github.com/LSSTDESC/SNPeculiarVelocity. using the Fisher information matrix
| (1) |
where
| (2) |
The fiducial cosmology is a CDM model (, ), with , and a power spectrum calculated by CAMB Lewis and Bridle (2002) using its default configuration.
III Results Testing Gravity
From the peculiar velocity survey we have measurements of over . We can compare or combine these with measurements of redshift space distortions from DESI. The precisions that DESI is expected to deliver are listed in Tables 2.3 and 2.5 of DESI Collaboration et al. (2016). Since our main goal here is testing gravity, we only use its measurements (with /Mpc), not the baryon acoustic oscillation measurements. We also emphasize that DESI provides far more cosmological leverage than the growth index constraints we focus on here; in particular, measuring the cosmic growth history over a wide range of redshift as DESI does is highly fundamental and insightful.
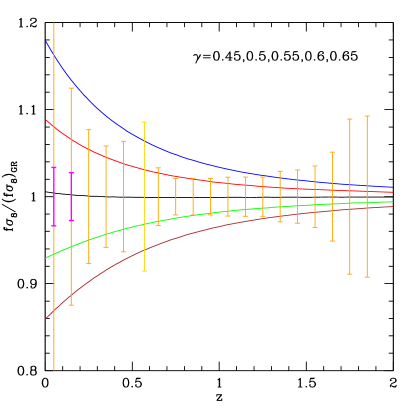
To motivate why low-redshift surveys can be competitive with the huge volumes of high-redshift surveys for the particular goal of measuring , note that as one approaches the matter dominated era the growth rate approaches unity. Since is defined through , then is relatively poorly determined as at higher redshifts. Since and (appropriately normalized) at higher redshifts, the insensitivity to is compounded. However, at low redshift, both and deviate from unity and has increased influence, making low redshift measurements of a good avenue for testing whether is consistent with its general relativity value of 0.55.
Figure 1 illustrates this, plotting for various values of , relative to the general relativity behavior for the same background cosmology. The curves flare out at low redshift, pointing to an opportunity there if the measurement precision can be made reasonable. Overplotted are the expected measurement uncertainties on in redshift bins of width 0.1 from the DESI RSD in the main survey (above ), from the DESI RSD in the Bright Galaxy Survey (BGS; below ), and our baseline peculiar velocity survey, using the first approach of Sec. II.
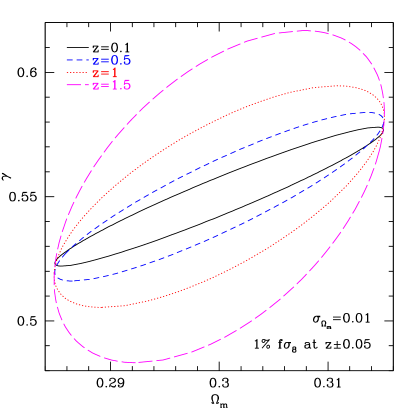
While the curves for give a useful indication of the strength of deviations from general relativity for a given , the observational constraints on will also depend on covariance with other cosmological parameters such as the matter density . The same advantages of low redshift measurements still hold, demonstrated in Fig. 2 with the joint confidence contours on and . This gives a feel for the sensitivity of measurements near particular redshifts, by adopting simply a localized pair of measurements at . (A Gaussian prior of 0.01 on is included for convenience in drawing reasonable confidence contours from only two measurements; we have checked that this does not substantially alter the degeneracy direction.)
Keeping the measurement precision fixed (at 1% for purely illustrative purposes), high-redshift measurements of have less constraining power on than low-redshift ones. Furthermore, the degeneracy direction of the contours slowly rotates with the measurement redshift, becoming more favorable with respect to determining at low redshift. The general degeneracy direction is simple to understand: increasing increases growth, while increasing (essentially decreasing the strength of gravity; see Linder and Cahn (2007)) decreases growth. Thus doing both compensates for each, extending the contour along the positive slope diagonal. At high redshift, since the measurement is less sensitive to , a given change in requires a larger change in , steepening the slope and rotating the contour counterclockwise; for low redshift, the opposite occurs and the clockwise-rotated contour gives tighter constraints on .
Having established that low-redshift peculiar velocity surveys have the potential to help test gravity, we now carry out a full Fisher information matrix analysis of the cosmological and gravity parameter constraints (using the second approach of Sec. II and so without any need to bin measurements of ) enabled by the baseline PV survey of Sec. II, and also that combined with DESI RSD measurements. We consider two cosmological models: CDM characterized by the matter density , and dynamical dark energy characterized by and the dark energy parameters and describing its present equation of state and its time variation. In addition there is the gravitational growth index (and source bias parameter, which is always marginalized over). To roughly represent other cosmological data besides PV and RSD in the DESI-LSST era, we impose a Gaussian prior on of width 0.01.
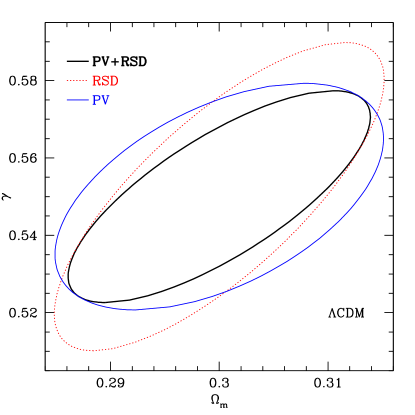
We find that in the CDM model, PV alone determines to 0.019 and RSD alone to 0.026. That is, within this limited focus on testing gravity in the form of (which indeed provides a subpercent accurate fit to the effect of many modified-gravity models on cosmic growth in the linear regime), low-redshift PV can match DESI RSD. Combining the two yields an improvement to . Recall that the distance in between general relativity and gravity or braneworld gravity is respectively.
Figure 3 shows the joint confidence contours in the – plane for these cases. We see that the two dimensional joint confidence contours of PV and RSD are complementary, and the “figure of merit” (inverse area in terms of the inverse square root of the determinant of the – covariance matrix) of the combined confidence region improves by 1.5/1.6 times relative to the individual probes, respectively.
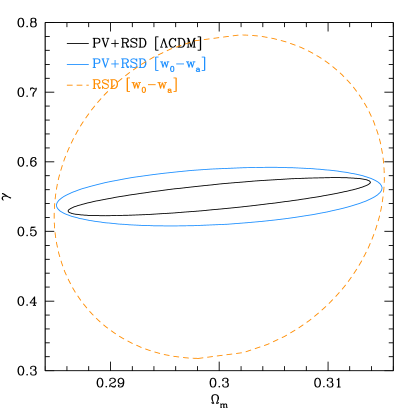
However, when we allow more cosmological freedom as in the – model, the situation is different. The constraints become for DESI RSD but 0.028 for PV+RSD, i.e. peculiar velocities play a crucial role in testing gravity when there is also freedom in the nature of dark energy. Essentially, the PV survey together with the RSD survey allows simultaneous fitting of , , , and with reasonable constraints.
Figure 4 shows that RSD alone has difficulty fitting all the parameters together, but adding PV substantially immunizes against this issue, still allowing reasonable constraints. Now the figure of merit improvement in the – plane for the combined probes is a factor of 2.6/5.8 respectively. Alternately, one could say that allowing going beyond a CDM background blows up the – contour for RSD alone by a factor 8.9, but increases the area for PV+RSD by only a factor 2.4, as shown by the black contour going to the blue one.
If modeling allows accurate use of modes out to /Mpc instead, then the combination of PV+RSD can determine to 0.015 (0.019) in the CDM (–) cosmology case. The figure of merit improvement in the – plane with the higher is a factor of 2.0 (1.5). All the results are summarized in Table 1.
| Model | Data | FOM | FOM | ||
|---|---|---|---|---|---|
| CDM | PV | 0.0193 | 6064 | 0.0156 | 8288 |
| CDM | RSD | 0.0262 | 5891 | 0.0214 | 12267 |
| CDM | PV+RSD | 0.0180 | 9208 | 0.0153 | 17975 |
| - | PV | 0.0691 | 1466 | 0.0491 | 2088 |
| - | RSD | 0.153 | 659 | 0.0707 | 1467 |
| - | PV+RSD | 0.0277 | 3828 | 0.0195 | 5852 |
IV Conclusions
Peculiar velocities provide a direct measurement of the growth of structure, and hence serve as a powerful probe of the gravitational forces responsible for the clustering and motion within the expanding Universe. At low redshift, peculiar velocities can be measured from individual galaxies whose distances are accurately measured, e.g. through Type Ia supernovae. At high redshift, the imprint of peculiar velocities creates a specific anisotropy in the correlation functions of the redshift-space coordinates of ensembles of galaxies.
Each approach can provide constraints on the growth index that can distinguish classes of gravity. A distinguishing feature of direct peculiar velocities is that precise measurements are confined to low redshift, but here the sensitivity to “flares” in enhancement, while higher redshift RSD measurements are more sensitive to than (since as then is poorly determined). The two methods therefore have great complementarity in testing gravity. This advantage strengthens further when becomes more flexible in models that go beyond CDM.
The upcoming generation of redshift and transient object surveys will give exciting data sets that can be used in these ways. Cadenced multi-band imaging surveys such as ZTF-2 and LSST can provide near-full sky, complete low-redshift SN discoveries and light curves used to obtain host distances. Wide-field multi-object spectrographs such as DESI and 4MOST can follow-up these discoveries to get multiplexed transient classifications and redshifts; the use of these instruments for peculiar velocities is being considered by the DESI Collaboration and in the 4MOST Hemisphere Survey proposal. Other 2-4m class facilities can provide supplemental near infrared and spectroscopic data to improve the data set Lantz et al. (2004); Rigault (2019). A coordinated effort is required to organize the diverse range of facilities that comprise a complete peculiar-velocity survey.
We projected cosmology and gravity constraints with two approaches, using and going directly to the gravitational growth index . The Fisher code for dealing with peculiar velocity surveys is publicly available. The results highlight the significant complementarity between peculiar velocity and redshift space distortion surveys, especially as the dark energy properties are fit simultaneously. Testing gravity with appears achievable. Further improvements are possible if our understanding of perturbation theory allows use of smaller scale modes, with figure of merit increases of 1.5–2. Any sign of deviation of the value of from general relativity would then motivate more detailed analysis with more sophisticated tests of how gravity behaves on cosmic scales.
Acknowledgments
We thank Arman Shafieloo and KASI for hospitality during part of this work and Yong-Seon Song for helpful conversations. This work is supported in part by the U.S. Department of Energy, Office of Science, Office of High Energy Physics, under Award DE-SC-0007867 and contract no. DE-AC02-05CH11231, and by the Energetic Cosmos Laboratory.
References
- DESI Collaboration et al. (2016) DESI Collaboration, Amir Aghamousa, Jessica Aguilar, Steve Ahlen, Shadab Alam, Lori E. Allen, et al., “The DESI Experiment Part I: Science,Targeting, and Survey Design,” arXiv e-prints , arXiv:1611.00036 (2016), arXiv:1611.00036 [astro-ph.IM] .
- Adams and Blake (2017) Caitlin Adams and Chris Blake, “Improving constraints on the growth rate of structure by modelling the density-velocity cross-correlation in the 6dF Galaxy Survey,” MNRAS 471, 839–856 (2017), arXiv:1706.05205 [astro-ph.CO] .
- da Cunha et al. (2017) Elisabete da Cunha, Andrew M. Hopkins, Matthew Colless, Edward N. Taylor, Chris Blake, et al., “The Taipan Galaxy Survey: Scientific Goals and Observing Strategy,” Publications of the Astronomical Society of Australia 34, e047 (2017).
- Johnston et al. (2008) S. Johnston, R. Taylor, M. Bailes, N. Bartel, C. Baugh, et al., “Science with ASKAP. The Australian square-kilometre-array pathfinder,” Experimental Astronomy 22, 151–273 (2008), arXiv:0810.5187 [astro-ph] .
- Gordon et al. (2007) C. Gordon, K. Land, and A. Slosar, “Cosmological constraints from type ia supernovae peculiar velocity measurements,” Phys. Rev. Lett. 99, 081301 (2007).
- Abate and Lahav (2008) Alexandra Abate and Ofer Lahav, “The three faces of : testing gravity with low- and high-redshift SNe Ia surveys,” MNRAS 389, L47–L51 (2008), arXiv:0805.3160 [astro-ph] .
- Johnson et al. (2014) Andrew Johnson, Chris Blake, Jun Koda, Yin-Zhe Ma, Matthew Colless, Martin Crocce, Tamara M. Davis, Heath Jones, Christina Magoulas, John R. Lucey, Jeremy Mould, Morag I. Scrimgeour, and Christopher M. Springob, “The 6dF Galaxy Survey: cosmological constraints from the velocity power spectrum,” MNRAS 444, 3926–3947 (2014), arXiv:1404.3799 [astro-ph.CO] .
- Huterer et al. (2015) D. Huterer, D. L. Shafer, and F. Schmidt, “No evidence for bulk velocity from type Ia supernovae,” JCAP 12, 033 (2015), arXiv:1509.04708 .
- Huterer et al. (2017) D. Huterer, D. L. Shafer, D. M. Scolnic, and F. Schmidt, “Testing CDM at the lowest redshifts with SN Ia and galaxy velocities,” JCAP 5, 015 (2017), arXiv:1611.09862 .
- Kim et al. (2019) Alex Kim, G. Aldering, P. Antilogus, A. Bahmanyar, S. BenZvi, et al., “Testing Gravity Using Type Ia Supernovae Discovered by Next-Generation Wide-Field Imaging Surveys,” BAAS 51, 140 (2019), arXiv:1903.07652 [astro-ph.CO] .
- Bellm et al. (2019) E. C. Bellm, S. R. Kulkarni, M. J. Graham, R. Dekany, R. M. Smith, et al., “The Zwicky Transient Facility: System Overview, Performance, and First Results,” PASP 131, 018002 (2019), arXiv:1902.01932 [astro-ph.IM] .
- Howlett et al. (2017a) Cullan Howlett, Aaron S. G. Robotham, Claudia D. P. Lagos, and Alex G. Kim, “Measuring the Growth Rate of Structure with Type IA Supernovae from LSST,” ApJ 847, 128 (2017a), arXiv:1708.08236 [astro-ph.CO] .
- Swann et al. (2019) E. Swann, M. Sullivan, J. Carrick, S. Hoenig, I. Hook, R. Kotak, K. Maguire, R. McMahon, R. Nichol, and S. Smartt, “4MOST Consortium Survey 10: The Time-Domain Extragalactic Survey (TiDES),” The Messenger 175, 58–61 (2019), arXiv:1903.02476 [astro-ph.IM] .
- Linder (2005) Eric V. Linder, “Cosmic growth history and expansion history,” Phys. Rev. D 72, 043529 (2005), arXiv:astro-ph/0507263 [astro-ph] .
- Linder and Cahn (2007) E. V. Linder and R. N. Cahn, “Parameterized beyond-Einstein growth,” Astroparticle Physics 28, 481–488 (2007), astro-ph/0701317 .
- Dilday et al. (2010) B. Dilday, M. Smith, B. Bassett, A. Becker, R. Bender, et al., “Measurements of the Rate of Type Ia Supernovae at Redshift from the Sloan Digital Sky Survey II Supernova Survey,” ApJ 713, 1026–1036 (2010), arXiv:1001.4995 [astro-ph.CO] .
- Barone-Nugent et al. (2012) R. L. Barone-Nugent, C. Lidman, J. S. B. Wyithe, J. Mould, D. A. Howell, et al., “Near-infrared observations of Type Ia supernovae: the best known standard candle for cosmology,” MNRAS 425, 1007–1012 (2012), arXiv:1204.2308 [astro-ph.CO] .
- Burns et al. (2014) C. R. Burns, M. Stritzinger, M. M. Phillips, E. Y. Hsiao, C. Contreras, S. E. Persson, G. Folatelli, L. Boldt, A. Campillay, S. Castellón, W. L. Freedman, B. F. Madore, N. Morrell, F. Salgado, and N. B. Suntzeff, “The Carnegie Supernova Project: Intrinsic Colors of Type Ia Supernovae,” ApJ 789, 32 (2014), arXiv:1405.3934 .
- Fakhouri et al. (2015) H. K. Fakhouri, K. Boone, G. Aldering, P. Antilogus, C. Aragon, et al., “Improving Cosmological Distance Measurements Using Twin Type Ia Supernovae,” ApJ 815, 58 (2015), arXiv:1511.01102 .
- Stanishev et al. (2018) V. Stanishev, A. Goobar, R. Amanullah, B. Bassett, Y. T. Fantaye, P. Garnavich, R. Hlozek, J. Nordin, P. M. Okouma, L. Östman, M. Sako, R. Scalzo, and M. Smith, “Type Ia supernova Hubble diagram with near-infrared and optical observations,” A&A 615, A45 (2018).
- Song and Percival (2009) Yong-Seon Song and Will J. Percival, “Reconstructing the history of structure formation using redshift distortions,” J. Cosmology Astropart. Phys 2009, 004 (2009), arXiv:0807.0810 [astro-ph] .
- Howlett et al. (2017b) Cullan Howlett, Lister Staveley-Smith, and Chris Blake, “Cosmological forecasts for combined and next-generation peculiar velocity surveys,” MNRAS 464, 2517–2544 (2017b), arXiv:1609.08247 [astro-ph.CO] .
- Lewis and Bridle (2002) Antony Lewis and Sarah Bridle, “Cosmological parameters from CMB and other data: A Monte Carlo approach,” Phys. Rev. D 66, 103511 (2002), arXiv:astro-ph/0205436 [astro-ph] .
- Lantz et al. (2004) B. Lantz, G. Aldering, P. Antilogus, C. Bonnaud, L. Capoani, A. Castera, Y. Copin, D. Dubet, E. Gangler, F. Henault, J.-P. Lemonnier, R. Pain, A. Pecontal, E. Pecontal, and G. Smadja, “SNIFS: a wideband integral field spectrograph with microlens arrays,” Society of Photo-Optical Instrumentation Engineers (SPIE) Conference Series, Proc. SPIE Presented at the Society of Photo-Optical Instrumentation Engineers (SPIE) Conference, 5249, 146–155 (2004).
- Rigault (2019) Mickael Rigault, “The SEDMachine: automatic observations and classifications of ZTF Transients,” in The Extragalactic Explosive Universe: the New Era of Transient Surveys and Data-Driven Discovery (2019) p. 42.