Baryonic clues to the puzzling diversity of dwarf galaxy rotation curves
Abstract
We use a compilation of disc galaxy rotation curves to assess the role of the luminous component (“baryons”) in the rotation curve diversity problem. As in earlier work, we find that rotation curve shape correlates with baryonic surface density: high surface density galaxies have rapidly-rising rotation curves consistent with cuspy cold dark matter halos; slowly-rising rotation curves (characteristic of galaxies with inner mass deficits or “cores”) occur only in low surface density galaxies. The correlation, however, seems too weak to be the main driver of the diversity. In addition, dwarf galaxies exhibit a clear trend, from “cuspy” systems where baryons are unimportant in the inner mass budget to “cored” galaxies where baryons actually dominate. This trend constrains the various scenarios proposed to explain the diversity, such as (i) baryonic inflows and outflows during galaxy formation; (ii) dark matter self-interactions; (iii) variations in the baryonic mass structure coupled to rotation velocities through the “mass discrepancy-acceleration relation” (MDAR); or (iv) non-circular motions in gaseous discs. Together with analytical modeling and cosmological hydrodynamical simulations, our analysis shows that each of these scenarios has promising features, but none seems to fully account for the observed diversity. The MDAR, in particular, is inconsistent with the observed trend between rotation curve shape and baryonic importance; either the trend is caused by systematic errors in the data or the MDAR does not apply. The origin of the dwarf galaxy rotation curve diversity and its relation to the structure of cold dark matter halos remains an open issue.
keywords:
galaxies: dwarf – evolution – formation – haloes cosmology: theory – dark matter1 Introduction
The non-linear structure of dark matter halos is a solid prediction of the Lambda Cold Dark Matter (LCDM) paradigm for structure formation. Numerical “dark-matter-only” (hereafter, DMO) simulations have consistently shown that the density profiles of LCDM halos are approximately self-similar, so that the full mass profile of a halo depends on a single parameter, such as the virial111We define the virial quantities of a system as those defined by a mean density of the critical density for closure. Virial parameters are identified by a “200” subscript. mass of the system (Navarro et al., 1996b, 1997, hereafter, NFW). This prediction may be contrasted with observation using the rotation curves of dark matter-dominated systems, such as dwarf galaxies.
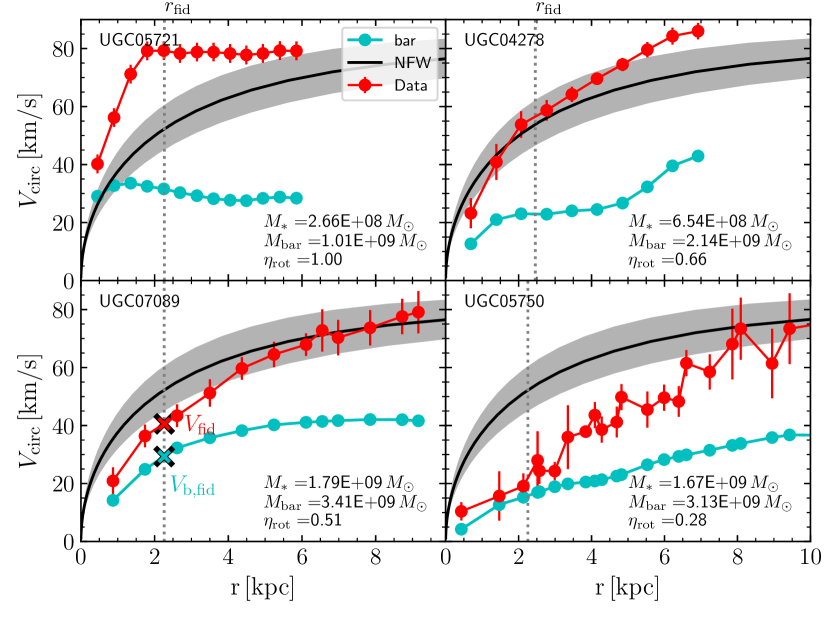
In LCDM, dwarf galaxy rotation curve shapes are expected to be nearly identical for systems with similar maximum circular velocity, , which is a reliable proxy for the halo virial mass. Observed rotation curves, however, deviate from this simple prediction, and show great diversity at fixed . We illustrate this in Fig. 1, where the rotation curves of galaxies with km/s are compared with the circular velocity profile of a Navarro-Frenk-White (NFW) halo with parameters as expected for a Planck-normalized LCDM cosmology (Ludlow et al., 2016).
All of these galaxies are heavily dark matter dominated in the outskirts, where they reach approximately the same , but the shapes of their rotation curves vary greatly. Although UGC 04278 (top-right panel in Fig. 1) follows roughly the expected NFW circular velocity profile, the other three deviate from this prediction. Rotation curves that rise more sharply than the NFW curve (UGC 05721; top-left) are not unexpected, and may arise, in principle, from the accumulation of baryons (i.e., stars plus gas) in the inner regions and the ensuing contraction of the halo.
On the other hand, the two galaxies in the bottom panels of Fig. 1 are more problematic, as they have inner velocities well below the expected values. This implies a sizable “inner deficit” of matter relative to LCDM, a feature that is often associated with a constant-density “core” in the dark matter distribution. These two galaxies are thus clear examples of the well-known “cusp-core” controversy (Moore, 1994; Flores & Primack, 1994; de Blok et al., 2001; Gentile et al., 2004; de Blok, 2010), which, as argued by Oman et al. (2015), is best characterized as an inner mass deficit relative to the LCDM predictions. Note that this deficit affects only some galaxies, and that others are actually quite consistent with LCDM, at least according to this measure.
The origin of the diversity illustrated in Fig. 1 is still unclear, and has elicited a number of proposals that are being actively debated in the literature. These proposals may be grouped into four broad categories. One is that the diversity is caused by the effects of baryonic inflows and outflows during the formation of the galaxy, which lead to gravitational potential fluctuations that may rearrange the inner dark matter profiles (see; e.g., Navarro et al., 1996a; Read & Gilmore, 2005; Mashchenko et al., 2006; Brook et al., 2012; Governato et al., 2012; Pontzen & Governato, 2012; Chan et al., 2015). In this scenario, “cores” are created by feedback-driven blowouts that remove baryons from the inner regions, leading to a reduction of the inner dark matter content. These cores can, in principle, be reversed, and dark matter cusps may be recreated by subsequent baryonic (or dark) mass infall (Laporte & Penarrubia, 2015; Tollet et al., 2016; Benítez-Llambay et al., 2019). This “baryon-induced cores and cusps” mechanism (hereafter BICC, for short) offers in principle an appealing potential explanation for the observed diversity.
A second scenario argues that dark matter self-interactions are responsible for “heating up” the inner regions of a CDM halo into a core, thus reducing the central densities and allowing for slowly-rising rotation curves such as those in the bottom panels of Fig. 1 (Spergel & Steinhardt, 2000). Galaxies with rapidly-rising rotation curves are more difficult to accommodate in this self-interacting dark matter scenario (hereafter SIDM), where they are ascribed to either systems that were originally so dense that the resulting core is negligibly small, or to systems where the central baryonic potential is deep enough to affect the SIDM density profile (e.g., Rocha et al., 2013; Kaplinghat et al., 2016; Kamada et al., 2017; Ren et al., 2019).
A third possibility is that the diversity is generated by variations in the spatial distribution of the baryonic component. Indeed, it has been argued that galaxy rotation speeds at all radii may be inferred directly from the baryonic matter distribution via the “mass discrepancy-acceleration relation” (hereafter, MDAR222This relation is also known as the “radial acceleration relation”, or RAR., McGaugh2004; McGaugh et al., 2016; Lelli et al., 2016). In this scenario the radial acceleration associated with circular motion, , is linked to the baryonic contribution to such acceleration, , through a simple function, , with small scatter. Thus, the diversity in the rotation curve shapes would result simply from the diverse contribution of baryons to the acceleration in the inner regions of galaxies with similar .
Finally, the possibility has been raised that, at least in part, the diversity may be due to uncertainties in the circular velocities inferred from observations. The recent work of Marasco et al. (2018) and Oman et al. (2019) argues that the triaxiality of the dark matter halo may induce non-circular (i.e., elliptical) closed orbits in gaseous discs (see also Hayashi & Navarro, 2006). Depending on how the kinematic principal axes of a particular galaxy are aligned relative to the major and minor axes of the orbital ellipses, the inferred velocities may over- or under-estimate the true circular velocity, sometimes by large amounts. This could also, in principle, explain the observed diversity.
How can we tell these scenarios apart? The papers cited in the above discussion have already shown that each of these mechanisms can, in principle, modify the LCDM mass profiles enough to account for the observed diversity. Therefore, assessing the viability of each of these scenarios must rely on a more detailed elaboration of their predictions as well as on the use of ancillary data and diagnostics. This is what we attempt in the present paper, where we use cosmological hydrodynamical simulations of galaxy formation in these scenarios, as well as a more detailed analysis of the role of baryons on different measures of rotation curve diversity to gauge the success of each of the above scenarios.
We begin with a brief description of the observational datasets (Sec. 2), followed by a description of the cosmological simulations adopted for our analysis (Sec. 3). We present our main results in Sec. 4, and summarize our main conclusions in Sec. 5.
As we were preparing this paper for submission, we became aware of a recent preprint by Kaplinghat et al. (2019), who analyze many of the same issues we address here. Some of our conclusions agree with theirs, others do not. We discuss briefly similarities and differences in Sec. 5.
2 Observational data
Our compilation of rotation curves from the literature includes datasets from the Spitzer Photometry & Accurate Rotation Curves project (SPARC; Lelli et al., 2016); from The HI Nearby Galaxy Survey (THINGS; de Blok et al., 2008); from the Local Irregulars That Trace Luminosity Extremes, The HI Nearby Galaxy Survey (LITTLE THINGS ; Oh et al., 2015); as well as from the work of Adams et al. (2014) and Relatores et al. (2019).
All rotation curves in this compilation were inferred from high-resolution HI and/or H velocity fields, and include asymmetric drift corrections when needed. In all cases the velocity field data has been combined with photometry to construct mass models that include the stellar, gaseous, and dark matter components. In particular, the SPARC, THINGS and LITTLE THINGS data make use of Spitzer 3.6m surface photometry, while Adams et al. (2014) and Relatores et al. (2019) use -band images from a variety of sources. If the same galaxy is common to more than one survey, we adopt the SPARC data, because the majority of galaxies in our sample come from that compilation.
To minimize the inclusion of rotation curves that might be affected by substantial uncertainty we only consider galaxies with inclinations , and omit the “grade=3” galaxies of Relatores et al. (2019). (We refer the reader to that paper for details.) Furthermore, as our analysis relies on comparing rotation velocities in the inner and outer regions, we retain only systems whose rotation curves cover a relatively wide radial range. More specifically, we retain only systems where the last measured point of the rotation curve () is at least twice as far from the centre as a “fiducial” inner radius, defined as
| (1) |
We note that in most cases , and that the scaling of with ensures that the ratio (where ) is a simple but reliable indicator of the shape of the rotation curve for dwarf and massive galaxies alike. Rapidly-rising rotation curves have high values of , approaching unity for rotation curves that remain approximately flat from the inner to the outermost regions.
Because sharply-rising rotation curves are expected from cuspy dark matter profiles, we shall at times loosely refer to rotation curves with as “cuspy”. On the other hand, systems with have very slowly-rising rotation curves, consistent with “cores”. We shall occasionally refer to such systems as having “cored” mass profiles or “cored” rotation curves.
Our compilation retains a total of 160 galaxies, spanning a wide range in (from to km/s ) and in stellar mass (from to ). Our analysis makes use of published mass models, which include the combined gravitational effect of gas and stars –which we shall hereafter refer to as “baryons”–, on the rotation curve. In practice, we shall use , where the latter two terms are the contributions to the circular velocity of gas and stars reported in the literature. We have also computed baryonic half-mass radii, , assuming spherical symmetry (i.e., ) and that the baryonic component does not extend beyond .
When necessary, we estimate virial masses, , for each system assuming an NFW profile of the same maximum circular velocity and a concentration parameter, , taken from Ludlow et al. (2016)’s median relation. We list, for each galaxy in our sample, the specific structural and velocity parameters used in our analysis in Table 1. Although this compilation contains most galaxies with high-quality rotation curves inferred from 2D velocity fields, it is important to note that our sample may be subject to substantial selection biases that are not easy to quantify. We shall hereafter assume that these galaxies are representative of the galaxy population as a whole, but this is an assumption that may require revision once better, more complete datasets become available.
3 Numerical simulations
3.1 LCDM simulations: EAGLE/APOSTLE
The APOSTLE project is a set of twelve zoom-in simulations of “Local Group”-like regions selected from a 1003 Mpc3 DMO cosmological box run in a WMAP-7 cosmology. These Local Group (LG) regions are defined by the presence of a pair of halos that meet mass, relative velocity, and isolation criteria that match observed constraints on the Milky Way-Andromeda pair (Fattahi et al., 2016; Sawala et al., 2016). These LG volumes have been run at three different levels of resolution. We shall use for this analysis the highest-resolution set (labelled “AP-L1”), with particle masses , and a maximum physical gravitational softening length of pc. Our analysis will use isolated (i.e., not satellites) systems found at within Mpc from the barycentre of the two main galaxies in each volume.
The APOSTLE simulations were run with the EAGLE (Evolution and Assembly of GaLaxies and their Environments) galaxy formation code (Schaye et al., 2015; Crain et al., 2015), which includes radiative cooling, star formation, stellar feedback, black hole growth and active galactic nuclei (AGN) feedback (the latter negligible for LG galaxies). In particular, star formation assumes a metallicity-dependent density threshold (Schaye, 2004) of the form
| (2) |
where cm-3, cm-3, , and . Stellar feedback mimicking the effects of stellar winds, radiation pressure and supernova explosions is accounted for using a stochastic, thermal prescription (Dalla Vecchia & Schaye, 2012).
3.2 LCDM simulations: NIHAO
The NIHAO (Numerical Investigation of a Hundred Astrophysical Objects) project is a set of 100 cosmological zoom-in hydrodynamical simulations of isolated galaxies performed using the ESF-Gasoline2 code (Wadsley et al., 2004; Wang et al., 2015) and run in a flat LCDM cosmology with parameters from Planck Collaboration et al. (2014). These simulations span a wide range of halo virial masses, from to . All NIHAO have spatial resolution high enough to resolve the mass profile of all systems reliably down to of the virial radius. Particle masses scale with halo virial mass so that all halos are resolved with similar numbers of particles. As an example, they are and for a 10 halo.
Subgrid physics include a recipe for star formation that matches the Kennicutt-Schmidt Law in regions with a temperature below K and density above a threshold, cm-3. The algorithm includes stellar feedback from supernovae (implemented through a blast-wave formalism; Stinson et al., 2006) and from massive stars prior to their explosion as SNe (“early stellar feedback”; Stinson et al., 2013).
The star formation and feedback algorithms are such that NIHAO dark matter halos can expand to form cores, with the degree of expansion depending mainly on the stellar-to-halo mass ratio (Tollet et al., 2016; Dutton et al., 2016, 2019a). As a result, NIHAO galaxies show a fairly wide diversity of rotation curves, as discussed by Santos-Santos et al. (2018).
3.3 LCDM simulations: EAGLE-CHT10
This simulation series, first presented in Benítez-Llambay et al. (2019), evolves cosmological boxes Mpc on a side, and are run with the same code and cosmology as the EAGLE/APOSTLE project (see Sec. 3.1). The main difference is that they adopt a higher threshold for star formation, independent of metallicity. In this paper we consider a run with constant cm-3, which is roughly higher than that used in APOSTLE. Mass resolution is given by and . As reported in Benítez-Llambay et al. (2019), a higher star formation threshold allows gas to collapse and become gravitationally dominant at the centre of a halo. Baryonic outflows driven by supernova feedback are then able to modify the inner DM density profile, just as in the NIHAO simulations, which adopt a similar value of .
3.4 SIDM simulations: SIDM10
We use two re-simulations of one of the APOSTLE volumes (AP01-L1 in the notation of Fattahi et al., 2016). One re-simulation is dark-matter-only, the other includes the same subgrid physical treatment of star formation and feedback as APOSTLE, except that it uses the EAGLE-Recal model parameters rather than the EAGLE-Ref parameters that were used in the APOSTLE runs (Lovell et al., 2020). Mass and spatial resolution are the same as in that series (Sec. 3.1). The only difference is that the EAGLE code has been modified to include a collisional term for dark matter particle pairwise interactions in order to model the effects of a =10 cm2/g velocity-independent self-interaction cross section. The code modifications are described in detail in Robertson et al. (2017, 2018).
4 Results
4.1 Rotation curve diversity: Observational results
4.1.1 Rotation curve shape vs mass
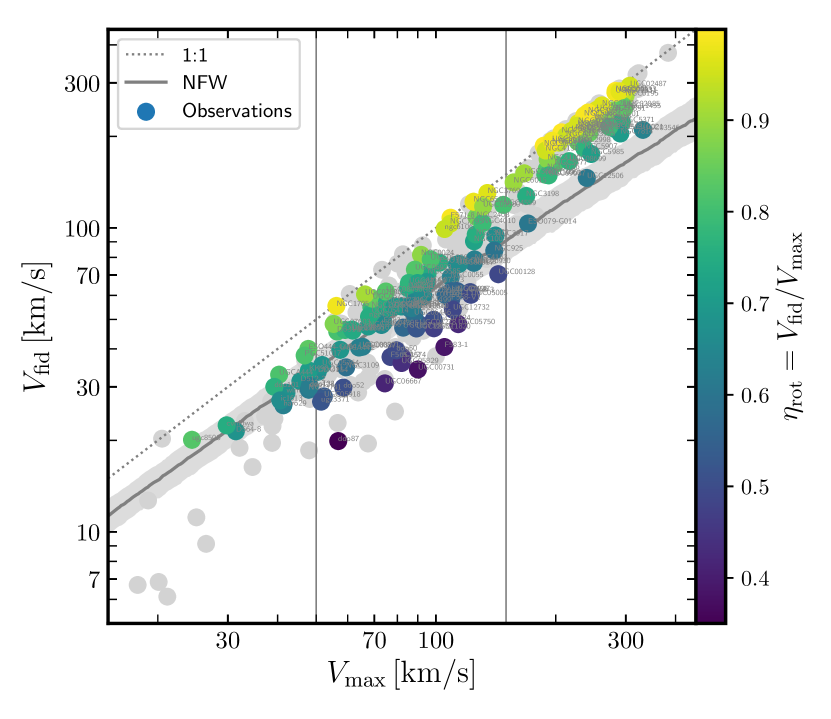
The parameter is a useful measure of the shape of a rotation curve. It contrasts the measured rotation speeds in the inner regions of the galaxy () with the maximum rotation speed (), which is generally similar to the velocity at the outermost measured point, . We note that in some cases the rotation curve may still be rising at the last measured point, in which case may be underestimated. This, however, should have a relatively minor effect on because a change in would lead to a change in the inner fiducial radius, (see eq. 1). Recall as well that we only retain systems where , which should minimize any bias introduced by this effect.
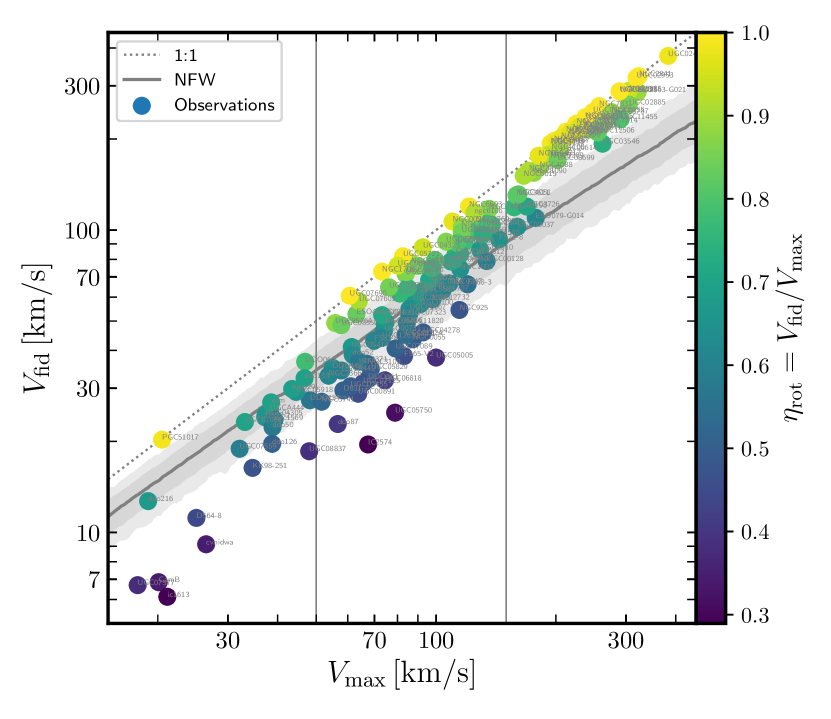
The scaling of with means that our measure of the inner rotation curve adjusts to the total mass of a system. This is preferable to using a fixed physical radius, and allows for a proper comparison of the inner and outer regions of the rotation curve of a galaxy, regardless of mass. For LCDM halos, is in the rising part of the circular velocity curve, and one would expect a roughly constant value of . We plot these two parameters for all galaxies in our sample in Fig. 2.
Fig. 2 illustrates a few interesting points. One is that the evidence for “cores”, defined by an inner mass deficit relative to LCDM at , affects only a fraction of all galaxies and is restricted to dwarf systems. Indeed, no galaxy with km/s is found below the grey shaded band that tracks the expected loci of dark matter halos in LCDM. Most massive galaxies closely hug the 1:1 line, suggesting rotation curves that rise actually more rapidly than expected for LCDM halos and stay flat out to their last measured radius. As we shall discuss below (Sec. 4.1.3), this is due to the effect of baryons, which accumulate at the centre and drive the circular velocity at to higher values than expected from the dark matter alone.
Galaxies with km/s, on the other hand, show a wide diversity of rotation curve shapes, from rapidly-rising, nearly flat rotation curve galaxies near the dotted 1:1 line, to very slowly-rising curves well below the grey band. The latter are systems where the evidence for an inner mass deficit, or a “core”, is most compelling.
As discussed in Sec. 1, four different scenarios have been proposed to explain the rotation curve diversity illustrated in Fig. 2; identifying which one is most consistent with existing data is the main goal of this paper. Since baryons play an important role in several of the proposed scenarios, it is important to check how the diversity correlates with the gravitational contribution of baryons. We discuss this next.
4.1.2 Rotation curve shape and baryon surface density
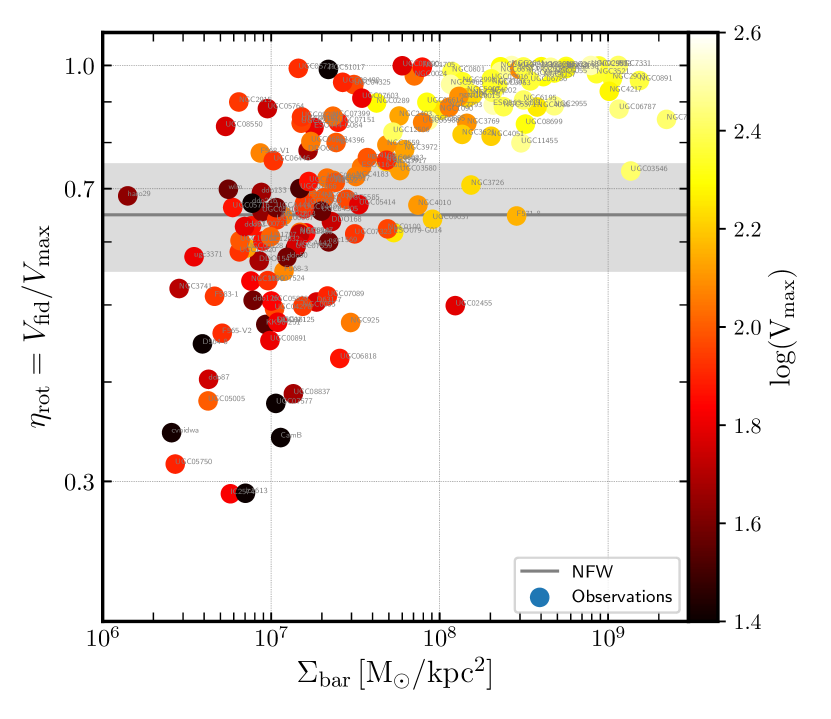
The role of baryons in determining the shape of the rotation curve has long been predicated on the basis that the shape of the inner rotation curve seems to correlate with galaxy surface brightness (e.g., de Blok et al., 1996; Swaters et al., 2009, 2012; Lelli et al., 2013). We shall use here baryonic surface density rather than (stellar) surface brightness since baryons are mainly in gaseous form in many galaxies of our sample. We explore this in Fig. 3, where we plot the rotation curve shape parameter, , as a function of the “effective” baryonic surface mass density, . ( and are the total baryonic mass and half-mass radius of a galaxy, respectively.)
There is indeed a correlation between and , but it is largely a reflection of the galaxy mass-surface density relation: massive galaxies (none of which have cores, as discussed in the previous subsection) have higher surface density than dwarfs (some of which have cores and others which do not). Aside from this overall trend, when considering only dwarfs (i.e., km/s) Fig. 3 shows that the correlation between and is rather weak. Although all “cored” galaxies (i.e., ) are low surface density systems, the converse is not true: there are indeed a number of low surface density galaxies with “cuspy” rotation curves. Baryonic surface density alone is thus not a reliable indicator of the presence of a core or cusp in a dwarf galaxy and, therefore, unlikely to be the origin of the diversity. This is an issue to which we will return repeatedly throughout our discussion below.
4.1.3 Rotation curve shape and baryon central dominance
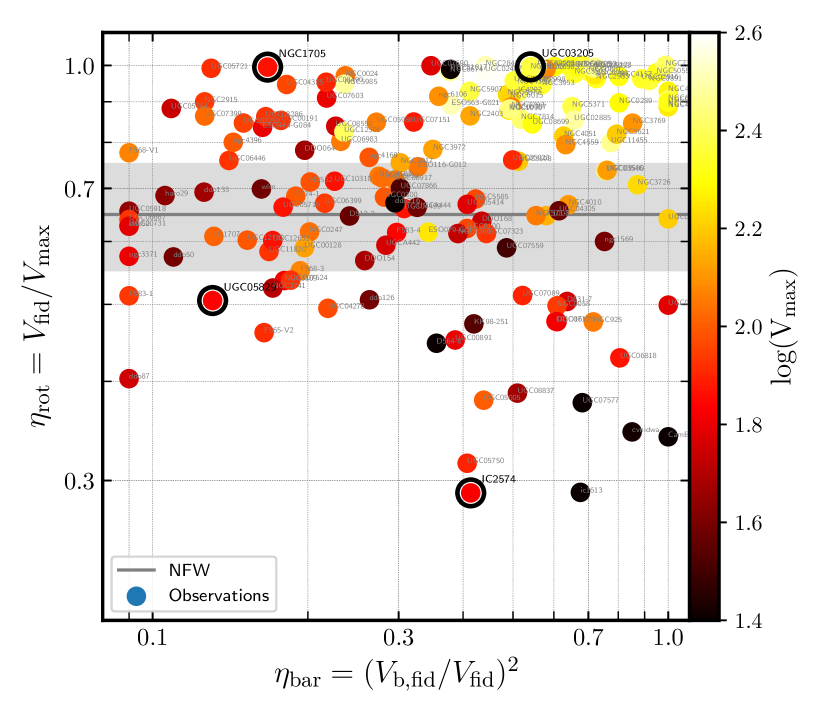
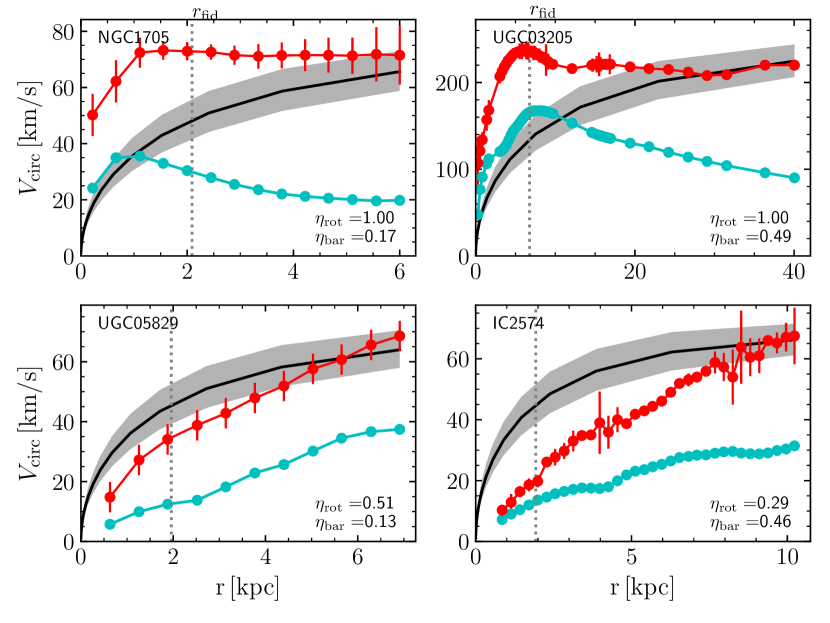
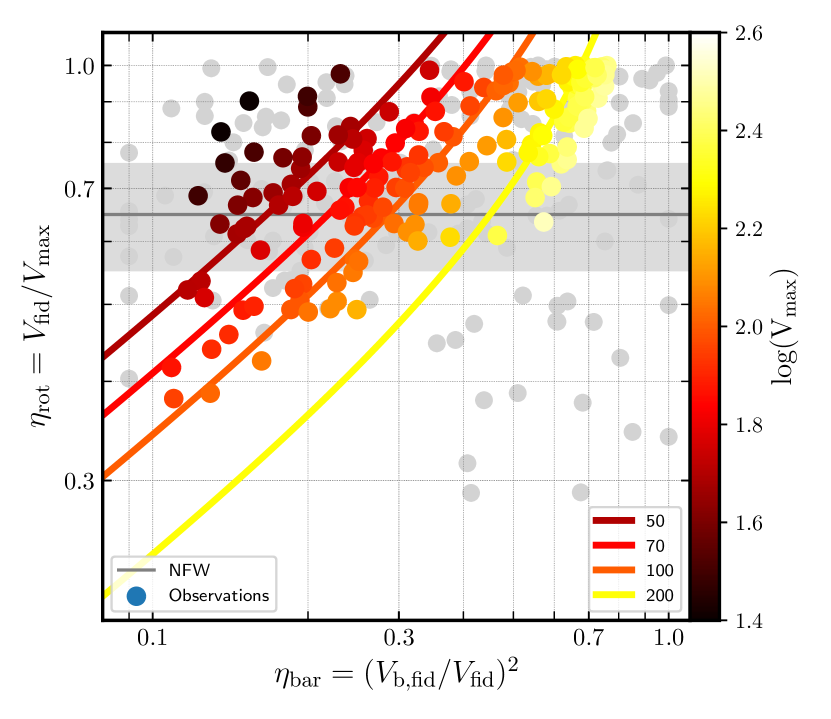
Although, overall, dwarf galaxy rotation curve shapes correlate only weakly with the effective baryon surface density, it is possible that baryons shape rotation curves through their role in setting the inner gravitational potential. We explore this in Fig. 4, where we plot vs , where the latter is defined as . (We hereafter define for ease of notation.) The (squared) ratio between the baryonic contribution and the measured rotation velocity at is roughly equivalent to the ratio between the enclosed baryonic and total mass within the inner fiducial radius, .
Fig. 4 illustrates a few interesting points. The first is that in massive disks (i.e., km/s) rotation curves are approximately flat (i.e., ) and baryons, as expected, play an important role (i.e., -). An example of this kind of galaxy (UGC 03205) is shown in the top-right panel of Fig. 5. The rotation curve in this case rises actually more rapidly than expected for an LCDM halo of the same (black curve in the same panel) because of the gravitational importance of the baryons at .
For less massive systems the interpretation is less clear: most dwarf galaxies (defined as having km/s) scatter from the top-left to bottom-right corners in Fig. 4, a surprising trend for scenarios that envision the importance of baryons as the main driver of the rotation curve diversity.
Indeed, take, for example, systems at the top-left corner of Fig. 4: these are galaxies with rapidly-rising (“cuspy”) rotation curves but where baryons play a negligible role at the inner fiducial radius . An example (NGC 1705) is shown in the top-left panel of Fig. 5. As we shall see below, systems like this are difficult to reproduce in scenarios like BICC and SIDM, where all or most halos have cores and cuspy rotation curves are assumed to occur only in systems where baryons dominate the central potential.
A similar comment applies to galaxies at the bottom-right corner of Fig. 4: these galaxies have the largest “cores”, which, in the BICC scenario, would correspond to systems that have suffered the effects of explosive baryonic outflows, and where few baryons should have remained in the galaxy. An example (IC 2574) is shown in the bottom-right panel of Fig. 5. In this galaxy, as well as in most systems with the largest cores, baryons are actually as dominant at as in massive, high surface brightness disks (i.e., ).
This discussion illustrates how Fig. 4 provides a useful tool to judge the viability of the various scenarios that aim to explain the rotation curve diversity. In other words, it is not enough to identify a mechanism that may modify the inner regions of a halo to create diversity in the rotation curves of dwarf galaxies; the same mechanism must also allow galaxies to exhibit the observed diversity in the importance of baryons in the inner regions and must reproduce the trends in the - plane shown in Fig. 4. This is the key argument of the analysis that follows, where we shall examine, in turn, the successes and shortcomings of each of the four scenarios identified in Sec. 1.
4.2 Diversity and BICC (baryon-induced cores/cusps)
We shall use several LCDM cosmological hydrodynamical simulations to compare with observed rotation curves. The first corresponds to simulations from the APOSTLE project (Sawala et al., 2016), which used the code developed for the EAGLE project (Schaye et al., 2015; Crain et al., 2015) to simulate volumes selected to resemble the Local Group.
Rotation curves from these simulations have been analyzed in a number of papers (e.g., Oman et al., 2015; Sales et al., 2017; Bose et al., 2019), who report that the inner cuspy structure of the halos is largely unaltered by the assembly of the galaxy, except for some halo contraction caused by the accumulation of baryons at the centre (see also Schaller et al., 2015). No dark matter “cores” are formed in APOSTLE, in the sense that there is no obvious reduction in the inner dark matter content compared to what would be expected from a DMO simulation. We shall use galaxies selected from the “high-resolution” APOSTLE volumes, referred to as AP-L1 for short (Fattahi et al., 2016).
The lack of cores in the EAGLE/APOSTLE simulations has been traced to the relatively low (minimum) gas density threshold for star formation adopted in that code (Eq. 2). This prevents the gas that condenses at the centres of dark matter halos from dominating gravitationally, minimizing the effects that baryonic inflows and outflows may have on the dark matter (Pontzen & Governato, 2012). Cores do form in simulations run with the same EAGLE code but with a raised threshold (Benítez-Llambay et al., 2019). For that reason, we shall also use here results from a simulation with cm-3, labelled EAGLE-CHT10.
Dark matter cores have also been reported in simulations from the NIHAO project (Wang et al., 2015), a series of zoom-in resimulations of galaxies spanning a wide range in mass. Like EAGLE-CHT10, these simulations adopt a high star formation threshold, but a rather different implementation of the star formation and feedback algorithms. Details for this and other simulations may be found in Sec. 3 and references listed there.
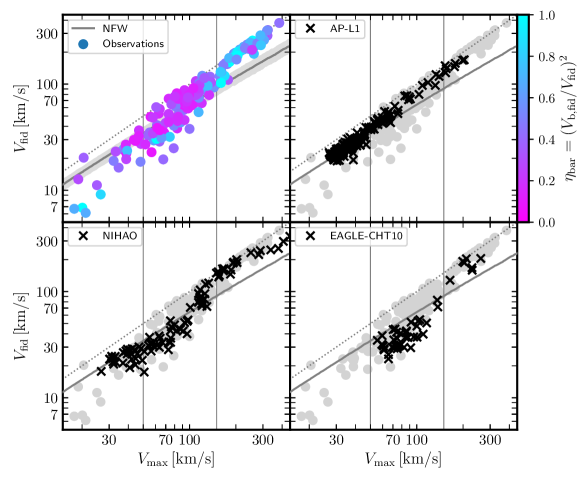
How well do each of these simulation series reproduce the observed diversity and, importantly, the relation between rotation curve shape and baryonic importance? We contrast the - results with observational data in Fig. 6. Simulated galaxies are only included if the Power et al. (2003) convergence radius is smaller than . Except when otherwise explicitly noted, we shall estimate circular velocities in simulated galaxies assuming spherical symmetry; i.e., .
The top-left panel reproduces the observational data presented in Fig. 2, coloured this time by the baryon importance parameter, . The same observational data is reproduced in the other panels, for reference, with grey circles. Legends in each panel label the simulation series it corresponds to.
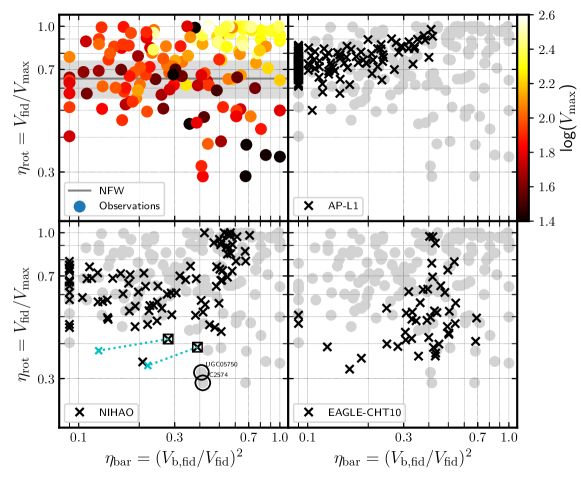
Fig. 7 is similar in concept to Fig. 6, but for the - relation. Observed galaxies are shown in the top-left panel of Fig. 7 and are coloured by . We shall use these two figures to discuss next the results of each simulation series.
4.2.1 APOSTLE
As expected from the discussion above, APOSTLE galaxies (top-right panel in Fig. 6) show little diversity in their rotation curve shapes, which track closely the loci of DMO LCDM halos (grey line/shaded band in top-left panel). The upturn relative to the LCDM/NFW line in massive galaxies results from the contribution of baryons in the inner regions. Note that because of the relatively small simulated volume there are few massive galaxies in APOSTLE. The APOSTLE sample contains no slowly-rising, large core dwarf galaxies (i.e., systems well below the grey line), in disagreement with the observational dataset considered here.
In terms of rotation curve shape vs baryon importance, we see from the top-right panel of Fig. 7 that few APOSTLE galaxies are heavily dominated by baryons in the inner regions. APOSTLE is able to reproduce fairly well rapidly-rising rotation curves in galaxies where baryons are unimportant (i.e., top-left corner of the - panel); these correspond to NFW-like halos where the initial cusp has been, if anything, slightly strengthened by the accumulation of baryons at the centre.
Slowly-rising rotation curves (i.e., ), as well as heavily baryon-dominated galaxies () are not present in these simulations. This comparison briefly summarizes the known shortcomings of EAGLE/APOSTLE simulations to reproduce the observed diversity of dwarf galaxy rotation curves (e.g., Oman et al., 2015).
4.2.2 NIHAO
The comparison with NIHAO is shown in the bottom-left panels of Figs. 6 and 7. Starting with Fig. 6, NIHAO galaxies exhibit more slowly-rising rotation curves than APOSTLE in the range - km/s. This is the result of the cores created by baryonic outflows in these runs. More massive galaxies have rapidly-rising rotation curves, and thus no obvious cores, presumably because baryonic outflows are less efficient in the deep potential wells of these systems. Cores do not form in very low-mass galaxies either (i.e., km/s), in this case because too few stars form in these systems to power the needed outflows (e.g., Di Cintio et al., 2014a, b).
The cores in NIHAO help to reconcile LCDM with some of the slowly-rising rotation curve systems that APOSTLE fails to reproduce. Note, however, that because core formation is quite efficient in the km/s range, NIHAO seems unable to reproduce rapidly-rising rotation curves in that range (see also Santos-Santos et al., 2018). Indeed, judging from the lower-left panel of Fig. 6, NIHAO’s result do not seem to capture the full diversity of dwarf galaxy rotation curves. In addition, there is some evidence for cores in observed galaxies at the lowest mass end (i.e., km/s) again at odds with NIHAO’s results.
These shortcomings are also apparent in the bottom-left panel of Fig. 7, where we see that NIHAO does not reproduce the observed systems with “cuspy” rotation curves and negligible baryon contribution (top-left corner), nor baryon-dominated galaxies with large cores (bottom-right).
Regarding the latter (two examples of which, UGC05750 and IC2574, are highlighted with circles in the bottom-left panel of Fig. 7), Santos-Santos et al. (2018) have suggested that the disagreement may have been caused by the assumption of spherical symmetry when estimating circular velocities in simulations (see also Dutton et al., 2019b).
Indeed, these authors show in their Fig. 6 that the inner circular velocities of two NIHAO galaxies (highlighted with squares in the bottom-left panel of our Fig. 7) could be substantially reduced by taking into account the actual flattened geometry of the baryons when computing the gravitational potential on the disc plane. This reduction could, in principle, lead to lower values of , as shown by the cyan dashed lines in the bottom-left panel of Fig. 7.
However, because the NIHAO galaxies are actually dark matter dominated at , the reduction in is accompanied by an even more substantial reduction in , shifting the galaxies to the bottom-left corner of the panel, rather than closer to the observed galaxies. In other words, NIHAO galaxies may come close to matching the shape of the rotation curves of UGC05750 and IC2574, but are unable to reproduce, simultaneously, the importance of baryons in their inner regions. This discussion highlights the power of using both and as diagnostics of the viability of a particular scenario meant to explain the rotation curve diversity.
4.2.3 EAGLE-CHT10
Finally, we consider an alternative LCDM simulation run with the EAGLE code, but where a higher star formation threshold allows baryonic outflows to transform cusps into cores. The star formation and feedback algorithm is quite different from NIHAO’s so, in principle, we do not expect the same results. However, as may be seen in the bottom-right panel of Fig. 6, the results for EAGLE-CHT10 are not too dissimilar to NIHAO’s. There is, again, a shortage of “cuspy” systems in the km/s range. We are unable to check for the presence of cores in km/s galaxies because of limited numerical resolution.
In terms of vs (Fig. 7), we see that, as in the case of NIHAO, EAGLE-CHT10 has difficulty reproducing “cuspy” galaxies where the baryon contribution is negligible. EAGLE-CHT10 fares a bit better in terms of the largest cores, especially those with high values of , but the difference with NIHAO in this respect is small.
4.2.4 Summary
It is clear that baryonic outflows can produce cores in dwarf galaxies, reconciling in the process LCDM with systems with slowly-rising rotation curves. However, this mechanism, at least as implemented in the NIHAO and EAGLE-CHT10 simulations we analyzed here, is unable to account simultaneously for galaxies with “cuspy” rotation curves where the inner contribution of baryons is negligible.
The observed diversity seems to demand a mechanism that forms cores in some galaxies only, while others retain (or re-form) a cusp, independently of the baryonic mass contribution. This feature seems to elude current simulations of this mechanism. It is unclear whether this signals a fundamental shortcoming of the models, or just a need to “fine tune” the numerical implementations. What is clear, however, is that any successful explanation of the rotation curve diversity should provide a natural explanation for the apparent presence of cusps and cores in dwarfs and for their peculiar relation to the importance of baryons in the inner regions.
4.3 Diversity and SIDM
Self-interacting dark matter is a distinct scenario for explaining the rotation curve diversity, where cores in the inner dark matter density profiles form not through baryonic outflows, but, rather, because of the inward “heat transfer” driven by collisions (“self-interactions”) between dark matter particles333 In principle, baryonic inflows and outflows may also affect the inner regions of SIDM halos, a complication that we shall ignore in this paper.. The simplest example of SIDM corresponds to elastic, velocity-independent interactions where the magnitude of the effect is controlled by a single parameter; the self-interacting cross section, (see; e.g., Rocha et al., 2013). This is, in principle, a free parameter, but values between and cm2/g lead to tangible changes in the inner density profiles of dark matter halos (see; e.g., the recent review by Tulin & Yu, 2018).
An exploration of all SIDM alternatives is beyond the scope of this paper, which adopts a single value of cm2/g. This is a rather extreme value that, however, allows us to explore the maximal effect of this mechanism without promoting a “core collapse” of the inner regions (e.g., Elbert et al., 2015). This model, which we shall refer to hereafter as SIDM10, should be regarded as a limiting case where cores are as large as this mechanism may be plausibly expected to yield.
We emphasize that more realistic SIDM models would include a velocity-dependent cross section, which is needed to reduce the effective cross section in galaxy clusters, where a cross section as large as assumed here is clearly ruled out (see; e.g., Tulin & Yu, 2018, and references therein). Velocity dependence is indeed generic with light force mediators, as would be expected for large cross sections. We shall ignore these complications in our analysis, which is not meant to rule in or out SIDM as a class, but rather to identify further observational diagnostics useful for assessing the relative performance of different scenarios.
4.3.1 SIDM10: dark matter only
We begin by exploring the effect of SIDM on the inner mass distribution of dark matter halos in the dark-matter-only case. As discussed above, interactions reduce the inner dark matter density and promote the formation of a constant density core. This has little effect on the maximum circular velocity of a halo, but can reduce substantially the circular velocity at the inner fiducial radius.
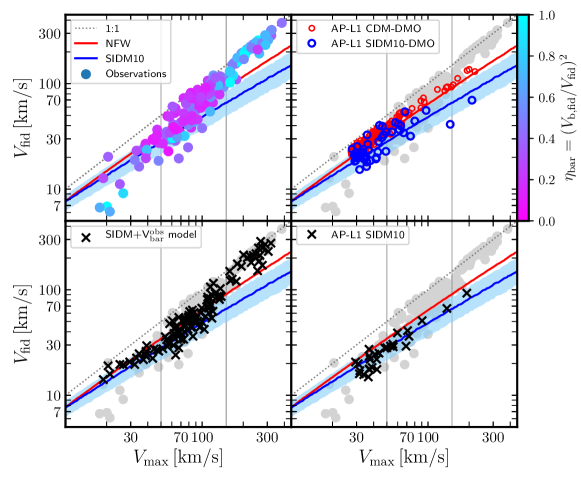
We may see the resulting effect on the top-right panel of Fig. 8, where we plot the results of the DMO LCDM AP-L1 runs (in red), together with results from the DMO SIDM10 run (blue). Clearly, the values of at fixed are substantially lower in the case of SIDM10 than for LCDM.
We can use the results of the AP-L1 and SIDM10 DMO runs to model the DMO SIDM10 - relation, as well as its scatter, starting from the LCDM -concentration relation (and its scatter; Ludlow et al., 2016). Details of the procedure are given in an Appendix (Secs. A.2 and A.1), but we describe it briefly below, for completeness.
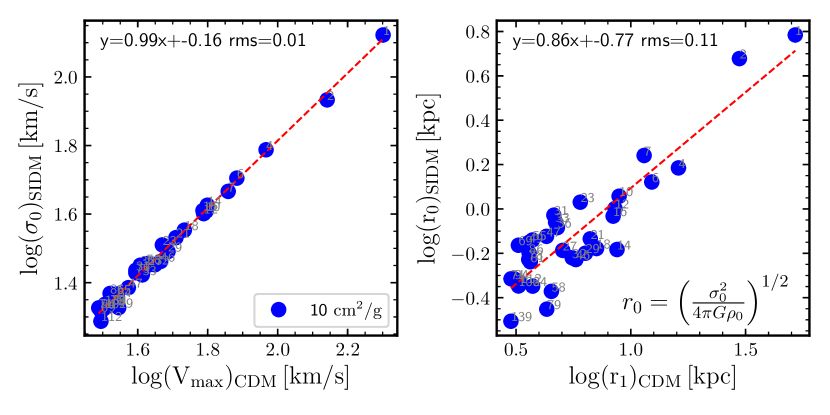
The inner mass profile of an SIDM halo is well approximated by a non-singular isothermal sphere, which is fully described by a pair of parameters (see; e.g., p.228 of Binney & Tremaine, 1987). These may be taken to be the central density, , and a scale radius, , or, alternatively, a velocity dispersion, . For SIDM10, these parameters correlate closely with the corresponding LCDM parameters: for example, there is a close relation between the of an LCDM halo and the characteristic of the counterpart SIDM halo that forms when the same initial conditions are evolved with self-interactions turned on.
Likewise, there is a strong correlation between and the characteristic radial scale of an LCDM halo, best expressed through , the radius where, on average, one interaction per particle is expected per Hubble time. These correlations are sensitive to the value of adopted; we show them for cm2/g in Fig. 15 for matching halo pairs identified in LCDM and SIDM DMO simulations of one of the AP-L1 volumes.
These same correlations may be used to generate a population of SIDM10 halos that include both the original scatter in the LCDM mass-concentration relation, but also the scatter in the relations that link LCDM and SIDM10. The results of this procedure, in terms of and are shown by the blue thick line (and shaded area, which delineate the : percentiles) in the top-right panel of Fig. 8. To make further progress we need to model the effect of baryons into this population of SIDM10 halos, either through modeling or direct simulation. We pursue this below.
4.3.2 SIDM10 + baryons: a model
As baryons accumulate at the centre of an SIDM halo, they are expected to deepen the central gravitational potential. This should cause the surrounding dark matter to respond by contracting and, for large enough perturbations, by rebuilding the inner cusp. This process has been explored using analytical techniques and simulations of isolated systems in prior work (Kaplinghat et al., 2014; Kamada et al., 2017; Ren et al., 2019; Creasey et al., 2017), which argue that the effect should be strong enough in practice to produce cuspy and cored rotation curves, and may account for the observed rotation curve diversity.
In this scenario, slowly-rising rotation curves reflect systems where self-interactions have carved a core, and where the baryons are not important enough to rebuild the cusp. At the other extreme, rapidly-rising rotation curves should generally correspond to systems where baryons deepened the central potential and are gravitationally important enough to rebuild the central dark matter cusp. These two features are, at first glance, at odds with the trends for dwarf galaxies highlighted in Fig. 4, where it is clear that there are many “cuspy” systems where baryons are unimportant and, in addition, that baryons actually do play an important role at the centre of systems with the largest cores. Can SIDM models resolve this apparent disagreement?
We explore this by using an analytical model, described in detail in the Appendix (Sec. A.3), to estimate the response of SIDM halos to the accumulation of baryons at the centre, and to compare the resulting rotation curves with observations. In particular, we use the actual baryonic mass profile of individual galaxies and place them in randomly selected SIDM halos of the appropriate to verify whether the resulting rotation curves reproduce the observed diversity.
Our modeling proceeds as follows. For each observed galaxy in our sample, we choose a random SIDM10 halo of matching (Sec. 4.3.1) and compute the change in the inner dark matter distribution expected from the addition of the baryons. The procedure uses the full baryonic distribution of each galaxy (given by ) to compute the response of the dark matter (see details in Sec. A.3), and results in a new rotation curve for the galaxy. The procedure preserves and of each galaxy, but modifies its rotation speed at the inner fiducial radius, .
The results of this modeling are presented in the bottom-left panel of Fig. 8. At first glance, this results in a wider range of rotation curve shapes compared with the LCDM simulations shown in Fig. 6. This is, however, partly a result of the wider diversity of baryonic profiles probed here, which matches, by construction, exactly those of the observed sample.
In particular, the SIDM10 model successfully reproduces the steeply rising rotation curves of massive galaxies (i.e., km/s), despite the fairly large cores imposed by SIDM. In lower mass systems the diversity is reproduced less well, with fewer systems near the : line and, despite the extreme value of adopted, few cores as large as observed. This is especially true at the very low mass end, where SIDM cores seem too small to affect the rotation curve at .
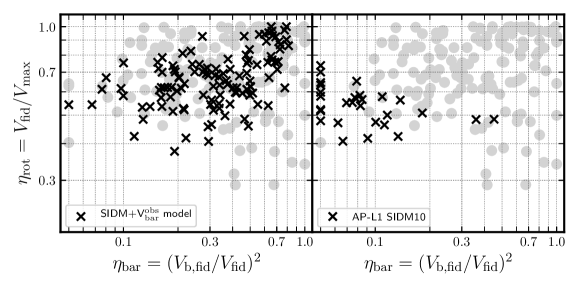
This conclusion is supported by the distribution of galaxies in the - plane (left-hand panel of Fig. 9) where it is clear that there are few galaxies in the upper-left and bottom-right corners of this plot. Like the BICC models discussed in Sec. 4.2, SIDM10 has difficulty accounting for both the observed population of sharply-rising rotation curves without a dominant inner baryonic contribution (top-left corner), and for the very slowly-rising rotation curves where baryons play an important role near the centre (bottom-right corner). On its own, the SIDM hypothesis seems thus unable to explain fully the observed diversity of rotation curve shapes.
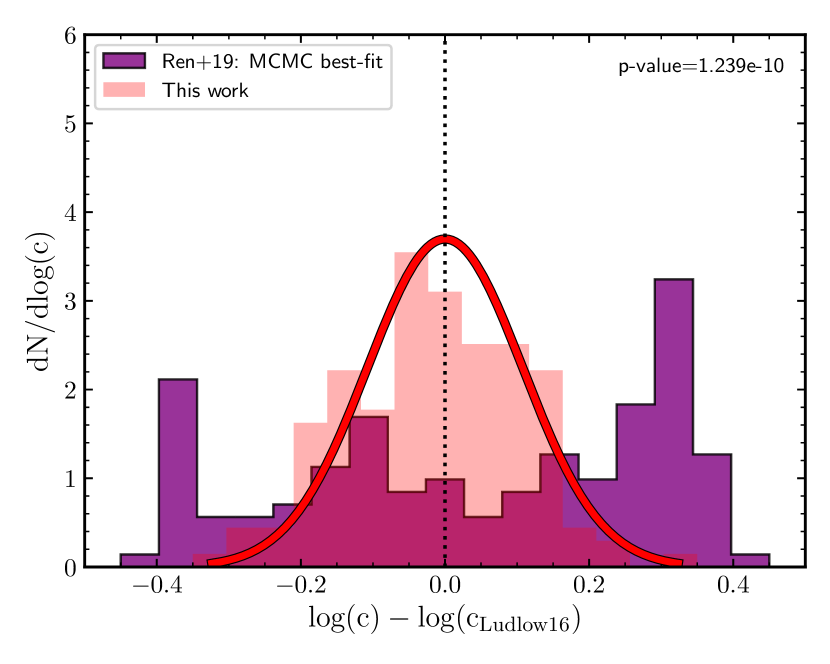
Note that our analysis addresses whether observed galaxies, if placed in SIDM halos of randomly sampled concentration (and not particular halos chosen to fit the observed rotation curves), would exhibit the observed diversity. This differs from earlier work on this topic, which addressed whether it is possible to obtain adequate fits to individual rotation curves in SIDM halos by allowing the size of the core (which is intimately linked to the assumed concentration) to vary as a free parameter (see; e.g., Ren et al., 2019, and references therein). Such work reproduces the diversity by construction, by carefully choosing concentration values for the halos of individual galaxies so as to fit their rotation curves. The distribution of required concentrations, however, is quite different from what would be expected from randomly sampling the halo mass-concentration relation (see Creasey et al., 2017, for a similar argument)..
We illustrate this in Fig. 10, where we contrast the probability distribution of concentrations adopted by Ren et al. (2019) (i.e., their “MCMC best-fit”model; see their Table S2) with the concentration distribution used in our work (pink histogram). Clearly, the two distributions are substantially and significantly different.
In other words, fitting the observed rotation curve diversity with SIDM requires carefully chosen concentrations which, taken as an ensemble, are quite unlike what is expected from cosmological simulations (Gaussian curve in Fig. 10). While it remains possible to match rotation curves with SIDM, the improbable distribution of required concentrations detracts, in our opinion, from the appeal of the SIDM scenario as an explanation of the diversity of dwarf galaxy rotation curves.
4.3.3 SIDM10 + baryons: a simulation
The results of a cosmological hydrodynamical simulation that includes a self-interaction cross section of cm2/g and the EAGLE/APOSTLE star formation/feedback implementation are presented in the bottom-right panel of Fig. 8. (Details of the simulation are given in Sec. 3.) Recall that, because of the low star formation density threshold adopted in this model, we do not expect baryonic outflows to effect large changes in the inner dark matter density profile. Indeed, the simulation results show that, in terms of -, the simulated galaxies follow approximately the dark matter-only results (indicated by the blue shaded area). As for the analytic model discussed in the previous subsection, low-mass simulated galaxies fail to populate the rapidly-rising (:) rotation curve regime and to account for the largest observed cores.
These conclusions are again supported by inspection of the - plane, shown in the right-hand panel of Fig. 9. There is again a clear dearth of “cuspy” systems where the baryons are gravitationally unimportant (upper-left corner), and of “cored” systems where baryons dominate the inner regions (bottom-right corner). Indeed, baryons do not seem to play an important role in any simulated SIDM10 galaxy, although this is likely a result of the particular star formation algorithm adopted in the EAGLE/APOSTLE code. These conclusions echo those of the previous subsection, and highlight the difficulty faced by models like SIDM, where most halos develop cores, to account naturally for the observed rotation curve diversity.
4.4 Diversity and non-circular motions
We consider next the effects that non-circular motions may have on the interpretation of the rotation curve diversity. As discussed by Oman et al. (2019) and Marasco et al. (2018), the triaxial potential of LCDM halos may induce non-circular motions in the gaseous discs of dwarf galaxies. In the simplest case, closed orbits in the disc plane become elliptical and the azimuthal speed of the gas varies along the orbit, from maxima along the orbital minor axis (pericentres) of the ellipse to minima along the orbital major axis (apocentres). This may lead to different rotation curves for the same galaxy, depending on how the line of nodes of a particular sky projection aligns with the orbital principal axis (see also Hayashi & Navarro, 2006). In particular, large underestimates of the inner circular velocity may result when the projected kinematic major axis is aligned with the orbital apocentres, mimicking the effect of a core.
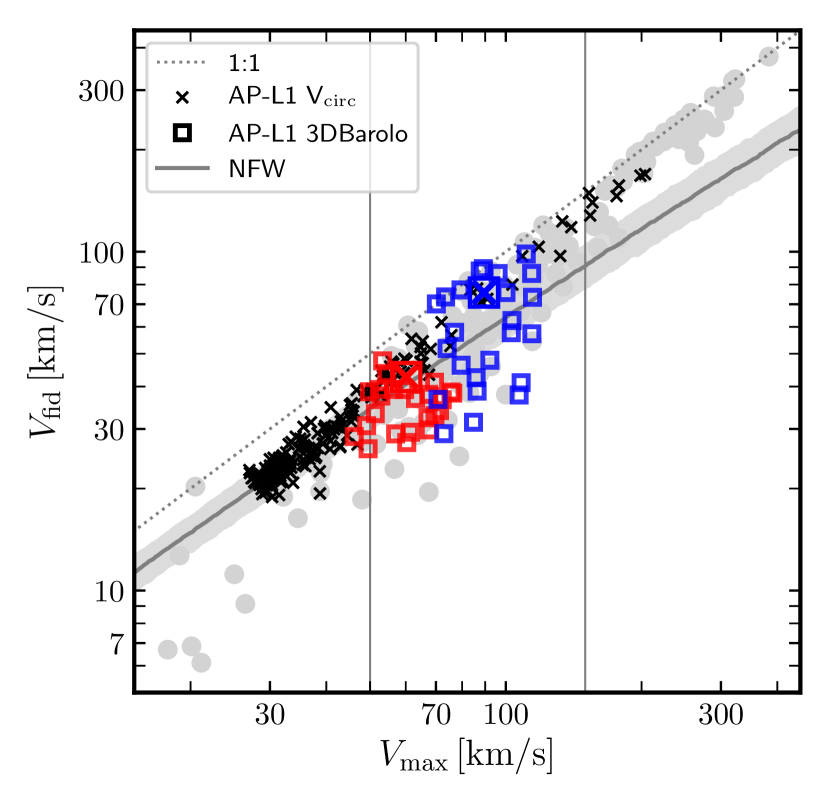
Non-circular motions may affect the inferred values of both and , introducing scatter in the tight relation between these two parameters expected in LCDM simulations where cores do not form, such as APOSTLE. We show the effect by selecting two dwarf galaxies from the AP-L1 sample and projecting them along 24 different lines of sight at fixed inclination, . Synthetic HI data cubes are constructed for each projection, which are then modelled using 3DBAROLO, a publicly available tilted-ring processing tool (Di Teodoro & Fraternali, 2015; Iorio et al., 2017). Details of the modeling as applied to the APOSTLE galaxies may be found in Oman et al. (2019).
Each of the two galaxies is shown with different colours in Fig. 11, illustrating the dramatic impact that non-circular motions may have on the - and - correlations. At least for these two galaxies the effects of non-circular motions are quite substantial. For galaxy AP-L1-V6-5-0 (shown in blue; notation as in Oman et al., 2019), the maximum circular velocity may vary from km/s to slightly over km/s and the inferred rotation speed at the inner fiducial radius from to km/s, depending on projection. Non-circular motions of this magnitude can clearly explain much of the observed diversity in the - plane.
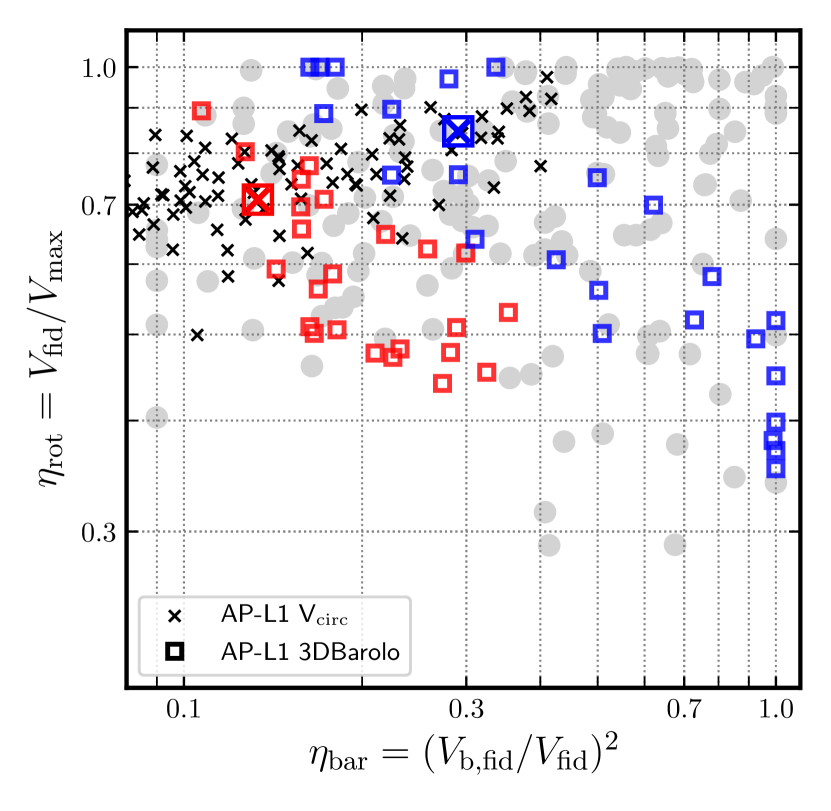
In particular, the same galaxy could end up being classified either as a rapidly-rising rotation curve where baryons are relatively unimportant (top-left corner in the bottom panel of Fig. 11), or as a galaxy with a large core where baryons dominate the inner regions (bottom-right corner of the same panel). This is because non-circular motions tend to scatter galaxies along the same band in the - plane traced by dwarf galaxies (see galaxies with km/s in Fig. 4). Non-circular motions thus provide an appealing explanation for this puzzling trend, which, as we have discussed, is not reproduced well in other scenarios.
Although attractive, the non-circular motion explanation of the diversity also suffers from shortcomings. In particular, it may be argued that the magnitude of non-circular motions required to spread galaxies across the whole - plane is quite substantial, whereas many observed galaxies show quieter velocity fields, without clear obvious distortions (Trachternach et al., 2008). However, Oman et al. (2019) report that at least two galaxies with obvious “cores” (DDO 47 and DDO 87) show clear signs of non-circular motions and emphasize that these may be difficult to detect because of the large number of free parameters involved in tilted-ring model fits.
A second difficulty refers to our earlier discussion of Fig. 3, which shows that “cores” are only manifest in low surface brightness/density galaxies. If diversity were due mostly to non-circular motions, why would they only affect low surface brightness galaxies? There is no clear answer to this, but one possibility is that in galaxies with highly-concentrated baryonic components the halo responds by becoming more spherical, reducing the importance of non-circular motions (e.g., Abadi et al., 2010, and references therein). For the same reason, we emphasize that non-circular motions of the kind described here would only be expected in LCDM halos that have preserved their original cusp and triaxiality, since mechanisms that erase the cusp are also likely to sphericalize the halo. This is a well known feature of SIDM (e.g., Miralda-Escudé, 2002) that is likely to apply as well to baryon-induced cores.
A detailed re-analysis of all “cored” galaxies designed specifically to test the non circular-motion hypothesis, together with a concerted effort to infer rotation curves from synthetic 2D velocity fields for more simulated galaxies is clearly needed in order to assess the true viability of this scenario. However, at least from the evidence presented in Fig. 11, it would be premature to rule out non-circular motions as one of the driving causes of the observed diversity.
4.5 Diversity and MDAR
Finally, we explore whether the observed rotation curve shape diversity could be a consequence of the “mass discrepancy-acceleration relation” (MDAR) proposed by McGaugh et al. (2016). The MDAR posits that, at all radii, and for all galaxies, observed accelerations, are uniquely determined by the accelerations expected from the baryonic distribution, . This, of course, implies a unique relation between and at all radii, so that the full rotation curve may be derived solely from the distribution of baryons.
In this scenario, the diversity of rotation curve shapes must therefore follow from variations in the baryonic mass distribution, which may in principle induce a large spread of inner acceleration values in galaxies of given . This issue has been studied by Ghari et al. (2019), who considered the original SPARC dataset as well as revisions to the SPARC dataset proposed by Li et al. (2018)444Assuming that the MDAR is indeed valid, these authors adjust the distances, inclinations, and mass-to-light ratios of SPARC galaxies so as to derive a much tighter relation than originally presented by McGaugh et al. (2016). With these adjustments the overal scatter in the MDAR may be reduced from dex to dex., and concluded that, if the MDAR does indeed hold, a sizable scatter in is indeed expected, mainly driven by the structural diversity of galaxies of given .
We show this in the top panel of Fig. 12, where the coloured circles correspond to re-deriving the values of and for each galaxy using only the profile and the MDAR (assuming negligible scatter). The grey circles in the same figure are the original data, as presented in Fig. 2. Note that although the main trends remain, the diversity in the dwarf galaxy regime has been reduced, and most dwarfs now lie closer to the LCDM prediction, indicated by the “NFW” band in the same figure. We have explicitly checked that using the Li et al. (2018) revisions to for SPARC galaxies does not change appreciably this conclusion; if anything, it reduces the diversity even further.
In the context of our discussion, we note that the MDAR is incompatible with the trends between inner baryon dominance and rotation curve shape ( vs ) highlighted when discussing dwarf galaxies in Fig. 4. Indeed, it is straightforward to show that the MDAR links these two parameters so that galaxies must follow curves in the - plane like those shown in the bottom panel of Fig. 12, depending solely on their . Dwarf galaxies, in particular, are constrained to the top-left and are excluded from the bottom-right region of this panel. In other words, dwarf galaxies with slowly-rising rotation curves (“cores”) and where baryons dominate the inner regions should not exist in the MDAR scenario.
This is illustrated by the coloured circles in the bottom panel of Fig. 12, which correspond to assuming that the MDAR holds (with negligible scatter), so that only is used to compute and for each observed galaxy. As is clear, the trend from top-left to bottom-right drawn by dwarf galaxies in Fig. 4 is not present anymore, and no dwarfs are found at the bottom-right region of the plot. The aforementioned trend must therefore arise, in the MDAR interpretation, as a consequence of (substantial) errors in the rotation velocities.
This is reminiscent of the discussion in the preceding subsection (Sec. 4.4), where we argued that errors in the observed rotation speeds (due, in that case, to non-circular motions) may reconcile the LCDM AP-L1 results with the observed diversity. Indeed, note that there is a strong similarity between dwarf galaxies in Fig. 12 and LCDM galaxies in the AP-L1 runs (see; e.g., the crosses in the bottom panel of Fig. 11): in both cases dwarfs cluster at the upper-left corner of this figure. This similarity has already been hinted at by Navarro et al. (2017) and Ludlow et al. (2017), who argued that the MDAR relation is actually readily reproduced in LCDM: since dwarf galaxies with large “cores” are unexpected in LCDM, they should also deviate systematically from the MDAR, at least in their inner regions.
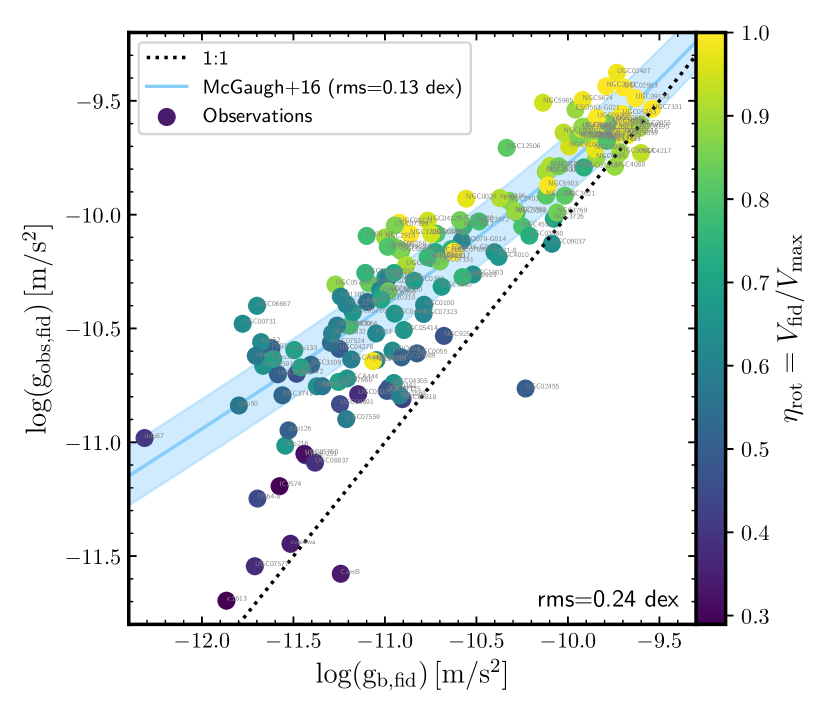
We may see this directly in Fig. 13, where we show how closely the total and baryonic accelerations correlate at the inner fiducial radius for all galaxies in our sample. The MDAR relation from McGaugh et al. (2016), including its quoted scatter, is shown by the light blue shaded region. Observed galaxies are coloured by the shape parameter, , and are seen to follow only approximately the MDAR relation at . Indeed, the rms scatter in is dex, substantially larger than the dex obtained by McGaugh et al. (2016) by combining data for all galaxies and radii. In addition, most galaxies with large “cores” (i.e. ) fall systematically off and below the MDAR relation (see also Santos-Santos et al., 2016; Ren et al., 2019, who report a similar result).
In conclusion, although variations in the baryonic distribution of galaxies may lead to some diversity in rotation curve shapes, the subtler trends between such shapes and the importance of baryons in the inner regions implied by the data are incompatible with the MDAR. On the other hand, if the MDAR actually holds, then the baryonic trends must result from errors in the data. Since the same data was actually used to derive the MDAR in the first place, this reduces, in our opinion, the appeal of the MDAR as a possible explanation for the diversity of dwarf galaxy rotation curve shapes.
5 Summary and Conclusions
Dwarf galaxy rotation curves are challenging to reproduce in the standard Lambda Cold Dark Matter (LCDM) cosmogony. In some galaxies, rotation speeds rise rapidly to their maximum value, consistent with the circular velocity curves expected of cuspy LCDM halos. In others, however, rotation speeds rise more slowly, revealing large “inner mass deficits” or “cores” when compared with LCDM halos (e.g., de Blok, 2010). This diversity is unexpected in LCDM, where, in the absence of modifications by baryons, circular velocity curves are expected to be simple, self-similar functions of the total halo mass (Navarro et al., 1996b, 1997; Oman et al., 2015). We examine in this paper the viability of different scenarios proposed to explain the diversity, and, in particular, the apparent presence of both cusps and cores in dwarfs.
A first scenario (BICC; “baryon-induced cores/cusps”) envisions the diversity as caused by the effect of baryonic inflows and outflows during the formation of the galaxy, which may rearrange the inner dark matter profiles: cores are created by baryonic blowouts but cusps can be recreated by further baryonic infall (see; e.g., Navarro et al., 1996a; Pontzen & Governato, 2012; Di Cintio et al., 2014a; Tollet et al., 2016; Benítez-Llambay et al., 2019). A third scenario (SIDM) argues that dark matter self-interactions may reduce the central DM densities relative to CDM, creating cores. As in BICC, cusps may be re-formed in galaxies where baryons are gravitationally important enough to deepen substantially the central potential (see, e.g., Tulin & Yu, 2018, for a recent review).
We have analyzed cosmological simulations of these two scenarios and find that, although they both show promise explaining systems with cores, neither reproduces the observed diversity in full detail. Indeed, both scenarios have difficulty reproducing an intriguing feature of the observed diversity, namely the existence of galaxies with fast-rising rotation curves where the gravitational effects of baryons in the inner regions is unimportant. They also face difficulty explaining slowly-rising rotation curves where baryons actually dominate in the inner regions, which are also present in the observational sample we analyze.
We argue that these issues present a difficult problem for any scenario where most halos are expected to develop a sizable core and where baryons are supposed to be responsible for the observed diversity. This is especially so because the relation between baryon surface density and rotation curve shape is quite weak in the dwarf galaxy regime, and thus unlikely to drive the diversity. We emphasize that, strictly speaking, this conclusion applies only to the particular implementations of BICC and SIDM we have tested here. These are by no means the only possible realizations of these scenarios, and it is definitely possible that further refinements may lead to improvements in their accounting of the rotation curve diversity.
Our conclusions regarding a second scenario, SIDM, may seem at odds with recent work that reports good agreement between SIDM predictions and dwarf galaxy rotation curves (see; e.g., the recent preprint of Kaplinghat et al., 2019, which appeared as we were readying this paper for submission, and references therein). That work, however, was meant to address whether observed rotation curves can be reproduced by adjusting the SIDM halo parameters freely in the fitting procedure, with promising results. Our analysis, on the other hand, explores whether the observed galaxies, if placed in average (random) SIDM halos, would exhibit the observed diversity. Our results do show, in agreement with earlier work, that SIDM leads to a wide distribution of rotation curve shapes. However they also highlight the fact that outliers, be they large cores or cuspy systems, are not readily accounted for in this scenario, an issue that was also raised by Creasey et al. (2017). Whether this is a critical flaw of the SIDM scenario, or just signals the need for further elaboration, is still unclear.
In a third scenario the diversity is caused by variations in the baryonic contribution to the acceleration in the inner regions, which is linked to rotation velocities through the “mass discrepancy-acceleration relation” (MDAR; McGaugh et al., 2016). Earlier work has already shown that such variations may indeed induce substantial diversity in rotation curve shapes (Ghari et al., 2019). However, the MDAR is incompatible with the trend between shape and baryonic importance and, in particular, with the existence of galaxies with slowly-rising rotation curves where baryons are important in the inner regions. Reconciling these with the MDAR requires assuming that the inner rotation velocities in those galaxies are in error. This is an unappealing solution, since the MDAR was actually derived from such data in the first place.
We end by noting that the rather peculiar relation between inner baryon dominance and rotation curve shapes could be naturally explained if non-circular motions were a driving cause of the diversity. For this scenario to succeed, however, it would need to explain why such motions affect solely low surface brightness galaxies, the systems where the evidence for “cores” is most compelling. Further progress in this regard would require a detailed reanalysis of the data to uncover evidence for non-circular motions, and a clear elaboration of the reason why non-circular motions do not affect massive, high surface brightness galaxies. Until then, we would argue that the dwarf galaxy rotation curve diversity problem remains, for the time being, open.
Acknowledgements
We thank the anonymous referee whose suggestions have helped to improve this paper. We also thank the NIHAO collaboration for kindly sharing their simulation data, and Manoj Kaplinghat for useful comments. ISS and AR are supported by the Arthur B. McDonald Canadian Astroparticle Physics Research Institute. JFN is a Fellow of the Canadian Institute for Advanced Research and acknowledges useful discussions with Laura Sales. MRL and AF had support from Marie Curie COFUND-Durham Junior Research Fellowship under EU grant agreement no. 609412. MRL is funded by a Grant of Excellence from the Icelandic Research Fund (grant number 173929-051). AF and CSF are supported by the Science and Technology Facilities Council (STFC) [grant numbers ST/F001166/1, ST/I00162X/1,ST/P000541/1]. KO received support from VICI grant 016.130.338 of the Netherlands Foundation for Scientific Research (NWO). AR is supported by the European Research Council (ERC-StG-716532-PUNCA) and the STFC (ST/N001494/1). This work used the DiRAC@Durham facility managed by the Institute for Computational Cosmology on behalf of the STFC DiRAC HPC Facility (www.dirac.ac.uk). The equipment was funded by BEIS capital funding via STFC capital grants ST/K00042X/1, ST/P002293/1, ST/R002371/1 and ST/S002502/1, Durham University and STFC operations grant ST/R000832/1. DiRAC is part of the National e-Infrastructure. ISS dedicates this work to her Abuelita, who was fascinated by the Universe and outer space.
References
- Abadi et al. (2010) Abadi M. G., Navarro J. F., Fardal M., Babul A., Steinmetz M., 2010, MNRAS, 407, 435
- Adams et al. (2014) Adams J. J. et al., 2014, ApJ, 789, 63
- Benítez-Llambay et al. (2019) Benítez-Llambay A., Frenk C. S., Ludlow A. D., Navarro J. F., 2019, MNRAS, 488, 2387
- Binney & Tremaine (1987) Binney J., Tremaine S., 1987, Galactic dynamics
- Bose et al. (2019) Bose S. et al., 2019, MNRAS, 486, 4790
- Brook et al. (2012) Brook C. B., Stinson G., Gibson B. K., Wadsley J., Quinn T., 2012, MNRAS, 424, 1275
- Chan et al. (2015) Chan T. K., Kereš D., Oñorbe J., Hopkins P. F., Muratov A. L., Faucher-Giguère C.-A., Quataert E., 2015, MNRAS, 454, 2981
- Crain et al. (2015) Crain R. A. et al., 2015, MNRAS, 450, 1937
- Creasey et al. (2017) Creasey P., Sameie O., Sales L. V., Yu H.-B., Vogelsberger M., Zavala J., 2017, MNRAS, 468, 2283
- Dalla Vecchia & Schaye (2012) Dalla Vecchia C., Schaye J., 2012, MNRAS, 426, 140
- de Blok (2010) de Blok W. J. G., 2010, Advances in Astronomy, 2010, 789293
- de Blok et al. (2001) de Blok W. J. G., McGaugh S. S., Bosma A., Rubin V. C., 2001, ApJ, 552, L23
- de Blok et al. (1996) de Blok W. J. G., McGaugh S. S., van der Hulst J. M., 1996, MNRAS, 283, 18
- de Blok et al. (2008) de Blok W. J. G., Walter F., Brinks E., Trachternach C., Oh S.-H., Kennicutt, Jr. R. C., 2008, AJ, 136, 2648
- Di Cintio et al. (2014a) Di Cintio A., Brook C. B., Dutton A. A., Macciò A. V., Stinson G. S., Knebe A., 2014a, MNRAS, 441, 2986
- Di Cintio et al. (2014b) Di Cintio A., Brook C. B., Macciò A. V., Stinson G. S., Knebe A., Dutton A. A., Wadsley J., 2014b, MNRAS, 437, 415
- Di Teodoro & Fraternali (2015) Di Teodoro E. M., Fraternali F., 2015, MNRAS, 451, 3021
- Dutton et al. (2019a) Dutton A. A., Macciò A. V., Buck T., Dixon K. L., Blank M., Obreja A., 2019a, MNRAS, 486, 655
- Dutton et al. (2016) Dutton A. A. et al., 2016, MNRAS, 461, 2658
- Dutton et al. (2019b) Dutton A. A., Obreja A., Macciò A. V., 2019b, MNRAS, 482, 5606
- Elbert et al. (2015) Elbert O. D., Bullock J. S., Garrison-Kimmel S., Rocha M., Oñorbe J., Peter A. H. G., 2015, MNRAS, 453, 29
- Fattahi et al. (2016) Fattahi A. et al., 2016, MNRAS, 457, 844
- Flores & Primack (1994) Flores R. A., Primack J. R., 1994, ApJ, 427, L1
- Gentile et al. (2004) Gentile G., Salucci P., Klein U., Vergani D., Kalberla P., 2004, MNRAS, 351, 903
- Ghari et al. (2019) Ghari A., Famaey B., Laporte C., Haghi H., 2019, A&A, 623, A123
- Governato et al. (2012) Governato F. et al., 2012, MNRAS, 422, 1231
- Hayashi & Navarro (2006) Hayashi E., Navarro J. F., 2006, MNRAS, 373, 1117
- Iorio et al. (2017) Iorio G., Fraternali F., Nipoti C., Di Teodoro E., Read J. I., Battaglia G., 2017, MNRAS, 466, 4159
- Kamada et al. (2017) Kamada A., Kaplinghat M., Pace A. B., Yu H.-B., 2017, Phys. Rev. Lett., 119, 111102
- Kaplinghat et al. (2014) Kaplinghat M., Keeley R. E., Linden T., Yu H.-B., 2014, Phys. Rev. Lett., 113, 021302
- Kaplinghat et al. (2019) Kaplinghat M., Ren T., Yu H.-B., 2019, arXiv e-prints, arXiv:1911.00544
- Kaplinghat et al. (2016) Kaplinghat M., Tulin S., Yu H.-B., 2016, Phys. Rev. Lett., 116, 041302
- Laporte & Penarrubia (2015) Laporte C. F. P., Penarrubia J., 2015, MNRAS, 449, L90
- Lelli et al. (2013) Lelli F., Fraternali F., Verheijen M., 2013, MNRAS, 433, L30
- Lelli et al. (2016) Lelli F., McGaugh S. S., Schombert J. M., 2016, AJ, 152, 157
- Li et al. (2018) Li P., Lelli F., McGaugh S., Schombert J., 2018, A&A, 615, A3
- Lovell et al. (2020) Lovell M. R., Hellwing W., Ludlow A., Zavala J., Robertson A., Fattahi A., Frenk C. S., Hardwick J., 2020, arXiv e-prints, arXiv:2002.11129
- Ludlow et al. (2017) Ludlow A. D. et al., 2017, Phys. Rev. Lett., 118, 161103
- Ludlow et al. (2016) Ludlow A. D., Bose S., Angulo R. E., Wang L., Hellwing W. A., Navarro J. F., Cole S., Frenk C. S., 2016, MNRAS, 460, 1214
- Marasco et al. (2018) Marasco A., Oman K. A., Navarro J. F., Frenk C. S., Oosterloo T., 2018, MNRAS, 476, 2168
- Mashchenko et al. (2006) Mashchenko S., Couchman H. M. P., Wadsley J., 2006, Nature, 442, 539
- McGaugh et al. (2016) McGaugh S. S., Lelli F., Schombert J. M., 2016, Phys. Rev. Lett., 117, 201101
- Miralda-Escudé (2002) Miralda-Escudé J., 2002, ApJ, 564, 60
- Moore (1994) Moore B., 1994, Nature, 370, 629
- More et al. (2009) More S., van den Bosch F. C., Cacciato M., 2009, MNRAS, 392, 917
- Navarro et al. (2017) Navarro J. F., Benítez-Llambay A., Fattahi A., Frenk C. S., Ludlow A. D., Oman K. A., Schaller M., Theuns T., 2017, MNRAS, 471, 1841
- Navarro et al. (1996a) Navarro J. F., Eke V. R., Frenk C. S., 1996a, MNRAS, 283, L72
- Navarro et al. (1996b) Navarro J. F., Frenk C. S., White S. D. M., 1996b, ApJ, 462, 563
- Navarro et al. (1997) Navarro J. F., Frenk C. S., White S. D. M., 1997, ApJ, 490, 493
- Oh et al. (2015) Oh S.-H. et al., 2015, AJ, 149, 180
- Oman et al. (2019) Oman K. A., Marasco A., Navarro J. F., Frenk C. S., Schaye J., Benítez-Llambay A. r., 2019, MNRAS, 482, 821
- Oman et al. (2015) Oman K. A. et al., 2015, MNRAS, 452, 3650
- Planck Collaboration et al. (2014) Planck Collaboration et al., 2014, A&A, 571, A16
- Pontzen & Governato (2012) Pontzen A., Governato F., 2012, MNRAS, 421, 3464
- Power et al. (2003) Power C., Navarro J. F., Jenkins A., Frenk C. S., White S. D. M., Springel V., Stadel J., Quinn T., 2003, MNRAS, 338, 14
- Read & Gilmore (2005) Read J. I., Gilmore G., 2005, MNRAS, 356, 107
- Relatores et al. (2019) Relatores N. C. et al., 2019, ApJ, 873, 5
- Ren et al. (2019) Ren T., Kwa A., Kaplinghat M., Yu H.-B., 2019, Physical Review X, 9, 031020
- Robertson et al. (2017) Robertson A., Massey R., Eke V., 2017, MNRAS, 465, 569
- Robertson et al. (2018) Robertson A. et al., 2018, MNRAS, 476, L20
- Rocha et al. (2013) Rocha M., Peter A. H. G., Bullock J. S., Kaplinghat M., Garrison-Kimmel S., Oñorbe J., Moustakas L. A., 2013, MNRAS, 430, 81
- Sales et al. (2017) Sales L. V. et al., 2017, MNRAS, 464, 2419
- Santos-Santos et al. (2016) Santos-Santos I. M., Brook C. B., Stinson G., Di Cintio A., Wadsley J., Domínguez-Tenreiro R., Gottlöber S., Yepes G., 2016, MNRAS, 455, 476
- Santos-Santos et al. (2018) Santos-Santos I. M., Di Cintio A., Brook C. B., Macciò A., Dutton A., Domínguez-Tenreiro R., 2018, MNRAS, 473, 4392
- Sawala et al. (2016) Sawala T. et al., 2016, MNRAS, 457, 1931
- Schaller et al. (2015) Schaller M. et al., 2015, MNRAS, 451, 1247
- Schaye (2004) Schaye J., 2004, ApJ, 609, 667
- Schaye et al. (2015) Schaye J. et al., 2015, MNRAS, 446, 521
- Spergel & Steinhardt (2000) Spergel D. N., Steinhardt P. J., 2000, Phys. Rev. Lett., 84, 3760
- Stinson et al. (2006) Stinson G., Seth A., Katz N., Wadsley J., Governato F., Quinn T., 2006, MNRAS, 373, 1074
- Stinson et al. (2013) Stinson G. S., Brook C., Macciò A. V., Wadsley J., Quinn T. R., Couchman H. M. P., 2013, MNRAS, 428, 129
- Swaters et al. (2009) Swaters R. A., Sancisi R., van Albada T. S., van der Hulst J. M., 2009, A&A, 493, 871
- Swaters et al. (2012) Swaters R. A., Sancisi R., van der Hulst J. M., van Albada T. S., 2012, MNRAS, 425, 2299
- Tollet et al. (2016) Tollet E. et al., 2016, MNRAS, 456, 3542
- Trachternach et al. (2008) Trachternach C., de Blok W. J. G., Walter F., Brinks E., Kennicutt, R. C. J., 2008, AJ, 136, 2720
- Tulin & Yu (2018) Tulin S., Yu H.-B., 2018, Phys. Rep., 730, 1
- Wadsley et al. (2004) Wadsley J. W., Stadel J., Quinn T., 2004, New A, 9, 137
- Wang et al. (2015) Wang L., Dutton A. A., Stinson G. S., Macciò A. V., Penzo C., Kang X., Keller B. W., Wadsley J., 2015, MNRAS, 454, 83
Appendix A SIDM transformation of LCDM halos
A.1 Analytical model
LCDM halos are well-characterized by a Navarro-Frenk-White (NFW) density profile (Navarro et al., 1996b, 1997),
| (3) |
which is fully specified by two parameters; e.g., a scale density, , and a scale radius, or, alternatively, by a maximum circular velocity, and the radius at which it is achieved, . The two radial scales are related by . The NFW profile has a central cusp where the velocity dispersion of dark matter particles (assuming isotropy) decreases steadily towards the centre, from a maximum value, , that occurs at a radius . The radial dependence of the NFW velocity dispersion has no simple algebraic form, but may be computed numerically by assuming equilibrium and solving Jeans’ equations (see; e.g., eq. 24 in More et al., 2009).
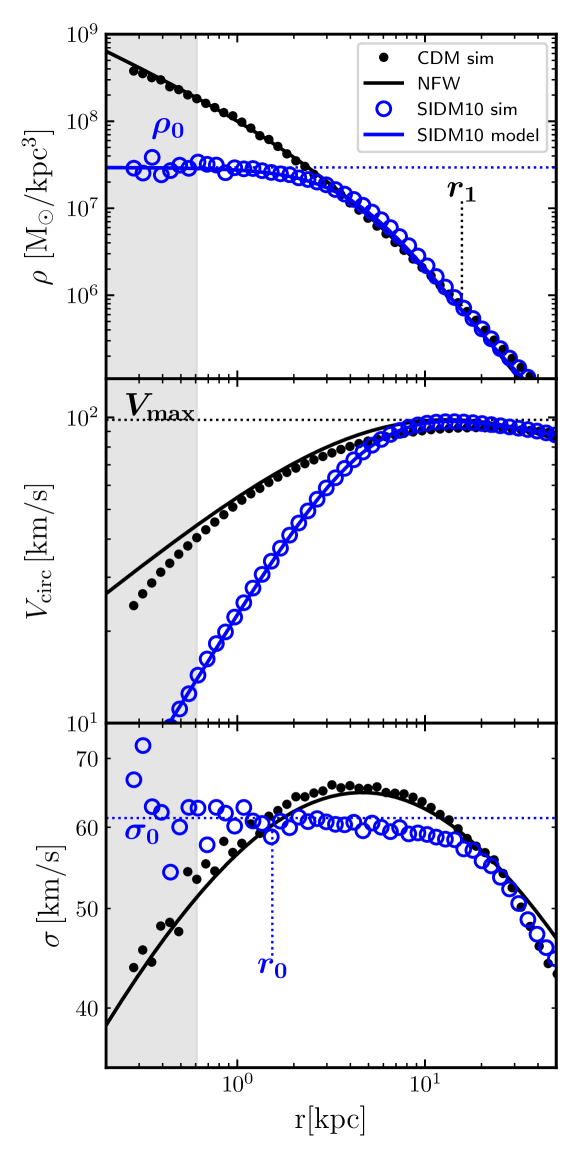
The solid black line in the top panel of Fig. 14 shows the NFW fit to the density profile of an LCDM halo of virial mass (solid black circles) selected from the AP-L1 dark-matter-only run. The fit has concentration ; kpc; and kpc3. Assuming isotropy, the NFW fit may be used to predict the velocity dispersion profile, which is shown in the bottom panel of Fig. 14.
The main effect of self-interactions is to “transfer heat” from the outside in, “thermalizing” in the process the inner velocity dispersion profile. This is demonstrated by the blue circles in the bottom-panel of Fig. 14, which corresponds to the same LCDM halo, but evolved with the dark-matter-only SIDM code (Sec. 3.4), with cm2/g.
The isothermal region of the SIDM halo extends out to roughly kpc, which is comparable to , the characteristic radius where, for the assumed cross section, the local density in the LCDM halo is such that one interaction is expected per Hubble time;
| (4) |
where, for the halo shown in Fig. 14 we have assumed .
The mass profile of the SIDM halo may be derived (assuming isotropy and spherical symmetry) by solving the hydrostatic equilibrium equation;
| (5) |
which, for constant, may be written as
| (6) |
where is a reference density. We can multiply eq. 6 by and differentiate to get
| (7) |
were we have used .
Differentiating Eq. 7, and defining , we have
| (8) |
where defines a characteristic “core” radius, . Expressing radii in units of the core, , we may rewrite Eq. 8 as
| (9) |
Note that, in principle, this equation permits a family of solutions for , many of which have cuspy inner profiles. (A simple example is, of course, the singular isothermal sphere.) Integrating eq. 9 numerically, therefore, requires that appropriate boundary conditions are set.
Motivated by the density profile of the numerical SIDM halo shown in the top panel of Fig. 14, we may set the conditions (i.e., finite central density) and (i.e., a flat density slope at the centre or “constant density core”) to solve for .
This solution gives a unique profile that may be scaled for any particular pair of values chosen from , , and . The thin blue lines in the top two panels of Fig. 14 show one of these profiles, and demonstrates that it provides an excellent fit to the actual inner density profile of simulated SIDM halos. This analytical model is similar to that of Kaplinghat et al. (2014).
A.2 Empirical relations
As decribed above, describing the inner mass profile of an SIDM halo requires that two parameters be specified. These parameters are expected to be closely related to the NFW parameters of its corresponding LCDM halo. We show this in Fig. 15 for matching pairs of halos identified in dark-matter-only LCDM and SIDM runs of one of the AP-L1 volumes. The SIDM run assumes cm2/g.
Fig. 15 shows the relation between the maximum circular velocity of the LCDM halo and the central velocity dispersion of its SIDM counterpart (, left panel), as well as the relation between the LCDM characteristic radius and the corresponding SIDM core radius, . These two relations, together with their scatter, may be used to generate a population of SIDM halos using the LCDM relation (and its scatter), since the mass and concentration of an NFW halo fully specify and . For Planck-normalized LCDM, and cm2/g,
| (10) |
provides a good approximation to this relation.
The blue bands shown in Fig. 8 were computed this way, after transforming thousands of Planck-normalized LCDM halos with and sampled from the mass-concentration relation of Ludlow et al. (2016). We emphasize that the relations shown in Fig. 15 are sensitive to the assumed value of cm2/g.
A.3 Including baryons in SIDM halos
The formulation described in Sec. A.1 may be easily modified to account for an additional (baryonic) mass component. In this case, the total gravitational potential is modified so that the circular velocity term in Eq. 5 is split between the dark matter and baryon contributions as . Carrying this change through the derivation yields a modified version of Eq. 9;
| (11) |
This allows the mass profile of the baryonic component, specified by , to be readily included when computing the dark matter profile of the SIDM halo. In order to set the appropriate boundary conditions, we note that isothermal distributions generally satisfy, from inspection of eq. 5, that
| (12) |
This implies that the deeper the central potential becomes because of the baryonic component, the higher the central dark matter density of the SIDM halo is expected to be.
In practice, our modeling proceeds as follows. Given an SIDM halo characterized by a central density and core radius, which fully specify its circular velocity profile, , we would like to compute how it would be modified by the addition of a baryonic component, specified by over the radial range (, ), where the rotation curve has been measured. The gravitational potential change between these two radii is given by
| (13) |
which, in turn, should set the drop in dark matter density from the centre to ; i.e., , according to Eq. 12.
We impose this condition when solving Eq. 11 to find the dark matter density profile in the presence of baryons. The final dark matter profile is renormalized by the universal baryon fraction to take into account the fact that the SIDM halo parameters computed as described in Sec. A.2 were computed from a dark-matter-only simulation. We also make a small adjustment to account for the fact that the potential wells of low mass halos in cosmological hydrodyamical simulations are systematically less deep than in dark-matter-only runs (see; e.g., Sawala et al., 2016). These adjustments have a minor effect on our results, but help to reconcile our analytical model with the results of the SIDM cosmological hydrodynamical run shown in the bottom-right panels of Fig. 8 and Fig. 9.
For illustration, we show two examples of our procedure in Fig. 16. This illustrates the effect on the inner dark matter profile of two rather different baryonic distributions; that of NGC 1075 (left) and that of IC 2574 (right), when added to two randomly drawn SIDM halos with maximum velocities matching the observed values of each of these galaxies. The solid black lines indicate the dark-matter-only SIDM profile; the dashed black lines are the resulting profiles after the baryons have been added. Note that the dashed-line profiles have less dark matter in total because of the baryonic mass renormalization described in the preceding paragraph. The addition of baryons leads, as expected, to dark matter profiles that are denser near the centre and that drop more sharply than their dark-matter-only counterparts.
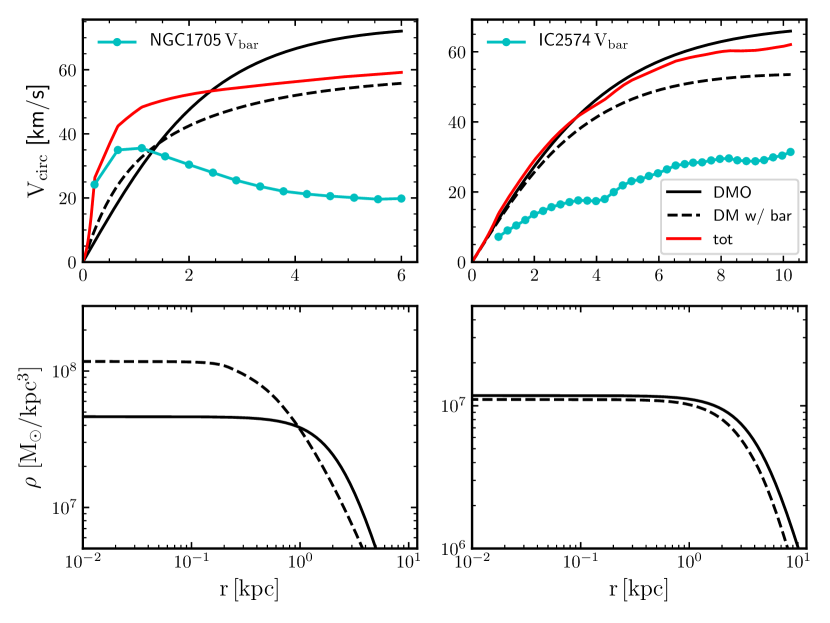
| Name | Sample | [km/s] | [km/s] | [km/s] | [km/s] | [] | [kpc] | [] |
|---|---|---|---|---|---|---|---|---|
| CamB | S | 20.10 | 13.85 | 6.85 | 10.08 | 5.35e+07 | 0.86 | 1.23e+09 |
| D512-2 | S | 37.20 | 16.34 | 24.04 | 11.80 | 2.70e+08 | 1.94 | 8.50e+09 |
| D564-8 | S | 25.00 | 9.24 | 11.17 | 6.66 | 5.51e+07 | 1.50 | 2.43e+09 |
| D631-7 | S | 58.50 | 24.51 | 29.50 | 23.54 | 4.84e+08 | 2.03 | 3.55e+10 |
| DDO064 | S | 46.90 | 25.29 | 36.67 | 16.28 | 3.59e+08 | 1.86 | 1.76e+10 |
| DDO154 | S | 48.20 | 18.73 | 27.37 | 13.90 | 3.92e+08 | 2.71 | 1.92e+10 |
| DDO161 | S | 67.50 | 35.35 | 32.14 | 25.01 | 2.11e+09 | 5.59 | 5.58e+10 |
| DDO168 | S | 55.00 | 25.90 | 35.00 | 23.08 | 6.45e+08 | 2.12 | 2.92e+10 |
| ESO079-G014 | S | 178.00 | 100.77 | 109.73 | 64.21 | 3.00e+10 | 9.46 | 1.21e+12 |
| ESO116-G012 | S | 112.00 | 52.33 | 83.47 | 47.73 | 3.59e+09 | 4.07 | 2.78e+11 |
| ESO444-G084 | S | 63.10 | 21.89 | 52.73 | 21.31 | 2.15e+08 | 1.38 | 4.51e+10 |
| ESO563-G021 | S | 321.00 | 200.92 | 286.19 | 176.36 | 1.88e+11 | 12.00 | 7.95e+12 |
| F565-V2 | S | 83.10 | 30.16 | 38.28 | 15.53 | 1.21e+09 | 6.13 | 1.08e+11 |
| F568-3 | S | 120.00 | 52.15 | 66.15 | 29.09 | 8.42e+09 | 10.60 | 3.46e+11 |
| F568-V1 | S | 118.00 | 44.75 | 91.59 | 28.75 | 5.23e+09 | 9.82 | 3.28e+11 |
| F571-8 | S | 144.00 | 81.10 | 93.14 | 70.96 | 7.45e+09 | 2.04 | 6.18e+11 |
| F574-1 | S | 99.70 | 46.48 | 68.23 | 29.70 | 7.96e+09 | 8.73 | 1.92e+11 |
| F583-1 | S | 86.90 | 41.35 | 44.55 | 13.55 | 3.32e+09 | 10.70 | 1.24e+11 |
| F583-4 | S | 69.90 | 31.15 | 43.05 | 23.48 | 1.71e+09 | 4.12 | 6.23e+10 |
| IC2574 | S | 67.50 | 32.02 | 19.54 | 12.57 | 1.89e+09 | 7.24 | 5.58e+10 |
| IC4202 | S | 250.00 | 181.45 | 231.32 | 165.39 | 1.06e+11 | 9.07 | 3.58e+12 |
| KK98-251 | S | 34.60 | 20.25 | 16.35 | 10.59 | 1.95e+08 | 1.83 | 6.76e+09 |
| NGC0024 | S | 110.00 | 52.54 | 106.73 | 51.90 | 2.84e+09 | 2.53 | 2.62e+11 |
| NGC0055 | S | 87.40 | 50.19 | 43.53 | 33.96 | 4.40e+09 | 6.74 | 1.26e+11 |
| NGC0100 | S | 91.20 | 40.75 | 56.83 | 36.27 | 4.26e+09 | 3.72 | 1.45e+11 |
| NGC0247 | S | 108.00 | 53.09 | 66.63 | 29.91 | 5.99e+09 | 8.02 | 2.48e+11 |
| NGC0289 | S | 194.00 | 160.25 | 174.05 | 156.00 | 7.26e+10 | 16.54 | 1.60e+12 |
| NGC0300 | S | 97.00 | 41.87 | 66.19 | 35.13 | 2.71e+09 | 4.56 | 1.76e+11 |
| NGC0801 | S | 238.00 | 199.22 | 233.82 | 195.75 | 1.87e+11 | 15.86 | 3.06e+12 |
| NGC0891 | S | 234.00 | 265.08 | 224.00 | 214.65 | 7.51e+10 | 2.79 | 2.90e+12 |
| NGC1003 | S | 115.00 | 59.35 | 74.39 | 55.38 | 1.12e+10 | 12.36 | 3.02e+11 |
| NGC1090 | S | 176.00 | 121.39 | 154.59 | 108.35 | 4.77e+10 | 8.68 | 1.17e+12 |
| NGC1705 | S | 73.20 | 35.42 | 72.84 | 29.77 | 4.51e+08 | 0.95 | 7.21e+10 |
| NGC2366 | S | 53.70 | 28.57 | 32.98 | 20.62 | 9.79e+08 | 3.25 | 2.71e+10 |
| NGC2403 | S | 136.00 | 75.85 | 117.48 | 75.48 | 9.28e+09 | 5.07 | 5.15e+11 |
| NGC2683 | S | 212.00 | 171.90 | 211.40 | 169.48 | 4.21e+10 | 3.45 | 2.12e+12 |
| NGC2841 | S | 323.00 | 231.30 | 322.93 | 214.81 | 1.07e+11 | 7.98 | 8.11e+12 |
| NGC2903 | S | 216.00 | 213.11 | 207.86 | 176.97 | 4.43e+10 | 2.58 | 2.25e+12 |
| NGC2915 | S | 86.50 | 35.40 | 77.83 | 27.64 | 9.96e+08 | 4.97 | 1.22e+11 |
| NGC2955 | S | 276.00 | 252.60 | 245.59 | 246.68 | 1.98e+11 | 8.12 | 4.91e+12 |
| NGC2998 | S | 214.00 | 157.58 | 204.14 | 150.74 | 1.07e+11 | 11.13 | 2.18e+12 |
| NGC3109 | S | 67.30 | 21.72 | 36.06 | 15.30 | 7.31e+08 | 3.92 | 5.52e+10 |
| NGC3198 | S | 157.00 | 101.32 | 118.91 | 85.11 | 3.36e+10 | 10.54 | 8.13e+11 |
| NGC3521 | S | 220.00 | 200.33 | 214.79 | 174.16 | 4.79e+10 | 2.99 | 2.38e+12 |
| NGC3726 | S | 169.00 | 131.38 | 119.56 | 111.65 | 4.37e+10 | 6.73 | 1.03e+12 |
| NGC3741 | S | 51.60 | 14.28 | 27.05 | 11.19 | 2.56e+08 | 3.79 | 2.39e+10 |
| NGC3769 | S | 126.00 | 98.81 | 106.57 | 98.43 | 1.67e+10 | 4.28 | 4.04e+11 |
| NGC3877 | S | 171.00 | 145.67 | 157.15 | 109.76 | 3.82e+10 | 6.22 | 1.07e+12 |
| NGC3893 | S | 194.00 | 152.06 | 193.30 | 149.89 | 3.70e+10 | 3.83 | 1.60e+12 |
| NGC3917 | S | 138.00 | 80.96 | 104.05 | 57.20 | 1.35e+10 | 6.35 | 5.40e+11 |
| NGC3953 | S | 224.00 | 176.03 | 211.67 | 159.61 | 7.44e+10 | 7.33 | 2.52e+12 |
| NGC3972 | S | 134.00 | 79.21 | 105.02 | 62.09 | 8.79e+09 | 4.75 | 4.91e+11 |
| NGC4010 | S | 129.00 | 77.65 | 86.12 | 68.91 | 1.24e+10 | 5.15 | 4.35e+11 |
| NGC4013 | S | 198.00 | 166.75 | 197.26 | 161.12 | 4.35e+10 | 5.49 | 1.70e+12 |
| NGC4051 | S | 161.00 | 141.36 | 131.17 | 103.88 | 5.12e+10 | 6.35 | 8.81e+11 |
| NGC4088 | S | 182.00 | 189.42 | 161.40 | 170.20 | 6.46e+10 | 5.21 | 1.30e+12 |
| NGC4100 | S | 195.00 | 147.99 | 185.05 | 132.10 | 3.38e+10 | 5.13 | 1.62e+12 |
| NGC4138 | S | 195.00 | 171.38 | 193.22 | 142.04 | 2.40e+10 | 2.61 | 1.62e+12 |
| NGC4157 | S | 201.00 | 182.02 | 194.60 | 174.37 | 6.38e+10 | 4.96 | 1.79e+12 |
| NGC4183 | S | 115.00 | 66.98 | 83.39 | 43.71 | 1.01e+10 | 7.10 | 3.02e+11 |
| NGC4217 | S | 191.00 | 234.50 | 177.25 | 205.45 | 4.61e+10 | 2.69 | 1.52e+12 |
| NGC4559 | S | 124.00 | 83.97 | 98.55 | 78.38 | 1.74e+10 | 7.55 | 3.84e+11 |
| NGC5033 | S | 225.00 | 241.63 | 224.72 | 185.97 | 7.03e+10 | 3.56 | 2.56e+12 |
| NGC5055 | S | 206.00 | 198.71 | 201.57 | 196.38 | 9.21e+10 | 5.53 | 1.93e+12 |
| NGC5371 | S | 242.00 | 213.77 | 214.79 | 173.23 | 1.85e+11 | 11.10 | 3.23e+12 |
| NGC5585 | S | 92.30 | 44.82 | 62.65 | 40.75 | 3.71e+09 | 4.59 | 1.50e+11 |
| NGC5907 | S | 235.00 | 165.49 | 218.01 | 139.96 | 1.16e+11 | 11.24 | 2.94e+12 |
| NGC5985 | S | 305.00 | 165.00 | 288.80 | 140.14 | 1.20e+11 | 12.81 | 6.75e+12 |
| NGC6015 | S | 166.00 | 106.26 | 151.16 | 106.20 | 2.38e+10 | 5.11 | 9.71e+11 |
| NGC6195 | S | 258.00 | 235.77 | 233.45 | 235.70 | 2.23e+11 | 10.62 | 3.96e+12 |
| NGC6503 | S | 121.00 | 101.33 | 119.67 | 91.08 | 8.74e+09 | 2.16 | 3.55e+11 |
| NGC6674 | S | 291.00 | 177.58 | 285.98 | 175.67 | 1.50e+11 | 10.19 | 5.81e+12 |
| NGC6946 | S | 181.00 | 195.85 | 176.12 | 149.58 | 4.06e+10 | 4.39 | 1.28e+12 |
| NGC7331 | S | 257.00 | 275.82 | 257.00 | 255.45 | 1.40e+11 | 4.40 | 3.91e+12 |
| NGC7793 | S | 116.00 | 72.47 | 102.82 | 72.45 | 4.67e+09 | 2.55 | 3.11e+11 |
| NGC7814 | S | 265.00 | 290.19 | 226.72 | 163.25 | 3.87e+10 | 1.66 | 4.31e+12 |
| PGC51017 | S | 20.50 | 18.81 | 20.27 | 12.47 | 3.45e+08 | 1.58 | 1.31e+09 |
| UGC00128 | S | 134.00 | 55.39 | 78.98 | 35.06 | 1.59e+10 | 18.83 | 4.91e+11 |
| UGC00191 | S | 83.85 | 42.19 | 71.49 | 30.11 | 2.79e+09 | 5.41 | 1.11e+11 |
| UGC00731 | S | 74.00 | 37.19 | 46.52 | 10.43 | 2.56e+09 | 7.30 | 7.46e+10 |
Table 1.
| Name | Sample | [km/s] | [km/s] | [km/s] | [km/s] | [] | [kpc] | [] |
|---|---|---|---|---|---|---|---|---|
| UGC00891 | S | 63.75 | 26.57 | 28.75 | 17.86 | 7.56e+08 | 3.50 | 4.65e+10 |
| UGC02259 | S | 90.00 | 36.92 | 76.15 | 29.49 | 1.52e+09 | 4.01 | 1.39e+11 |
| UGC02455 | S | 61.00 | 57.14 | 30.44 | 56.18 | 2.89e+09 | 1.93 | 4.05e+10 |
| UGC02487 | S | 383.00 | 251.56 | 376.62 | 250.17 | 2.69e+11 | 10.67 | 1.40e+13 |
| UGC02885 | S | 305.00 | 231.80 | 260.15 | 210.89 | 2.55e+11 | 21.76 | 6.75e+12 |
| UGC02916 | S | 218.00 | 237.95 | 209.71 | 197.65 | 9.30e+10 | 8.55 | 2.31e+12 |
| UGC02953 | S | 319.00 | 247.65 | 319.00 | 238.35 | 1.40e+11 | 5.31 | 7.79e+12 |
| UGC03205 | S | 237.00 | 174.00 | 236.00 | 173.49 | 6.97e+10 | 5.94 | 3.02e+12 |
| UGC03546 | S | 262.00 | 330.90 | 193.03 | 167.97 | 5.42e+10 | 2.52 | 4.16e+12 |
| UGC03580 | S | 131.00 | 97.26 | 96.63 | 84.30 | 1.24e+10 | 5.84 | 4.57e+11 |
| UGC04278 | S | 92.80 | 46.03 | 45.88 | 21.46 | 2.14e+09 | 5.70 | 1.53e+11 |
| UGC04305 | S | 37.30 | 33.87 | 24.47 | 19.17 | 1.29e+09 | 3.21 | 8.57e+09 |
| UGC04325 | S | 92.70 | 44.02 | 87.71 | 37.41 | 1.91e+09 | 3.14 | 1.52e+11 |
| UGC04499 | S | 74.30 | 39.87 | 49.06 | 27.20 | 2.24e+09 | 4.77 | 7.56e+10 |
| UGC05005 | S | 100.00 | 43.08 | 37.87 | 25.08 | 6.16e+09 | 15.24 | 1.94e+11 |
| UGC05253 | S | 248.00 | 238.24 | 246.00 | 208.09 | 1.08e+11 | 6.08 | 3.49e+12 |
| UGC05414 | S | 61.40 | 33.68 | 41.04 | 26.20 | 1.32e+09 | 2.52 | 4.13e+10 |
| UGC05716 | S | 74.70 | 31.57 | 49.52 | 20.96 | 1.75e+09 | 6.86 | 7.69e+10 |
| UGC05721 | S | 82.60 | 34.76 | 81.92 | 29.52 | 1.01e+09 | 3.33 | 1.06e+11 |
| UGC05750 | S | 78.90 | 41.46 | 24.89 | 15.88 | 3.13e+09 | 13.59 | 9.14e+10 |
| UGC05764 | S | 55.80 | 22.22 | 49.25 | 16.24 | 2.59e+08 | 2.08 | 3.05e+10 |
| UGC05829 | S | 68.60 | 37.43 | 34.69 | 12.54 | 1.64e+09 | 5.10 | 5.87e+10 |
| UGC05918 | S | 44.50 | 19.72 | 29.16 | 9.21 | 5.12e+08 | 3.04 | 1.49e+10 |
| UGC05986 | S | 116.00 | 56.04 | 98.38 | 51.27 | 5.89e+09 | 3.44 | 3.11e+11 |
| UGC06399 | S | 87.60 | 38.86 | 58.74 | 27.28 | 2.04e+09 | 4.54 | 1.27e+11 |
| UGC06446 | S | 84.90 | 38.55 | 64.44 | 24.16 | 2.33e+09 | 6.00 | 1.15e+11 |
| UGC06614 | S | 205.00 | 209.41 | 184.29 | 186.91 | 9.13e+10 | 13.15 | 1.90e+12 |
| UGC06667 | S | 85.70 | 30.25 | 54.81 | 12.29 | 1.77e+09 | 5.12 | 1.19e+11 |
| UGC06786 | S | 229.00 | 175.04 | 219.00 | 155.28 | 4.34e+10 | 4.47 | 2.71e+12 |
| UGC06787 | S | 276.00 | 271.81 | 243.26 | 170.76 | 5.58e+10 | 2.77 | 4.91e+12 |
| UGC06818 | S | 74.40 | 32.73 | 31.86 | 28.59 | 2.23e+09 | 3.73 | 7.59e+10 |
| UGC06917 | S | 111.00 | 56.30 | 79.59 | 43.25 | 6.11e+09 | 6.44 | 2.70e+11 |
| UGC06923 | S | 81.10 | 47.91 | 61.65 | 43.56 | 2.52e+09 | 2.88 | 9.97e+10 |
| UGC06930 | S | 109.00 | 60.56 | 78.67 | 41.51 | 8.77e+09 | 8.06 | 2.55e+11 |
| UGC06983 | S | 113.00 | 51.91 | 90.67 | 43.65 | 6.60e+09 | 7.81 | 2.86e+11 |
| UGC07089 | S | 79.10 | 42.06 | 40.58 | 29.31 | 3.41e+09 | 5.01 | 9.22e+10 |
| UGC07125 | S | 65.60 | 44.56 | 31.20 | 24.34 | 7.51e+09 | 10.46 | 5.10e+10 |
| UGC07151 | S | 76.20 | 44.10 | 64.66 | 36.63 | 1.96e+09 | 3.54 | 8.19e+10 |
| UGC07323 | S | 85.60 | 51.74 | 52.58 | 35.03 | 3.01e+09 | 3.91 | 1.18e+11 |
| UGC07399 | S | 106.00 | 33.87 | 91.53 | 32.51 | 1.57e+09 | 3.27 | 2.33e+11 |
| UGC07524 | S | 83.80 | 43.92 | 44.96 | 19.35 | 3.58e+09 | 7.73 | 1.11e+11 |
| UGC07559 | S | 32.10 | 19.76 | 18.91 | 13.18 | 2.79e+08 | 1.79 | 5.34e+09 |
| UGC07577 | S | 17.80 | 12.60 | 6.69 | 5.52 | 8.10e+07 | 1.10 | 8.39e+08 |
| UGC07603 | S | 64.00 | 27.55 | 58.22 | 27.15 | 5.31e+08 | 1.56 | 4.71e+10 |
| UGC07690 | S | 60.70 | 36.49 | 60.65 | 35.71 | 9.48e+08 | 1.59 | 3.99e+10 |
| UGC07866 | S | 33.10 | 18.42 | 23.18 | 12.75 | 2.19e+08 | 1.53 | 5.88e+09 |
| UGC08286 | S | 84.30 | 35.34 | 72.65 | 29.57 | 1.48e+09 | 3.94 | 1.13e+11 |
| UGC08490 | S | 80.10 | 35.71 | 76.29 | 35.55 | 1.47e+09 | 2.96 | 9.59e+10 |
| UGC08550 | S | 57.80 | 24.64 | 48.45 | 23.06 | 5.28e+08 | 3.96 | 3.41e+10 |
| UGC08699 | S | 202.00 | 214.73 | 170.49 | 125.86 | 3.01e+10 | 3.85 | 1.82e+12 |
| UGC08837 | S | 48.00 | 29.32 | 18.56 | 13.25 | 6.76e+08 | 2.82 | 1.90e+10 |
| UGC09037 | S | 160.00 | 116.33 | 102.52 | 107.36 | 5.97e+10 | 10.23 | 8.64e+11 |
| UGC09133 | S | 289.00 | 283.20 | 287.52 | 244.07 | 1.86e+11 | 8.06 | 5.69e+12 |
| UGC10310 | S | 73.20 | 40.86 | 52.31 | 24.84 | 2.46e+09 | 4.84 | 7.21e+10 |
| UGC11455 | S | 291.00 | 232.15 | 232.60 | 204.66 | 2.05e+11 | 10.36 | 5.81e+12 |
| UGC11820 | S | 84.45 | 38.77 | 49.23 | 20.19 | 3.11e+09 | 8.75 | 1.13e+11 |
| UGC12506 | S | 255.00 | 134.55 | 210.25 | 101.90 | 1.17e+11 | 18.78 | 3.82e+12 |
| UGC12632 | S | 73.20 | 36.66 | 44.04 | 18.21 | 2.97e+09 | 7.28 | 7.21e+10 |
| UGC12732 | S | 98.00 | 46.29 | 59.03 | 23.06 | 5.70e+09 | 11.78 | 1.82e+11 |
| UGCA442 | S | 57.80 | 24.49 | 34.31 | 18.27 | 4.20e+08 | 2.18 | 3.41e+10 |
| UGCA444 | S | 38.30 | 16.18 | 25.38 | 14.49 | 9.51e+07 | 1.19 | 9.32e+09 |
| U11707 | A | 103.74 | 32.33 | 63.19 | 22.91 | 2.24e+09 | 5.99 | 2.18e+11 |
| N2552 | A | 96.10 | 35.28 | 68.53 | 30.81 | 1.78e+09 | 3.43 | 1.71e+11 |
| wlm | LT | 38.53 | 14.84 | 26.93 | 10.86 | 1.73e+08 | 2.22 | 9.49e+09 |
| ddo87 | LT | 56.63 | 18.79 | 22.83 | 4.92 | 5.85e+08 | 4.68 | 3.20e+10 |
| ddo50 | LT | 38.84 | 33.88 | 22.29 | 7.38 | 1.67e+09 | 4.62 | 9.74e+09 |
| ddo52 | LT | 61.72 | 22.52 | 38.71 | 10.70 | 6.30e+08 | 3.80 | 4.20e+10 |
| ngc1569 | LT | 39.28 | 38.68 | 23.57 | 20.45 | 1.12e+09 | 2.84 | 1.01e+10 |
| haro29 | LT | 43.49 | 12.00 | 29.82 | 9.69 | 1.68e+08 | 4.36 | 1.39e+10 |
| cvnidwa | LT | 26.45 | 8.89 | 9.14 | 8.43 | 4.53e+07 | 1.68 | 2.91e+09 |
| ddo133 | LT | 46.73 | 18.84 | 32.36 | 11.48 | 2.87e+08 | 2.28 | 1.74e+10 |
| ic1613 | LT | 21.13 | 15.29 | 6.13 | 5.03 | 1.47e+08 | 1.82 | 1.44e+09 |
| ddo216 | LT | 18.91 | 8.45 | 12.69 | 6.90 | 1.73e+07 | 0.60 | 1.01e+09 |
| ddo126 | LT | 38.74 | 18.70 | 19.63 | 10.07 | 2.91e+08 | 2.44 | 9.66e+09 |
| NGC925 | TH | 114.50 | 75.56 | 54.41 | 46.03 | 1.73e+10 | 9.65 | 2.98e+11 |
| NGC3621 | TH | 159.20 | 118.03 | 130.41 | 116.23 | 3.48e+10 | 6.38 | 8.50e+11 |
| ngc4396 | R | 99.46 | 30.63 | 79.58 | 30.13 | 1.12e+09 | 2.71 | 1.91e+11 |
| ngc6106 | R | 124.75 | 68.67 | 114.06 | 68.32 | 5.46e+09 | 2.58 | 3.91e+11 |
| ugc4169 | R | 97.72 | 46.37 | 74.84 | 38.39 | 3.11e+09 | 3.65 | 1.80e+11 |
| ugc3371 | R | 64.01 | 15.95 | 36.79 | 10.54 | 3.98e+08 | 4.26 | 4.71e+10 |