Optical Counterpart to the Ultraluminous X-Ray Source in the UGC 6456 Galaxy
Abstract
We report the identification of the optical counterpart to the transient ultraluminuos X-ray source in the blue dwarf galaxy UGC 6456 (VII Zw 403). The source is highly variable in both the X-ray (more 100 times, 0.3–10 keV) and optical (more 3 times, V band) ranges. The peak X-ray luminosity of UGC 6456 ULX exceeds erg s-1; the absolute magnitude when the source is optically bright is M, which makes this source one of the brightest ULXs in the optical range. We found a correlation between the optical and X-ray fluxes (with a coefficient of ), which may indicate that the optical emission is produced by re-processing of the X-rays in outer parts of the optically-thick wind coming from the supercritical accretion disk. Optical spectra of UGC 6456 ULX show broad and variable hydrogen and helium emission lines, which also confirms the presence of the strong wind.
1 Introduction
Ultraluminous X-ray sources (ULXs) are variable objects whose luminosity exceeds the Eddington limit for stellar mass black holes ( erg s-1), assuming isotropic emission. These objects are located outside the centers of galaxies, that is, they are not super-massive black holes. Early papers on ULXs suggested intermediate mass black holes (IMBHs; M⊙) as accretors in these systems (e.g., Colbert & Mushotzky 1999). However, studies of the last decade (Gladstone et al., 2009; Sutton et al., 2013; Fabrika et al., 2015; Pinto et al., 2016; Walton et al., 2018) have shown that observational properties of most ULXs can be explained by supercritical gas accretion onto black holes of stellar masses (from a few to several tens masses of the Sun), or even onto neutron stars. The last possibility has been convincingly confirmed by detection of coherent X-ray pulsations in six ULXs (Bachetti et al., 2014; Fürst et al., 2016; Israel et al., 2016; Carpano et al., 2018; Sathyaprakash et al., 2019; Rodríguez Castillo et al., 2019).
In contrast to the X-ray range, in the optical one ULXs are studied much more poorly. Only ULXs have been unequivocally identified using the Hubble Space Telescope (HST) data. All of them are faint sources with visual magnitudes of (Tao et al., 2011; Gladstone et al., 2013). Moreover, most ULXs are associated with star-forming regions (e.g., Poutanen et al. 2013) and located in crowded regions, which makes it difficult to study them with ground-based telescopes.
Here we present the identification of the optical counterpart to the ULX in the galaxy UGC 6456 (VII Zw 403), which is one of the closest blue compact dwarf galaxies (D = 4.54 Mpc, Tully et al. 2013). UGC 6456 ULX is a transient ULX: its X-ray luminosity changes by more than two orders of magnitude with a peak value of erg s-1 in the 0.3–8 keV energy range (Brorby et al., 2015). In the bright state, the sources shows a very hard power-law spectrum with a photon index of . We report the presence of a correlation between the long-term X-ray and optical variability of UGC 6456 ULX and present results of the optical spectroscopy.
2 Astrometry
To identify the optical counterpart of UGC 6456 ULX, we used archival images from the Chandra X-Ray Observatory and HST. Chandra observed the source only once, on 2000 January 7 (ObsID 871). The source was positioned on the S3 chip of the Advanced CCD Imaging Spectrometer (ACIS) with a very small offset from the optical axis (). The ULX coordinates in the ACIS image obtained with the Wavdetect task of CIAO 4.11 is R.A.(J2000), Decl.(J2000) with a statistic error of and an absolute astrometric uncertainty of at 90% confidence level111http://cxc.harvard.edu/cal/ASPECT/celmon/.
In the optical range, we have chosen the HST observation taken on 1994 February 16 with the Wide Field and Planetary Camera 2 (WFPC2) in the F555W filter. To apply astrometric corrections to the HST image, we used four reference stars that present in the Gaia Data Release 2 (Gaia Collaboration, 2018). After accounting for the shifts, derived standard deviation of the difference between Gaia and corrected HST positions of the reference stars became less than , and the resultant absolute astrometric uncertainty about at the 90% confidence level.
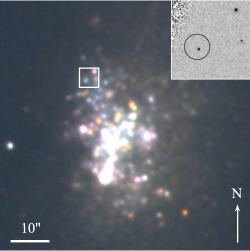
There is only one relatively bright object in the WFPC2/F555W image within the Chandra error circle of UGC 6456 ULX (left panel of Figure 1). It is a point-like source with a visual magnitude of () in the Vegamag system222Photometry was performed on c0f image in HSTPHOT 1.1 (Dolphin, 2000). At the galaxy distance this corresponds to an absolute magnitude of M after correction for reddening of A mag (see Section 4).
3 X-ray and optical variability

The ULX was observed 17 times with the X-ray telescope of the Neil Gehrels Swift Observatory (Swift/XRT) since January 2011. From 2014 March 16 through 2014 April 6 the observations were made every few days. Exposure times were in the range of 230–4170 s. To extract a light curve we utilized preprocessed event files provided by the UK Swift data centre333https://www.swift.ac.uk. The source events were extracted from a circular region of 30 arcsec radius using the XSELECT task of HEASOFT 6.26.1. The background was taken from an annulus with inner and outer radii of 80 and 130 arcsec, respectively, centered on the source. The resulting light curve is shown in Fig. 2.
| Date | Telescope | , s | Count rate or V magnitude |
|---|---|---|---|
| 2017-04-30 | Zeiss-1000 | 900 | |
| 2017-05-02 | Swift/XRT | 2055 | |
| 2017-07-21† | BTA | 330 | |
| 2017-07-24∗ | Swift/XRT | 1770 | |
| 2017-07-27† | Zeiss-1000 | 2400 | |
| 2017-08-15 | BTA | 360 | |
| 2017-08-16 | Swift/XRT | 1690 | |
| 2018-04-11 | Zeiss-1000 | 1800 | |
| 2018-04-11 | Swift/XRT | 1840 | |
| 2019-04-06 | Zeiss-1000 | 1200 | |
| 2019-04-13∗ | Swift/XRT | 230 |
Note. — †This pair of the optical observations was averaged. ∗Only a 90% upper limit to the count rate is provided due to low statistics.
Starting from April 2017, we carried out five quasi-simultaneous observations with Swift/XRT and optical telescopes of SAO RAS in V band (the Zeiss-1000 equipped with a CCD photometer and the 6-m telescope BTA with the multi-mode focal reducer SCORPIO (Afanasiev & Moiseev, 2005)). The time intervals between the X-ray and optical observations were within 1 day in the bright state of the ULX and in the range from 1.6 to days in the faint state (Table 1). An aperture photometry of the UGC 6456 ULX counterpart was done with the APPHOT package in IRAF. To check the object for variability we used four stars with colors similar to those of the object as reference sources. The seeing was from to in all the observations. The obtained magnitudes were converted to the Vegamag system using three relatively bright isolated stars whose magnitudes were measured from the HST/WFPC2/F555W data.
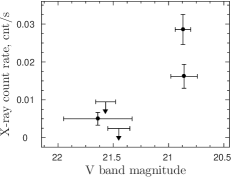
During these quasi-simultaneous observations the Swift count rate changed by at least 6 times, and the visual magnitude by m mag (from M to M). We found a correlation between the fluxes in these two bands (Fig. 2, right panel) with a Pearson correlation coefficient of , which corresponds to the p-vales of 0.07. Moreover, since the observations are not purely synchronous, the observed correlation might be underestimated because the X-ray flux demonstrate rapid changes (up to 3 times within one day).
4 Optical spectroscopy
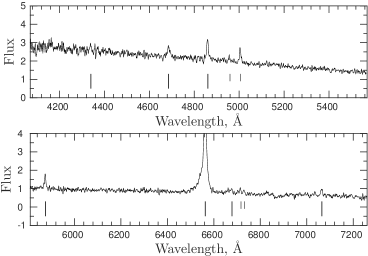
The optical spectra were obtained with the BTA/SCORPIO in 2015–2019; the 1″ slit and four grisms were used. In our work we use one observation conducted with the VPHG1200B grism (spectral range is 3600-5400 Å, resolution Å), seven observations with VPHG1200G (4000-5700 Å, Å), one with VPHG1200R (5700-7500 Å, Å) and the remaining four observations with VPHG550G (3500-7200 Å, Å). Seeing varied from 1″ to 2″. Data reduction was carried out with the LONG context in MIDAS using standard algorithm. The spectra were extracted with the SPEXTRA package (Sarkisyan et al., 2017).
Two spectra with the best signal-to-noise ratio are shown in the right panel of Fig. 1. The spectra are not simultaneous. The first one taken with the VPHG1200R grism was obtained on 2015 February 23, whereas the second with VPHG1200G on 2015 September 7. A broad He II line is clearly seen. Its width after correction for the spectral resolution is FWHM km s-1. The blue spectrum contains also a weak broad component of the Hβ emission line with the width comparable to that of the He II line and also possible contains Hγ emission and Hδ absorption lines. In the red spectrum, there are relatively broad He I emission lines with FWHMs (after correction for the spectral resolution) of km s-1 (He I ) and km s-1 (He I ). We also detected He I line, but we can not reliable estimate its width due to low signal-to-noise ratio. A very strong and asymmetric Hα line has wings extending over 90 Å.
Narrow emission lines ([O III] , [S II] as well as the narrow components of the Hβ and Hα) can be formed in a nebula near the source (which, however, may be too compact and too weak to be seen in Fig.1).
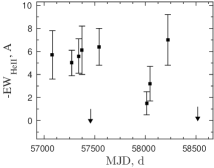
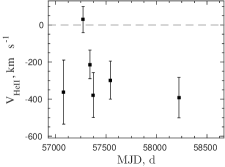
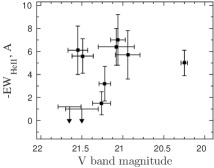
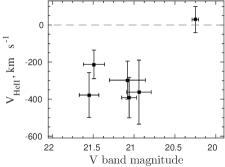
All the wide lines are highly variable. We have investigated a behavior of the He II line because it is not contaminated by the nebula emission. Its equivalent width (EW) vary from to Å (when the line is nearly undetectable, the left panels of Fig. 3) and the width from to km s-1. Also we found changes in the radial velocity up to 400 km s-1 (the right panels of Fig. 3) but additional observations are required to distinguish whether the nature of these changes is periodic or stochastic. Barycentric corrections are taken into account. We note that for the VPHG1200B and G observations the accuracy of the radial velocity measurements is better than 15 km s-1 and better than 30 km s-1 for the VPHG550G ones.
All the optical spectra were taken together with V-band images which allow us to check a possible correlation between the He II equivalent width and the optical brightness of the source. The photometry was performed by the same method as described in section 3. We found that the object V magnitude varied during these observations by m mag (from to ). The equivalent widths and radial velocities of the He II line versus the obtained V magnitudes are shown in bottom panel of Fig. 3. It is seen that, in general, the is held near 5–6 Å regardless of the source optical brightness, however, when the source is faint the line may sometimes weaken. The constancy of the line EW implies that the total flux in the line increases as the source become brighter. Binder et al. (2018) analysing simultaneous optical spectroscopy–X-ray observation of NGC 300 ULX-1 found that the X-ray flux and the flux in the He II are correlated. Our spectroscopic and X-ray observations are not simultaneous, nevertheless, combining the relation between the line flux and mV with the relation between mV and the X-ray count rate (Fig. 2), we can conclude that similar correlation may occur in the case of UGC 6456 ULX as well. However new observations are still needed to prove this more reliable. Another interesting feature is that the He II line showed the largest jump of the radial velocity when the source was in the brightest state.
Using observed ratios of the hydrogen lines in the nebula (Hγ/Hβ and Hα/Hβ), we determined the reddening value of A mag. In our calculation we assumed Case B of photoionization (Osterbrock & Ferland, 2006). However, we have to note that it is unknown whether the nebula is associated with the ULX or just lie on the line of sight. To clarify this, one needs additional high resolution observations in narrow filters. Nevertheless, all the nebulae in the area of the object show approximately the same reddening, therefore, we believe that the estimate of A mag is reliable regardless of the nature of the nebula whose lines are observed in the spectrum.
5 Conclusions
We have identified UGC 6456 ULX with the single optical source that falls into the astrometry error circle. Discovered optical counterpart is one of the brightest among all identified ULXs (MV up to ; the AV uncertainty was taking into account). The object demonstrates high optical and X-ray variability, which has an amplitude similar to that observed in the well studied ULX with a neutron star NGC 7793 P13 (Fürst et al., 2018). We found a correlation between the optical and X-ray fluxes, which may indicate that the optical emission originates from re-processing of X-rays in the outer parts of the strong wind from the supercritical disk. The existence of such a wind is confirmed by the broad hydrogen and helium emission lines in the optical spectra, that are typical for many spectroscopically studied ULXs (Fabrika et al., 2015).
Nevertheless, some ULXs show optical spectra that differ to varying degree from each other and from the spectrum of UGC 6456 ULX. For example, M101 ULX-1 shows only broad helium and nitrogen emission lines belonging to a Wolf-Rayet donor (Liu et al., 2013), which indicates that this system is more evolved than UGC 6456 ULX, where the donor must be a hydrogen rich star. Optical spectra of NGC 7793 P13 are dominated by emission from a B9Ia donor star (Motch et al., 2014): the spectra exhibit strong high-order Balmer absorption lines, as well as relative weak absorption lines of He I, Si II, Fe II, and Mg II. More typical for ULXs emission lines of hydrogen (up to Hγ), He II and Bowen blend CIII-NIII are also present in the source spectrum; these lines may originate either from some structures of the accretion disk (like a disk bulge at the point where the stream of matter escaping L1 impacts the edge of the disc, Motch et al. 2011) or from the accretion disk wind. In contrast to this, the ultraluminous pulsar NGC 300 ULX-1 have a much more complex emission spectrum (Binder et al., 2018; Heida et al., 2019) indicating the presence of a km s-1 outflow and ionization by X-rays. In particular, the He II line luminosity was found to be correlated with the soft X-ray emission. Our results hints that in the case of UGC 6456 ULX similar correlation also may be present.
We believe that uniquely high optical brightness of UGC 6456 ULX, isolation from other bright stars together with high variability in both X-ray and optical bands make this source the best target for studying the nature of optical emission from ULXs.
References
- Afanasiev & Moiseev (2005) Afanasiev, V. L., & Moiseev, A. V. 2005, Astronomy Letters, 31, 194
- Bachetti et al. (2014) Bachetti, M., Harrison, F. A., Walton, D. J., et al. 2014, Nature, 514, 202
- Binder et al. (2018) Binder, B., Levesque, E. M., & Dorn-Wallenstein, T. 2018, ApJ, 863, 141
- Brorby et al. (2015) Brorby, M., Kaaret, P., & Feng, H. 2015, MNRAS, 448, 3374
- Carpano et al. (2018) Carpano, S., Haberl, F., Maitra, C., & Vasilopoulos, G. 2018, MNRAS, 476, L45
- Colbert & Mushotzky (1999) Colbert, E. J. M., & Mushotzky, R. F. 1999, ApJ, 519, 89
- Dolphin (2000) Dolphin, A. E. 2000, PASP, 112, 1397
- Fabrika et al. (2015) Fabrika, S., Ueda, Y., Vinokurov, A., Sholukhova, O., & Shidatsu, M. 2015, Nature Physics, 11, 551
- Fürst et al. (2016) Fürst, F., Walton, D. J., Harrison, F. A., et al. 2016, ApJ, 831, L14
- Fürst et al. (2018) Fürst, F., Walton, D. J., Heida, M., et al. 2018, A&A, 616, A186
- Gaia Collaboration (2018) Gaia Collaboration: Brown, A. G. A., Vallenari, A., et al. 2018, A&A, 616, A1
- Gladstone et al. (2013) Gladstone, J. C., Copperwheat, C., Heinke, C. O., et al. 2013, ApJS, 206, 14
- Gladstone et al. (2009) Gladstone, J. C., Roberts, T. P., & Done, C. 2009, MNRAS, 397, 1836
- Heida et al. (2019) Heida, M., Lau, R. M., Davies, B., et al. 2019, ApJ, 883, L34
- Israel et al. (2016) Israel, G. L., Belfiore, A., Stella, L., et al. 2016, arXiv:1609.07375
- Liu et al. (2013) Liu, J.-F., Bregman, J. N., Bai, Y., et al. 2013, Nature, 503, 500
- Motch et al. (2014) Motch, C., Pakull, M. W., Soria, R., et al. 2014, Nature, 514, 198
- Motch et al. (2011) Motch, C., Pakull, M. W., Grisé, F., et al. 2011, Astronomische Nachrichten, 332, 367
- Osterbrock & Ferland (2006) Osterbrock, D. E., & Ferland, G. J. 2006, Astrophysics of gaseous nebulae and active galactic nuclei
- Pinto et al. (2016) Pinto, C., Middleton, M. J., & Fabian, A. C. 2016, Nature, 533, 64
- Poutanen et al. (2013) Poutanen, J., Fabrika, S., Valeev, A. F., Sholukhova, O., & Greiner, J. 2013, MNRAS, 432, 506
- Rodríguez Castillo et al. (2019) Rodríguez Castillo, G. A., Israel, G. L., Belfiore, A., et al. 2019, arXiv e-prints, arXiv:1906.04791
- Sarkisyan et al. (2017) Sarkisyan, A. N., Vinokurov, A. S., Solovieva, Y. N., et al. 2017, Astrophysical Bulletin, 72, 486
- Sathyaprakash et al. (2019) Sathyaprakash, R., Roberts, T. P., Walton, D. J., et al. 2019, MNRAS, 488, L35
- Sutton et al. (2013) Sutton, A. D., Roberts, T. P., & Middleton, M. J. 2013, MNRAS, 435, 1758
- Tao et al. (2011) Tao, L., Feng, H., Grisé, F., & Kaaret, P. 2011, ApJ, 737, 81
- Tully et al. (2013) Tully, R. B., Courtois, H. M., Dolphin, A. E., et al. 2013, AJ, 146, 86
- Walton et al. (2018) Walton, D. J., Fürst, F., Heida, M., et al. 2018, ApJ, 856, 128