Finite Temperature Phase Behavior of Viral Capsids as Oriented Particle Shells
Abstract
A general phase-plot is proposed for discrete particle shells that allows for thermal fluctuations of the shell geometry and of the inter-particle connectivities. The phase plot contains a first-order melting transition, a buckling transition and a collapse transition and is used to interpret the thermodynamics of microbiological shells.
The development of shells that protect microbiological systems from a hostile environment yet still allow for exchange of key nutrients was an essential step in the evolution of life Alberts (2017). These shells are composed of molecules decorated with both hydrophobic and hydrophilic groups (“amphiphiles”) in such a way that in an aqueous environment they assemble into closed, semi-permeable shells. An important example are the amphiphilic protein shells that surround viruses Baker et al. (1999) as well as many bacteria and most archaea Sleytr et al. (2014). Cryogenic-based microscopy studies Baker et al. (1999) had indicated that these “capsids” in general are strictly organized, crystallographic structures (usually icosahedral or helical) Caspar and Klug (1962) but this view is being challenged. Thermodynamic studies of viral self-assembly indicate, for the case of the assembly of viruses in solutions with higher protein concentrations, that the interaction energies between capsid proteins (“subunits”) should be no more than a few times the thermal energy at room temperature in order to avoid the production of malformed capsids Ceres and Zlotnick (2002a); Katen and Zlotnick (2009); Nguyen et al. (2009)111This is due to kinetic trapping. For lower protein concentrations, the probability of kinetic trapping is reduced and interaction energies can be higher. Dykeman et al. (2014). Finite temperature studies also showed that, due to thermal fluctuations, at least some viral capsids are dynamical in nature and that the dynamics plays a role in the life-cycle of the virus Bothner et al. (1999); Speir et al. (2006). Some capsids are even in a molten or “pleomorphic” state Battisti (2011), 222The Archaeal and Bunyaviridae families of viruses (which includes the Hanta viruses) Prangishvili et al. (2006); Överby et al. (2008); Pietilä et al. (2010) are important examples. The Gaussian curvature of some of the Archaeal pleomorphs evolves over time Prangishvili et al. (2006), indicating that they are in a fluid-like state Perotti et al. (2016); Vitelli et al. (2006). Finally, all-atom Molecular Dynamics (MD) simulations of capsids revealed that they can collapse under the action of thermal fluctuations Freddolino et al. (2006).
The study of the melting and thermal collapse of a shell with a limited number of constituent components ( is an interesting statistical physics problem in its own right. The geometry of the shell over which the components are moving itself is defined by the position vectors of these same particles and hence subject to thermal fluctuations Nelson and Peliti (1987). Here, we propose a generic phase-diagram for the melting and collapse of discrete shells obtained by comparing MD simulations of a coarse-grained model of capsids with the continuum theory of thermally fluctuating surfaces.
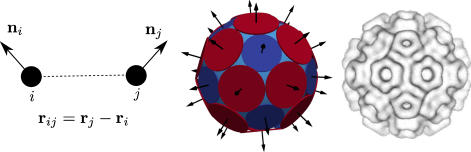
We first discuss the MD simulations. The coarse-grained model is based on the so-called Oriented Particle System (or “OPS”) Szeliski and Tonnesen (1992). An OPS is defined as a cluster of orientable and interacting point particles located at . An orientation-dependent pair interaction acts between particle pairs i and j with a separation vector and unit vectors and describing their orientations (see Fig. 1 (left)).
The oriented pair interaction used in the simulations was
| (1) |
The first term is the Morse pair interaction Lee and Lee (2008), with the binding energy , the equilibrium bond distance , and the width of potential well . The second and third terms are known as the “co-normality” and “co-circularity” terms of an OPS system. Together, these two terms are minimized if the two particles have the same orientation and if that shared orientation is perpendicular to the unit vector that is directed along the separation vector. Only interactions between particles that are nearest neighbors are included, where the set of nearest neighbors can change over time due to thermal fluctuations.
An OPS can be viewed as a coarse-grained representation of a viral capsid by having the particle locations correspond to the centers of the “capsomers” of viral capsids. The latter are disk-like groups of either six or five subunits that frequently act as the basic building blocks of a capsid Caspar and Klug (1962); Johnson and Speir (1997). The orientational degrees of freedom correspond to the normals to the capsomers, the depth of the Morse potential to the capsomer binding energy (of the order of a few Ceres and Zlotnick (2002b); Zlotnick (2003)), and the length scale to the diameter of a capsomer (of the order of a few nanometer Baker et al. (1999)). Because the range of the hydrophobic attraction between capsomers is short compared to their diameter, the dimensionless parameter characterizing the width of the Morse potential needs to be significantly larger than one. We used . Next, is a measure of the bending stiffness of the shell (estimated to be in the range of Nguyen et al. (2005); Roos et al. (2010)). Finally, because a large energy penalty is known to obstruct the removal of single capsomers from assembled shells Morozov et al. (2009), evaporation of particles from the OPS shell is suppressed by a soft fixed-area constraint imposed via the Augmented Lagrange Multiplier method (see (Sup, , Section I)).
Figure 1 (middle) shows the minimum energy state of an OPS for the case that is large compared to one. The shell has icosahedral symmetry with the twelve blue disks indicating the five-fold symmetry sites of the icosahedron (for actual capsids, these disks would correspond to pentameric protein capsomers while the remaining twenty red disks would correspond to hexameric capsomers). This structure should be compared to that of the “T=3” icosahedral pattern Caspar and Klug (1962) of the capsomers of the capsid of the Cowpea Chlorotic Mottle virus (CCMV) Liu et al. (2003) shown in the right of Figure 1.
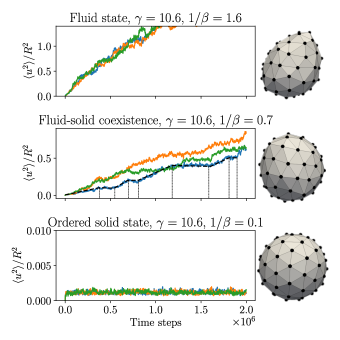
Next, we carried out Brownian Dynamics simulations of OPS systems using computational methods discussed further in the Supplemental Materials (Sup, , Section I). The phase behavior was determined in terms of the two thermodynamic parameters , a dimensionless measure of temperature in units of the depth of the pair interaction, and a dimensionless measure of the inverse of the bending stiffness ( is the shell radius). In continuum theory is known as as the Föppl-von Kármán (FvK) Number Lidmar et al. (2003). For different values of these two parameters we encountered ordered, molten, buckled, and collapsing shells. Representative realizations are shown in Figs. 2 and 3.
The degree of fluidity of a shell was monitored using a dynamical method based on plots of the mean square of the particle separations as a function of time , averaged over all pairs of particles that were nearest neighbors in the initial configuration von Grünberg et al. (2004). For the present case, if in the long time limit saturated (on average) to a constant value much smaller than then the shell was assigned to be in a solid state. If, on the other hand, increases linearly in time until it reaches – which is consistent with particle diffusion – then the shell was assigned to be in a fluid state. Finally, when plots of showed a random sequence of alternating time intervals of saturation and linear growth for a given simulation run with drastic variations between different runs then the shell was assigned to be in a fluid-solid coexistence state. Examples of these three cases are shown in Fig. 2 for . In the low-temperature solid state, with , the shell shape is spherical while in the coexistence regime, with , significant shape-fluctuations are visible with characteristic length-scales of the order of the shell radius. The particle array still maintains local positional order but this has largely disappeared for (fluid state).
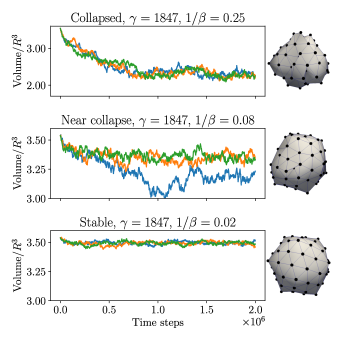
The collapse of shells is a pronounced feature of the phase behavior of shells with larger values of the FvK Number . Collapse was monitored by computing the volume of a continuous and differentiable surface that interpolates between the particle locations, which was constructed using the Loop shell subdivision method Cirak et al. (2000); Feng and Klug (2006). Figure 3 (top) shows an example for of irreversible collapse induced by thermal crumpling, as indicated by a drastic reduction in volume over time and the production of very irregular shell shapes. In Fig. 3 (bottom) this simulation was repeated at a reduced temperature. After a small initial reduction, the shell volume reached a steady state 333Note that shape fluctuations always have to decrease the volume of shells, because the area of shells was kept fixed. The low-temperature shell shape is now icosahedral. In Fig. 3 (middle) simulation were performed near the critical temperature for collapse. In this case shell volumes exhibit large fluctuations, with some shells undergoing a first order-like collapse transition (blue time trace), while other shells remained stable over the simulated time interval.
By collecting simulation runs for different values of the and parameters, the phase plot of Fig. 4 was produced.
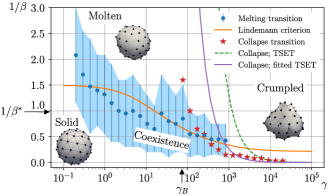
The vertical bars indicate temperature intervals over which fluid-solid coexistence was observed following the criterion discussed above, with the solid blue dots indicating midpoints. The large coexistence interval for small indicates that the melting transition should be first-order on a rigid spherical surface. This is consistent with simulations of flat sheets of particles interacting via Morse potential Lee and Lee (2008) for values of in the relevant range of . The onset of irreversible collapse of shells for increasing temperature is indicated by orange triangles. Shells with collapsed before the particle array could melt. On the other hand, shells with FvK numbers in the range of would melt with increasing temperature before they collapsed.
In order to interpret the phase plot, we compared it with the thin-shell elasticity theory (TSET) Seung and Nelson (1988) in which a curved and stretched layer is assigned a bending and stretching energy given by
| (2) |
Here, is known as the Helfrich bending modulus of the layer, the local mean curvature, and are two-dimensional (2D) Lamé coefficients, while is the strain tensor. The FvK number equals with the corresponding 2D Young’s modulus. For a flat sheet of point particles interacting via the Morse potential, while . In terms of the parameters of the OPS potential, and .
According to TSET, determines the groundstate shape of a thin elastic shell Lidmar et al. (2003) such that for less than a critical value (the “buckling threshold”) that is in the range of , the shell has an approximately spherical shape (such as the spherical shape of Fig. 2 (bottom)) while for above that threshold, the groundstate shape is approximately polyhedral (such as the icosahedral shape of Fig. 3 (bottom)). As indicated in the phase plot, we find a buckling threshold around . The discrepancy between the computed and predicted values of the buckling threshold, which has been noted before Singh et al. (2017), is a first measure of the importance of the discreteness effects. In order to apply TSET to melting, one can combine it with the Lindemann Melting Criterion (LMC), which states that melting occurs when the RMS of the fluctuations of particle displacements exceeds a certain fraction of the equilibrium interparticle spacing . The LMC is known to work well for melting on flat two-dimensional surfaces von Grünberg et al. (2004). In the regime of harmonic fluctuations, the mean square of the in-plane fluctuations and the mean square of the out-of-plane fluctuations can be shown to have the scaling form and , respectively. The scaling functions and are discussed in the Supplemental Materials (Sup, , Section II). Formally, TSET theory corresponds to the limit of particle shells with large and small but with fixed . In order to include discreteness effects, we expanded the three displacement fields in terms of a series of spherical harmonics and demanded that the total number of out-of-plane modes – with the maximum value of the quantum number – equals the number of particles minus two 444The total number of degrees of freedom is , because translation and rotation are prevented. For a shell of particles and are reasonable choices (since 72 is in the interval between and ). The corrected scaling function has the same mathematical form as the TSET case but it is larger by an overall constant scale factor in the range of 10-100, depending on the value of : discreteness thus strongly amplifies the effects of thermal fluctuations. The resulting LMC melting temperatures are plotted in Fig. 4 (orange line) with the melting temperature for treated as a fitting parameter 555For small , the scaling function is proportional to while is constant. The reduction of the melting temperature with increasing is thus dominated by the out-of-plane fluctuations.. The resulting fit is reasonable for the range of , where melting was observed.
According to TSET, elastic shells with large should undergo a collapse transition with increasing temperature Paulose et al. (2012); Košmrlj and Nelson (2017); Baumgarten and Kierfeld (2018). Physically, this is due to the fact that crumpled shells have a much larger configurational space for shape fluctuations than (nearly) spherical shells. So their entropy is much larger as well, while the volume of a crumpled shell with fixed area is correspondingly reduced. For larger , the enthalpic cost of crumpling the surface is diminished so a crumpling/collapse transition is to be expected. The collapse of a shell requires overcoming a free energy barrier that according to TSET vanishes when is about (green dashed line in Fig. 4 Košmrlj and Nelson (2017); Baumgarten and Kierfeld (2018)). For the crumpling/collapse transition that we observed (red stars), solid shells (but not liquid shells) roughly obeyed this scaling relation except that the value of had to be decreased by a factor of about (purple line in Fig. 4). We interpret this as a discreteness effect similar to the one encountered for the melting transition. In the range of the fitted thin-shell elasticity theory (purple line) provides a reasonable estimate for the collapse transition. Small discrepancies with the molecular dynamics simulation (red stars) are attributed to thermally activated escape events over the energy barrier Baumgarten and Kierfeld (2018). This is reflected in the middle panel of Fig. 3, where shell volumes exhibit large fluctuations, with some shells undergoing a first order-like collapse transition (blue time trace), while other shells remained stable over the simulated time interval. In the range of there is a much larger discrepancy between the thin-shell elasticity and molecular dynamics simulations. For these values of the collapse transition is in the same range as the melting transition. The unbound dislocation pairs that are forming during melting may significantly affect the collapse transition and this effect is not captured in the TSET.
As an example how the phase plot Fig. 4 could be applied to viral capsids, we compared the =72 OPS with what is known about the phase properties of viral capsids having 72 capsomers. It should be noted that our phase plot corresponds to empty viral capsids, while the effect of osmotic pressure due to the packaged DNA would increase both the melting and collapse temperatures due to the suppression of radial fluctuations as discussed in Košmrlj and Nelson (2017). In the Caspar-Klug classification of capsids, icosahedral shells with 72 capsomers are known as “T=7” structures Caspar and Klug (1962). Medically important T=7 viruses are the human polyoma and papilloma un-envelopeded double-stranded DNA viruses, which both have a diameter of about 50 nm Belnap et al. (1996). Because the polyoma and papilloma capsids are quite spherical, the value of should, for these two cases, lie below the buckling threshold in Fig. 4. In contrast, two forms of the capsid of the T=7 thermostable DNA bacteriophage P23-45 with diameters of 66 and 82 nm are, respectively, weakly and strongly polyhedral Bayfield et al. (2019). This progression of T=7 shapes straddling the buckling threshold could be understood within TSET by noting that scales as the square of the shell diameter. According to Fig. 4, in the relevant regime of Ceres and Zlotnick (2002a); Katen and Zlotnick (2009), capsids should be rather unstable in this part of the phase plot: prone both to melting and collapse. In actuality these viruses are known to be quite stable but this is because of a post-assembly maturation process, during which the capsid subunits are linked together by covalent bonds. The initial procapsids of the T=7 viruses, which are not yet bonded together, still could be thermodynamically unstable. Interestingly, the assembly of the procapsids of phages typically takes place on a preformed spherical scaffold that is disassembled during maturation Bayfield et al. (2019). It is very suggestive that one purpose of the scaffold is to prevent this instability. This could be checked experimentally by a study of the thermodynamic stability of self-assembling mutant T=7 empty shells for which maturation and/or scaffold formation is blocked. Instability of the procapsid of the related, but much larger, T=13 Herpes-Simplex virus, should be even more pronounced.
Acknowledgements.
Acknowledgements: We would like to thank Luigi Perotti, Jeff Eldredge and Bill Gelbart for useful discussions and the UCLA Mechanical and Aerospace Engineering Department for continued support. This work was supported by NSF through DMR Grants No. 1610384 and 1836404, and the CAREER award DMR-1752100.References
- Alberts (2017) B. Alberts, Molecular biology of the cell (Garland science, 2017).
- Baker et al. (1999) T. S. Baker, N. H. Olson, and S. D. Fuller, Adding the third dimension to virus life cycles: Three-dimensional reconstruction of icosahedral viruses from cryo-electron micrographs, Microbiol. Mol. Biol. Rev. 63, 862 (1999).
- Sleytr et al. (2014) U. B. Sleytr, B. Schuster, E.-M. Egelseer, and D. Pum, S-layers: principles and applications, FEM Micorbol. Rev. 38, 823 (2014).
- Caspar and Klug (1962) D. L. Caspar and A. Klug, Physical principles in the construction of regular viruses, in Cold Spring Harbor symposia on quantitative biology, Vol. 27 (Cold Spring Harbor Laboratory Press, 1962) pp. 1–24.
- Ceres and Zlotnick (2002a) P. Ceres and A. Zlotnick, Weak Protein-Protein Interactions Are Sufficient to Drive Assembly of Hepatitis B Virus Capsids, Biochemistry 41, 11525 (2002a).
- Katen and Zlotnick (2009) S. Katen and A. Zlotnick, The thermodynamics of virus capsid assembly, Methods Enzymol. 455, 395 (2009).
- Nguyen et al. (2009) H. D. Nguyen, V. S. Reddy, and C. L. Brooks III, Invariant polymorphism in virus capsid assembly, J. Am. Chem. Soc. 131, 2606 (2009).
- Note (1) This is due to kinetic trapping. For lower protein concentrations, the probability of kinetic trapping is reduced and interaction energies can be higher. Dykeman et al. (2014).
- Bothner et al. (1999) B. Bothner, A. Schneemann, D. Marshall, V. Reddy, J. E. Johnson, and G. Siuzdak, Crystallographically identical virus capsids display different properties in solution, Nat. Struct. Mol. Biol. 6, 114 (1999).
- Speir et al. (2006) J. A. Speir, B. Bothner, C. Qu, D. A. Willits, M. J. Young, and J. E. Johnson, Enhanced local symmetry interactions globally stabilize a mutant virus capsid that maintains infectivity and capsid dynamics, J. Virol. 80, 3582 (2006).
- Battisti (2011) A. J. Battisti, Structural studies of pleomorphic viruses, Ph.D. thesis, Purdue University (2011).
- Note (2) The Archaeal and Bunyaviridae families of viruses (which includes the Hanta viruses) Prangishvili et al. (2006); Överby et al. (2008); Pietilä et al. (2010) are important examples. The Gaussian curvature of some of the Archaeal pleomorphs evolves over time Prangishvili et al. (2006), indicating that they are in a fluid-like state Perotti et al. (2016); Vitelli et al. (2006).
- Freddolino et al. (2006) P. L. Freddolino, A. S. Arkhipov, S. B. Larson, A. McPherson, and K. Schulten, Molecular dynamics simulations of the complete satellite tobacco mosaic virus, Structure 14, 437 (2006).
- Nelson and Peliti (1987) D. Nelson and L. Peliti, Fluctuations in membranes with crystalline and hexatic order, J. Phys. (Paris) 48, 1085 (1987).
- Szeliski and Tonnesen (1992) R. Szeliski and D. Tonnesen, Surface modeling with oriented particle systems, Vol. 26 (ACM, 1992).
- Liu et al. (2003) H. Liu, C. Qu, J. E. Johnson, and D. A. Case, Pseudo-atomic models of swollen CCMV from cryo-electron microscopy data, J. Struct. Biol. 142, 356 (2003).
- Lee and Lee (2008) S. I. Lee and S. J. Lee, Effect of the range of the potential on two-dimensional melting, Phys. Rev. E 78, 041504 (2008).
- Johnson and Speir (1997) J. E. Johnson and J. A. Speir, Quasi-equivalent viruses: a paradigm for protein assemblies, J. Mol. Biol 269, 665 (1997).
- Ceres and Zlotnick (2002b) P. Ceres and A. Zlotnick, Weak Protein-Protein Interactions Are Sufficient To Drive Assembly of Hepatitis B Virus Capsids, Biochemistry 41, 11525 (2002b).
- Zlotnick (2003) A. Zlotnick, Are weak protein–protein interactions the general rule in capsid assembly?, Virology 315, 269 (2003).
- Nguyen et al. (2005) T. T. Nguyen, R. F. Bruinsma, and W. M. Gelbart, Elasticity theory and shape transitions of viral shells, Phys. Rev. E 72, 051923 (2005).
- Roos et al. (2010) W. H. Roos, R. Bruinsma, and G. J. L. Wuite, Physical Virology, Nat. Phys. 6, 733 (2010).
- Morozov et al. (2009) A. Y. Morozov, R. F. Bruinsma, and J. Rudnick, Assembly of viruses and the pseudo-law of mass action, J. Chem. Phys. 131, 155101 (2009).
- (24) See supplemental material at [URL will be inserted by publisher].
- Lidmar et al. (2003) J. Lidmar, L. Mirny, and D. R. Nelson, Virus shapes and buckling transitions in spherical shells, Phys. Rev. E 68, 051910 (2003).
- von Grünberg et al. (2004) H.-H. von Grünberg, P. Keim, K. Zahn, and G. Maret, Elastic behavior of a two-dimensional crystal near melting, Phys. Rev. Lett. 93, 255703 (2004).
- Cirak et al. (2000) F. Cirak, M. Ortiz, and P. Schröder, Subdivision surfaces: a new paradigm for thin-shell finite-element analysis, Int. J. Numer. Meth. Eng. 47, 2039 (2000).
- Feng and Klug (2006) F. Feng and W. S. Klug, Finite element modeling of lipid bilayer membranes, J. Comput. Phys. 220, 394 (2006).
- Note (3) Note that shape fluctuations always have to decrease the volume of shells, because the area of shells was kept fixed.
- Seung and Nelson (1988) H. S. Seung and D. R. Nelson, Defects in flexible membranes with crystalline order, Phys. Rev. A 38, 1005 (1988).
- Singh et al. (2017) A. R. Singh, L. E. Perotti, R. F. Bruinsma, J. Rudnick, and W. S. Klug, Ground state instabilities of protein shells are eliminated by buckling, Soft matter 13, 8300 (2017).
- Note (4) The total number of degrees of freedom is , because translation and rotation are prevented.
- Note (5) For small , the scaling function is proportional to while is constant. The reduction of the melting temperature with increasing is thus dominated by the out-of-plane fluctuations.
- Paulose et al. (2012) J. Paulose, G. A. Vliegenthart, G. Gompper, and D. R. Nelson, Fluctuating shells under pressure, Proc. Natl. Acad. Sci. U.S.A. 109, 19551 (2012).
- Košmrlj and Nelson (2017) A. Košmrlj and D. R. Nelson, Statistical mechanics of thin spherical shells, Phys. Rev. X 7, 011002 (2017).
- Baumgarten and Kierfeld (2018) L. Baumgarten and J. Kierfeld, Buckling of thermally fluctuating spherical shells: Parameter renormalization and thermally activated barrier crossing, Phys. Rev. E 97, 052801 (2018).
- Belnap et al. (1996) D. M. Belnap, N. H. Olson, N. M. Cladel, W. W. Newcomb, J. C. Brown, J. W. Kreider, N. D. Christensen, and T. S. Baker, Conserved features in papillomavirus and polyomavirus capsids, J. Mol. Biol 259, 249 (1996).
- Bayfield et al. (2019) O. W. Bayfield, E. Klimuk, D. C. Winkler, E. L. Hesketh, M. Chechik, N. Cheng, E. C. Dykeman, L. Minakhin, N. A. Ranson, K. Severinov, et al., Cryo-em structure and in vitro dna packaging of a thermophilic virus with supersized t= 7 capsids, Proc. Natl. Acad. Sci. U.S.A. 116, 3556 (2019).
- Dykeman et al. (2014) E. C. Dykeman, P. G. Stockley, and R. Twarock, Solving a levinthal’s paradox for virus assembly identifies a unique antiviral strategy, Proc. Natl. Acad. Sci. U.S.A. 111, 5361 (2014), https://www.pnas.org/content/111/14/5361.full.pdf .
- Prangishvili et al. (2006) D. Prangishvili, P. Forterre, and R. Garrett, Viruses of the Archaea: a unifying view., Nat. Rev. Microbiol. 4, 837 (2006).
- Överby et al. (2008) A. K. Överby, R. Pettersson, K. Grünewald, and J. Huiskonen, Insights into bunyavirus architecture from electron cryotomography of Uukuniemi virus, Proc. Natl. Acad. Sci. U.S.A. 105, 2375 (2008).
- Pietilä et al. (2010) M. K. Pietilä, S. Laurinavičius, J. Sund, E. Roine, and D. H. Bamford, The single-stranded DNA genome of novel archaeal virus Halorubrum pleomorphic virus 1 is enclosed in the envelope decorated with glycoprotein spikes, J. Virol. 84, 788 (2010).
- Perotti et al. (2016) L. E. Perotti, S. Dharmavaram, W. S. Klug, J. Marian, J. Rudnick, and R. F. Bruinsma, Useful scars: Physics of the capsids of archaeal viruses, Phys. Rev. E 94, 012404 (2016).
- Vitelli et al. (2006) V. Vitelli, J. Lucks, and D. Nelson, Crystallography on curved surfaces, Proc. Natl. Acad. Sci. U.S.A. 103, 12323 (2006).