11email: quiroganunez@strw.leidenuniv.nl 22institutetext: Joint Institute for VLBI ERIC (JIVE), Oude Hoogeveensedijk 4, 7991 PD Dwingeloo, The Netherlands 33institutetext: International Centre for Radio Astronomy Research – Curtin University, GPO Box U1987, Perth, WA 6845, Australia 44institutetext: ASTRON, Netherlands Institute for Radio Astronomy, Oude Hoogeveensedijk 4, 7991 PD, Dwingeloo, The Netherlands 55institutetext: National Radio Astronomy Observatory, 520 Edgemont Rd., Charlottesville, VA 22903, USA 66institutetext: National Radio Astronomy Observatory, 1003 Lopezville Road, Socorro, NM 87801-0387, USA
Differences in radio emission from similar M dwarfs
in the binary system Ross 867-8
Serendipitously, we rediscovered radio emission from the binary system Ross 867 (M4.5V) and Ross 868 (M3.5V) while inspecting archival Giant Metrewave Radio Telescope (GMRT) observations. The binary system consists of two M-dwarf stars that share common characteristics such as spectral type, astrometric parameters, age, and emission at infrared, optical, and X-ray frequencies. The GMRT data at 610 MHz taken on July 2011 shows that the radio emission from Ross 867 is polarized and highly variable on hour timescales with a peak flux of 10.4 0.7 mJy/beam. Additionally, after reviewing archival data from several observatories (VLA, GMRT, JVLA, and LOFAR), we confirm that although the two stars are likely coeval, only Ross 867 was detected, while Ross 868 remains undetected at radio wavelengths. As the stars have a large orbital separation, this binary stellar system provides a coeval laboratory to examine and constrain the stellar properties linked to radio activity in M dwarfs. We speculate that the observed difference in radio activity between the dwarfs could be due to vastly different magnetic field topologies or that Ross 867 has an intrinsically different dynamo.
Key Words.:
stars: flare – stars: binaries: general – Radiation mechanisms: non-thermal – Radio continuum: stars – stars: individual: Ross 867 – stars: individual: Ross 8681 Introduction
The most common stellar type is an M dwarf (Henry et al. 2006), and understanding eruptive events in these stars (e.g., stellar flares and stellar coronal mass ejections) is a fundamental astrophysical subject, in particular, for assessing the habitability of orbiting exoplanets (Crosley & Osten 2018) that have already been detected (Dressing & Charbonneau 2013). It is known that these stars show dynamic activity in their stellar atmospheres, especially for mid- to late-M dwarfs (e.g., West et al. 2008). This effect has usually been attributed to magnetic energy release in the outer atmosphere that accelerates particles and gives rise to chromospheric and coronal heating, producing photons at all wavelengths (Bochanski et al. 2007). In particular, at radio wavelengths the flux intensity changes are not well understood, and although the physical mechanisms that produce this radio variability have been studied in the Sun (e.g., Shibata & Magara 2011), recent studies show that radio flares coming from M dwarfs do not have a clear solar analog (see, e.g., Villadsen & Hallinan 2019, and the references within). In order to establish the physical mechanisms occurring in M dwarfs that could lead to radio intensity changes, previous investigations have analyzed a wide range of stellar properties (White et al. 1989; Berger 2002; Wright et al. 2011; Houdebine & Mullan 2015; Houdebine et al. 2017; Newton et al. 2017; Yang et al. 2017). Factors such as the stellar spectral type, the Rossby number, and ages of dwarf stars may be related to the magnetic activity and therefore dynamic radio activity (West et al. 2008; López-Santiago et al. 2010; McLean et al. 2012; West et al. 2015; Barnes et al. 2017; Ilin et al. 2019).
| Ross 867 | Ross 868 | |
| Spectral Type\tmark[(1)] | M4.5V | M3.5V |
| Mass\tmark[(2)] () | 0.311 0.132 | 0.376 0.040 |
| Parallax\tmark[(3)] (mas) | ||
| Distance\tmark[(3,14)] (pc) | ||
| Radius () | [0.27-0.51]\tmark[(9,7)] | [0.478-0.535]\tmark[(6,4)] |
| \tmark[(3)] | ||
| \tmark[(3)] | ||
| Age\tmark[(12)] (Myr) | [90-300] | [25-300] |
| (K) | 2667\tmark[(2)] | 3319 100\tmark[(6)] |
| [6.79-10]\tmark[(5,8)] | [1.0-28.5]\tmark[(4,6,7,10,11,12,13)] | |
| B\tmark[(1)] (mag) | 14.67 | 12.98 |
| R\tmark[(1)] (mag) | ||
| G\tmark[(1)] (mag) | ||
| J\tmark[(1)] (mag) | ||
| H\tmark[(1)] (mag) | ||
| K\tmark[(1)] (mag) | ||
| XMM\tmark[(13)] [0.2-12keV] | ||
| Chandra\tmark[(13)] [0.3-11keV] | ||
Notes. When several measurements differ, a range in square brackets is given. References. (1) The SIMBAD astronomical database (Wenger et al. 2000). (2) Jenkins et al. (2009). (3) Gaia-Collaboration et al. (2018). (4) Houdebine (2012). (5) Jeffers et al. (2018). (6) Houdebine et al. (2016). (7) Caillault & Patterson (1990). (8) McLean et al. (2012). (9) White et al. (1989). (10) Moutou et al. (2017). (11) Reiners et al. (2012). (12) Shkolnik et al. (2012). (12) Kiraga & Stepień (2007). (13) This work. (14) Assuming geometrical distance calculation from parallax made by Bailer-Jones et al. (2018).
In this paper we present a serendipitous flare detection of the variable radio source Ross 867 (also known as V639 Her or Gliese 669B) based on archival observations from the Giant Metrewave Radio Telescope (GMRT; Swarup 1991) that targeted the galaxy cluster RXJ1720.1+2638 (Giacintucci et al. 2014; Savini et al. 2019). Although Ross 867 had already been marked as radio loud by Jackson et al. (1987), there was no evidence of variability or circular polarized emission reported. Ross 867 is part of a binary system with Ross 868 (also known as V647 Her, Gliese 669A or HIP 84794); they are separated by 179.3 0.1 AU (or 16.854 0.001′′) in projection, and both stars have been classified as optical flaring stars (Samus et al. 2004; Nakajima et al. 2010). Using their stellar position together with recent parallax measurements in Gaia DR2 (Gaia-Collaboration et al. 2018), we confirm that the two sources are close enough to be gravitationally bound, but separate enough to discard any stellar material transfer or significant tidal interaction. What is remarkable about this binary system is that although the stars are similar in terms of spectral type, age, and high 3D motion, as well as IR, optical (the same thermal emission processes can be assumed), and X-ray emission (see Table 1), only Ross 867 seems to be radio loud. Hence, this binary stellar system provides a coeval laboratory to examine and constrain the stellar properties present in radio-loud flare stars, and hence to discuss the physical mechanisms behind the radio flare emission in M dwarfs. In order to study this binary system in more detail, we initiated a search for other historical radio data identifying several radio continuum observations in the archives of the GMRT, the Very Large Array (VLA; Thompson et al. 1980), and the Low Frequency Array (LOFAR; van Haarlem et al. 2013) observed at different epochs and different radio frequencies. In this paper we present an analysis of this set of observations, confirming that Ross 867 is indeed a source of time-variable, bright radio emission, whereas Ross 868 remains undetected.
2 Observations
The GMRT observed the galaxy cluster RXJ1720.1+2638 four times at various frequencies, one of which is a dual-frequency observation (project codes 11MOA01 and 20_016; see Tables 2 and 4 for details). In three observations the star Ross 867 was located within the field of view. GMRT observations amounted to integrations of four to six hours, consisting predominantly of blocks of 30 minutes on RXJ1720.1+2638 interleaved with phase calibrator observations of several minutes (see details in Table 2). All but the dual-frequency observation recorded instrumental RR and LL visibilities, while the dual-frequency observations recorded RR visibilities only at 610 MHz, and LL visibilities only at 235 MHz. Full polarization calibration was not possible for any of these data sets. However, under the general assumptions that the circular feeds are mostly orthogonal with around leakage per antenna (Joshi & Chengalur 2010; Roy et al. 2010) and that the sources are not linearly polarized at these low frequencies (Faraday rotation would wipe out the linearly polarized light given the density of the plasma, Dulk 1985; White & Franciosini 1995), RR and LL visibilities can be converted into Stokes I and V visibilities. For the dual-frequency observations, the individual RR and LL visibilities are approximately equal to Stokes I visibilities, assuming that the radio sky emission is predominantly circularly unpolarized (which is generally the case except for gyro-synchrotron emitters such as planets, stars, and the Galactic center) and that the instrumental polarization over the relevant part of the field of view is negligible (Wielebinski 2012; Farnes 2014).
| Date (yyyy-mm-dd) | Frequency | Blocks time | Observational | Correlation | \tmark[(1)] | \tmark[(2)] | Ref \tmark[(3)] | |
|---|---|---|---|---|---|---|---|---|
| and UTC range | (MHz) | per block (min) | time (min) | parameters | (arcsec) | (arcsec) | (mJy) | (mJy) |
| 2007-03-08 | 325 | 7.5 37 | 275 | I | ||||
| 23:28-06:11(+1) | LL | |||||||
| RR | ||||||||
| 2007-03-10 | 610 | 12 26 | 313 | I | ||||
| 23:17-06:09(+1) | LL | |||||||
| RR | ||||||||
| 2011-07-24 | 235 | 11 31 | 346 | LL | ||||
| 13:30-21:25 | 610 | RR |
Notes. (1) Source position and uncertainty of right ascension () and declination () measured from 17h19m00s and +26∘30′00′′ in sexagesimal notation. (2) Source flux density and uncertainty. (3) Reference flux density and uncertainty of neighboring source NVSS J171949+263007.
We used the SPAM pipeline (Intema et al. 2017) to process the archival GMRT observations (see Appendix A for a concise description) and generated calibrated Stokes I visibilities and images for all observations. Additionally, to look for evidence of circular polarization in observations with both RR and LL present, we split off each polarization and processed them independently using the same pipeline. The resulting sensitivities and resolutions of the wide-field images generated by the pipeline are listed in Table 4.
The source extraction software PyBDSF (Mohan & Rafferty 2015) was used to measure the position and flux density of all detectable sources in the primary-beam-corrected images. The measured positions and flux densities of Ross 867 are given in Table 2. The flux density calibration procedure for GMRT is typically accurate to about 10 % (e.g., Chandra et al. 2004), so a systematic 10 % error is added (in quadrature) to all the random flux uncertainties as reported by PyBDSF (and to all GMRT flux measurements in the remainder of the article). Table 2 also contains the flux densities of the bright neighboring extragalactic source NVSS J171949+263007 (0.8′ west of Ross 867), which we use as a reference source. The reported 1.4 GHz flux densities of this source in the NVSS and FIRST surveys are and mJy, respectively (see Table 3 for details). Given the difference in resolution and observing epochs, this indicates that the reference source is compact and not variable on short timescales (months to years). The position of the reference source is measured to be 17h19m49.31s +26∘30′07.7′′ in all GMRT images within 0.1′′ accuracy.
3 Results
3.1 Change in flux and position of Ross 867
By comparing two separate observations at 610 MHz from 2007 and 2011, we discovered that one of the radio sources shifted its position and changed its flux density between the epochs. After aligning the observations using the close-by quasar NVSS J171949+263007 (at 0.8′) as astrometric reference source, we found that the variable radio emission unambiguously coincided with the sky position of Ross 867 in both observations. The radio properties obtained for Ross 867 and NVSS J171949+263007 are described in Table 2, which reveals several important properties.
First, there is a noticeable shift in the position of Ross 867 between March 2007 and July 2011, which is much larger than the expected parallax shift expected (0.1′′) for this stellar source. When using the 610 MHz positions (highest resolution) in the LL images (the only polarization available at both epochs), the shift is ′′ in right ascension and 1.2′′ in declination over 4.37 yr, which translates to a proper motion of for right ascension and declination, respectively. These values differ by nearly two sigma with respect to the recently estimated values by Gaia DR2 (Table 1). The discrepancy is likely due to the astrometric measurement uncertainties caused by the limited resolution and signal-to-noise ratio in GMRT.
Second, there is a significant increase in the flux density of Ross 867 at 610 MHz between March 2007 and July 2011. The flux ratio lies in the range of 3–10 taking into account the flux uncertainties and the Stokes measurement selected. The change in flux density over time of the quasar reference source (NVSS J171949+263007) is negligible and lies within the uncertainties.
Third, there is a significant difference in the flux density of Ross 867 between the correlation parameters RR and LL for the cases where both visibilities were recorded, namely at 325 and 610 MHz in March 2007. At both frequencies the flux density in LL is times higher than in RR (see Table 2). Whereas for the quasar reference source (NVSS J171949+263007) the difference between the RR and LL is consistent with unpolarized emission. This observational evidence demonstrates unambiguously that time-variable emission, likely circularly polarized radio emission, is originating from Ross 867.
3.2 Radio light curves
Since the GMRT observations are integrations of several hours, consisting of blocks of 0.5 hours, this allowed us to look for radio variability of Ross 867 on timescales of minutes to hours, by reimaging time slices of the calibrated and flagged visibility data as generated by the pipeline. As we are only interested in Ross 867 and the reference source NVSS J171949+263007, we pre-subtracted all radio source flux outside a 2′ radius circle centered on Ross 867 from the full visibility data set. When splitting an observation into time slices of equal duration, the theoretical sensitivity in a single time slice image is worse by a factor of compared to the full time range. We used this scaling to determine the minimum size of each time slice and the depth to which we deconvolve (CLEAN) the time slice image.
After making a time series of images per data set, we measured the flux density of Ross 867 and NVSS J171949+263007 by integrating over tight apertures (2.5 times the theoretical beam size of each image) around measured peak position for each source. By measuring the flux density in each time slice, we attempted to construct radio light curves of Ross 867 for the available observations. This worked best for the GMRT observations at 610 MHz because of significant signal-to-noise ratio limitations in the other observations. At 610 MHz, the flux measurements on the reference source NVSS J171949+263007 show a mild (10 %) variation over time, which can be attributed to limited image quality per snapshot and to higher-order primary-beam effects, as we explain here. First, our snapshots are very short observations yielding poor UV coverage (due to the Earth’s rotation), which leads to less accurate flux density measurements. Second, instrumental amplitude variations of a few percentage points may be expected as the beam patterns of all antennas in the interferometer cannot be assumed to be the same, especially far from the the pointing center (RXJ1720.1+2638) where Ross 867 and the reference source are located.
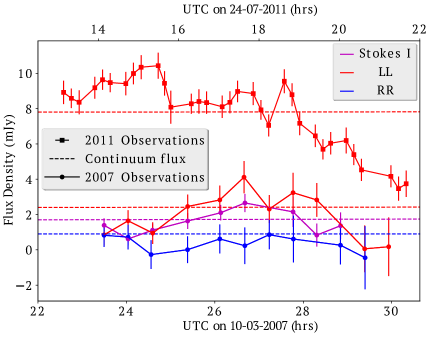
We corrected the snapshot flux density measurements of Ross 867 by multiplying them with the full-to-snapshot flux ratios of the reference source; we make the assumption that its flux density does not change on a timescale of hours. Figure 1 shows the resulting light curves from the two available 610 MHz observations, with a peak flux of 10.4 0.7 mJy/beam in 2011. The time resolution of the 2007 radio light curve is about three times worse than the 2011 radio light curve due to signal-to-noise ratio limitations.
4 Discussion
4.1 Identical stellar origin
The recent Gaia DR2 measurements (Table 1) show that Ross 867 and Ross 868 have equal distance within the errors. Moreover, their relative velocity is and their separation is 179.3 0.1 AU in projection. This large separation allows us to argue that they are not magnetically interacting since the magnetosphere of such stars cannot extend further than approximately five stellar radii (Güdel 2002). Therefore, their flare emissions can arguably be studied as independent events from similar stellar sources. Furthermore, although the age estimates for Ross 867-8 have large margins (Table 1), their similar peculiar 3D motion, spectral type, and orbital separation strongly suggest that both stars are coeval (likely related within the Hyades group; Nakajima et al. 2010; Shkolnik et al. 2012), which establishes another constraint for the flaring-age relation of dwarfs in open clusters (Ilin et al. 2019).
4.2 Nature of the flare emission
Since the GMRT observations obtained in 2011 were only recorded at LL polarization, we cannot establish if the emission from Ross 867 was circularly polarized at that epoch. However, the observations made in 2007 at 325 and 610 MHz with the GMRT indicate that the emission is indeed polarized (see Figure 1). While we lack the cross-polarization terms in our 610 MHz observation, we can argue that stellar emission is likely not linearly polarized (e.g., Villadsen & Hallinan 2019). With this assumption, we infer that the 610 MHz emission from Ross 867 in 2011 is 40 circularly polarized. We also estimate that the brightness temperature of the emission is (assuming that the emission site is the entire photosphere) meaning that it is unlikely to be gyrosynchrotron emission (Melrose & Dulk 1982; Dulk 1985). Therefore, the emission coming from Ross 867 is likely caused by a coherent process, either electron cyclotron maser instability or plasma emission. Furthermore, the emission detected in 2011 at 610 MHz shows that the flare emission lasted for at least seven hours, which is longer than usual for flares of this type (Lynch et al. 2017), but still consistent with timescales for coherent emission from M dwarfs (Slee et al. 2003; Villadsen & Hallinan 2019). It is possible that Ross 867 is already a fully convective star, explaining the polarized flare emission detected, whereas Ross 868 would still have a radiative core. However, we note that non-fully convective stars (e.g., the Sun) can also produce strongly polarized emission from plasma emission (Bastian et al. 1998).
4.3 Historical radio observations
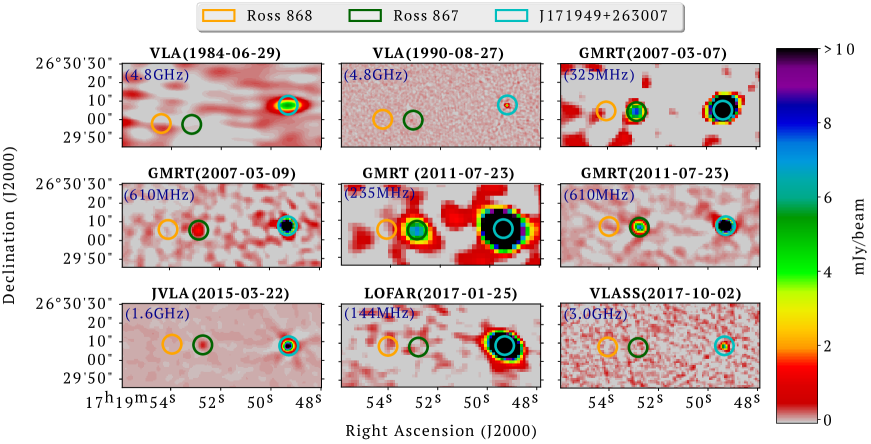
We have extensively reviewed archival data from several radio observatories for the field of view that contains Ross 867-8. Table 4 displays technical information for each data set inspected, and Figure 2 shows the field of view from different radio observatories at several epochs and frequencies, where the expected positions at each observational time for Ross 867 and Ross 868 (assuming the proper motion measured by Gaia DR2) are highlighted. Since Ross 868 was undetected in all observations, here we only discuss the Ross 867 detection.
A candidate radio detection of Ross 867 with Arecibo at 430 MHz (10′ resolution) was first reported by Spangler (1976), but given the high flux density reported ( mJy) and the vicinity of a bright extragalactic radio source (NVSS J171949+263007) at a distance of ′ from Ross 867 as seen in higher resolution observations, this is likely an incorrect association. About a decade later, the same region was observed with the VLA four times in 1984 and 1986. Ross 867 was not detected in the observation made in 1984, likely related to dynamic range limitations. Then, for the observations made in February and July of 1986, White et al. (1989) reported that Ross 867 was marginally detected (0.69 and 0.71 mJy at C and L band, respectively) only in the first observation. For the observations made in August 1986, Jackson et al. (1987) established that Ross 867 is a radio-loud source at 1.4 and 4.8 GHz. They report Stokes I flux densities of and mJy, respectively. In all observations made in 1986, no significant circularly polarized emission (Stokes V) or time-variability of the radio emission was detected. More recently, two observations using JVLA and LOFAR were made in 2015 and 2017 at 1.6 and 0.14 GHz, respectively. Although the JVLA observed a flux density emission of mJy from Ross 867, there was no significant detection of circularly polarized emission. Ross 867 was not detected in the LOFAR observation (part of the LOFAR Two-metre Sky Survey, LoTSS; Shimwell et al. 2017a) at 144 MHz, which could be caused by local dynamic range limitations in the presence of the bright radio source (NVSS J171949+263007) that was used as the reference source in this study (Figure 2). Additional details of the LOFAR observation are presented in Appendix B. Finally, preliminary results from the The Karl G. Jansky Very Large Array Sky Survey (VLASS111https://science.nrao.edu/science/surveys/vlass; Lacy et al. 2019) show that there was no detection of either dwarfs in Ross 867-8 at S band for the observations made in 2017, likely associated with low effective integration time (5 seconds).
4.4 Probability of observing during a non-flaring event
Given our time sampling, it might be thought that we only detected Ross 867 by chance, even though Ross 868 was radio active too. To assess the possibility that in 11 radio observations made at different times (Table 4) we observed Ross 868 during non-flaring states, we assume that flare events follow a Poisson distribution (Gehrels 1986; Pettersen 1989) and Ross 868 has similar flaring properties (e.g., rates, flux density) to those of Ross 867. Under this assumption, we find that the probability of detecting Ross 868 at least once in those 11 observations should be . Therefore, since we do not detect Ross 868, it is unlikely that Ross 868 is as radio active as Ross 867.
4.5 Comparison of stellar properties with respect to a similar binary system
The stellar system formed by BL Ceti (also known as Luyten 726-8 A or GJ 65A) and UV Ceti (also known as Luyten 726-8 B or GJ 65B) is one of the most studied dwarf binary systems with flare emissions, where the two stars are similar, and one of the stars is radio loud while the companion remains radio undetectable for some observations. The physical processes behind the flare emission are found to be different for each star, as flares in BL Ceti seem to be radio loud and highly circularly polarized, implying coherent emission mechanisms, whereas UV Cet shows polarized gyrosynchrotron flares and periodic coherent bursts (Benz et al. 1998; Bingham et al. 2001; Villadsen & Hallinan 2019; Zic et al. 2019). However, if we compare BL-UV Ceti with Ross 867-8, the latter presents several particular characteristics, which we highlight below.
First, the substantial X-ray emission difference between BL Ceti and UV Ceti has been taken as one of the factors that could be related to the different radio emission due to chromospheric activity (see, e.g., Audard et al. 2003). Given this, we have recalculated the X-ray emission for Ross 867 and Ross 868 from XMM Newton and Chandra observations (see Table 1). It has been found that the dwarfs in Ross 867-8 are equally bright in X-rays, and therefore it is unlikely that there is a one-to-one relation between X-ray and radio activity for the two stellar components.
Second, since the binary system BL-UV Ceti is closer to the Sun than Ross 867-8, it offers higher angular resolution observations. However, although their orbital separation of 5AU is too large for a shared magnetosphere, stellar wind interactions are possible, and hence there has been a tentative claim of sympathetic flaring (Panagi & Andrews 1995). In contrast, since Ross 867-8 has a separation that is 100 times greater than that of the binary system BL-UV Ceti, any energy flux between the two stars due to stellar wind or other magnetic processes is reduced by a factor of , making it highly unlikely that binary magnetic interaction causes detectable effects in the stellar activity.
Third, Berger (2002) has studied the flaring radio activity in rotating M and L stars, concluding that the rotation is crucial in determining the physical process behind the flare emission. In this sense, Audard et al. (2003) first suggested that for BL-UV the stellar rotation could play an important role, as BL Ceti (referred as UV Ceti A) is a rapid rotator ( ), while the companion lacked rotation measurements at that time. However, Barnes et al. (2017) have recently measured rotation periods for the BL-UV Ceti binary system finding that both stars are rapid rotators with similar values (i.e., and ). For Ross 867-8, discrepancies in the rotation period measurements have also been reported. For Ross 868, Kiraga & Stepień (2007) reported a rotation period of 0.950 days ( ) based on photometric observations, which was debated by Houdebine & Mullan (2015) who obtained using a cross-correlation technique for a selected narrow spectral range. This same technique was also used by López-Santiago et al. (2010) and Houdebine et al. (2017) obtaining 1.0 and , respectively. Moreover, using high-resolution spectra, Reiners et al. (2012) reported , which was later measured by Moutou et al. (2017), who reported .
For Ross 867, an upper limit of was established by Jenkins et al. (2009), which was later refined by Jeffers et al. (2018) to . If we do not consider the rotation velocity measured by Kiraga & Stepień (2007), Ross 867 and Ross 868 can both be categorized as slow rotators (different to what has been found for BL Ceti); however, we cannot confirm this similarity between the dwarfs given the different values reported, and the unknown inclination angles () that affect the rotation velocity estimates. Additional high-resolution spectra of Ross 867-8 are necessary to confirm this hypothesis.
Fourth, another speculation suggested for the changes observed in radio activity in M-dwarf binary systems (such as NLTT33370 and BL-UV Ceti, Williams et al. 2015; Kochukhov & Lavail 2017, respectively) is related to the differences in magnetic morphology. For late M dwarfs (M6), there is evidence that they can have two different types of magnetic field morphology, i.e., a strong global dipole field or a weaker multipolar field (Morin et al. 2010; Gastine et al. 2013). The strong dipole field might play a role in generating radio emission (for modeling and observations, see, e.g., Nichols et al. 2012; Hallinan et al. 2015; Kao et al. 2016; Leto et al. 2016; Kuzmychov et al. 2017; Turnpenney et al. 2017), but this dynamo bistability so far has only been observed for late M dwarfs. Given that the stars in Ross 867-8 are both mid-M dwarfs, they could provide a test of the theory that magnetic morphology indeed causes the differences in the radio emission observed. In this sense, the binary system Ross 867-8 is a potential target for spectropolarimetric observations (Zeeman Doppler Imaging) in order to determine the role of the magnetic morphology in the radio activity observed in the stellar atmosphere of mid-M dwarfs. Moreover, considering the differences in stellar mass between the dwarfs in Ross 867-8, it is possible that Ross 867 has a fully convective core, while the core of Ross 868 is partly radiative and partly convective (see Section 4.2). This situation will drive a different dynamo that could lead to different magnetic field topologies (Browning & K. 2007; Yadav et al. 2016), and therefore, different radio activity (McLean et al. 2012).
5 Summary and conclusions
The radio emission from Ross 867 was serendipitously rediscovered by us while inspecting GMRT data at 8′ from the field center (galaxy cluster RXJ1720.1+2638, Giacintucci et al. 2014; Savini et al. 2019). Comparing two separate observations at 610 MHz from 2007 and 2011, we found that one of the radio sources shifted its position between the epochs by about 2′′, and its flux density changed by a factor of 4. After ruling out any astrometric or flux density calibration errors, we found that the variable radio emission coincided with the sky position of Ross 867 at the times of observation.
We noted that Ross 867 forms part of a binary system with Ross 868. The two stars share the same stellar origin and are identical in terms of spectral type, age, and high 3D motion, and infrared, optical, and X-ray emission. However, after inspecting radio observations of this system, ranging from 1984 to 2017, Ross 868 remains undetected; it was confirmed to be improbable that Ross 868 was not flaring at any observation. In contrast, Ross 867 displays radio variability likely associated with a coherent process given the radio circular polarized emission detected, and the brightness temperature estimated ().
Dwarf binaries with similar companions showing radio flares (where one of the stars is radio loud, while the companion remains radio undetectable) are limited to two known cases: NLTT33370 and BL-UV Ceti (Williams et al. 2015; Kochukhov & Lavail 2017, respectively). Nevertheless, the binary system Ross 867-8 presents a case with closer stellar features between the dwarfs when it is compared to BL-UV Ceti and NLTT33370; the most remarkable difference is their rotational component, which lacks convincing measurements. Moreover, given its large orbital separation ( AU), we can discard any magnetic or tidal interaction that could contaminate the independent physical interpretation of the radio activity present in each dwarf. We conclude that there are two intriguing possibilities for the difference in radio activity like that observed in Ross 867-8, namely a different magnetic field topology or a vastly different dynamo. They are linked to the rotation component that is measured as , so the Rossby number would be a more appropriate parameter given the lack of measurements for the inclination angle () (see, e.g., McLean et al. 2012). Finally, by observing Ross 867-8, there is a unique opportunity to disentangle the stellar properties that are linked to the flare emission at radio wavelengths. Further wide-band and higher angular resolution observations of the binary system Ross 867-8 are already scheduled, and their results are expected to be promising for the radio stellar field.
Acknowledgements.
We sincerely thank the anonymous referee for making valuable suggestions that have improved the paper. In addition, we thank the staff of the GMRT that made these observations possible. GMRT is run by the National Centre for Radio Astrophysics of the Tata Institute of Fundamental Research. LOFAR is the Low Frequency Array designed and constructed by ASTRON. It has observing, data processing, and data storage facilities in several countries, which are owned by various parties (each with their own funding sources), and which are collectively operated by the ILT foundation under a joint scientific policy. The ILT resources have benefitted from the following recent major funding sources: CNRS-INSU, Observatoire de Paris and Université d’Orléans, France; BMBF, MIWF-NRW, MPG, Germany; Science Foundation Ireland (SFI), Department of Business, Enterprise and Innovation (DBEI), Ireland; NWO, The Netherlands; The Science and Technology Facilities Council, UK; Ministry of Science and Higher Education, Poland. This research made use of the Dutch national e-infrastructure with support of the SURF Cooperative (e-infra 180169) and the LOFAR e-infra group. The Jülich LOFAR Long Term Archive and the German LOFAR network are both coordinated and operated by the Jülich Supercomputing Centre (JSC), and computing resources on the Supercomputer JUWELS at JSC were provided by the Gauss Centre for Supercomputing e.V. (grant CHTB00) through the John von Neumann Institute for Computing (NIC). The University of Hertfordshire high-performance computing facility and the LOFAR-UK computing facility located at the University of Hertfordshire and supported by STFC [ST/P000096/1]. This work also has made use of data from the European Space Agency (ESA) mission Gaia222https://www.cosmos.esa.int/gaia, processed by the Gaia Data Processing and Analysis Consortium (DPAC333https://www.cosmos.esa.int/web/gaia/dpac/consortium). Funding for the DPAC has been provided by national institutions, in particular the institutions participating in the Gaia Multilateral Agreement. This research has made use of the SIMBAD database, operated at CDS, Strasbourg, France. L.H.Q.-N. deeply thanks Dr. L.O. Sjouwerman at NRAO Socorro for the support reducing archival VLA observations and Dr. Ken Croswell for his comments and suggestions.References
- Audard et al. (2003) Audard, M., Gudel, M., & Skinner, S. L. 2003, ApJ, 589, 983
- Bailer-Jones et al. (2018) Bailer-Jones, C. A. L., Rybizki, J., Fouesneau, M., Mantelet, G., & Andrae, R. 2018, AJ, 156, 58
- Barnes et al. (2017) Barnes, J. R., Jeffers, S. V., Haswell, C. A., et al. 2017, MNRAS, 471, 811
- Bastian et al. (1998) Bastian, T. S., Benz, A. O., & Gary, D. E. 1998, ARA&A, 36, 131
- Benz et al. (1998) Benz, A. O., Conway, J., & Güdel, M. 1998, A&A, 331, 596
- Berger (2002) Berger, E. 2002, ApJ, 572, 503
- Bingham et al. (2001) Bingham, R., Cairns, R. A., & Kellett, B. J. 2001, A&A, 370, 1000
- Bochanski et al. (2007) Bochanski, J. J., West, A. A., Hawley, S. L., & Covey, K. R. 2007, AJ, 133, 531
- Browning & K. (2007) Browning, M. & K., M. 2007, ApJ, 676, 1262
- Caillault & Patterson (1990) Caillault, J.-P. & Patterson, J. 1990, AJ, 100, 825
- Chandra et al. (2004) Chandra, P., Ray, A., & Bhatnagar, S. 2004, ApJ, 612, 974
- Condon et al. (1998) Condon, J. J., Cotton, W. D., Greisen, E. W., et al. 1998, AJ, 115, 1693
- Crosley & Osten (2018) Crosley, M. K. & Osten, R. A. 2018, ApJ, 856, 39
- De Gasperin et al. (2019) De Gasperin, F., Dijkema, T. J., Drabent, A., et al. 2019, Systematic effects in LOFAR data: A unified calibration strategy
- Dressing & Charbonneau (2013) Dressing, C. D. & Charbonneau, D. 2013, ApJ, 767, 95
- Dulk (1985) Dulk, G. 1985, ARA&A, 23, 169
- Farnes (2014) Farnes, J. S. 2014, NCRA Tech. Rep., 2
- Gaia-Collaboration et al. (2018) Gaia-Collaboration, Brown, A. G. A., Vallenari, A., et al. 2018, A&A, 616, A1
- Gastine et al. (2013) Gastine, T., Morin, J., Duarte, L., et al. 2013, A&A, 549, L5
- Gehrels (1986) Gehrels, N. 1986, ApJ, 303, 336
- Giacintucci et al. (2014) Giacintucci, S., Markevitch, M., Brunetti, G., et al. 2014, ApJ, 795, 73
- Güdel (2002) Güdel, M. 2002, ARA&A, 40, 217
- Hallinan et al. (2015) Hallinan, G., Littlefair, S. P., Cotter, G., et al. 2015, Nature, 523, 568
- Henry et al. (2006) Henry, T. J., Jao, W., Subasavage, J. P., et al. 2006, AJ, 132, 2360
- Houdebine (2012) Houdebine, E. R. 2012, MNRAS, 421, 3180
- Houdebine & Mullan (2015) Houdebine, E. R. & Mullan, D. J. 2015, ApJ, 801
- Houdebine et al. (2017) Houdebine, E. R., Mullan, D. J., Bercu, B., Paletou, F., & Gebran, M. 2017, ApJ, 837, 96
- Houdebine et al. (2016) Houdebine, E. R., Mullan, D. J., Paletou, F., & Gebran, M. 2016, ApJ, 822, 97
- Ilin et al. (2019) Ilin, E., Schmidt, S. J., Davenport, J. R. A., & Strassmeier, K. G. 2019, A&A, 622, A133
- Intema et al. (2017) Intema, H. T., Jagannathan, P., Mooley, K. P., & Frail, D. A. 2017, A&A, 598, A78
- Intema et al. (2009) Intema, H. T., van der Tol, S., Cotton, W. D., et al. 2009, A&A, 501, 1185
- Jackson et al. (1987) Jackson, P. D., Kundu, M. R., & White, S. M. 1987, in Cool Stars. Stellar Syst. Sun (Berlin, Heidelberg: Springer), 103–105
- Jeffers et al. (2018) Jeffers, S. V., Schöfer, P., Lamert, A., et al. 2018, A&A, 614, A76
- Jenkins et al. (2009) Jenkins, J. S., Ramsey, L. W., Jones, H. R., et al. 2009, ApJ, 704, 975
- Joshi & Chengalur (2010) Joshi, S. & Chengalur, J. 2010, in Proc. Sci. ISKAF2010, Vol. 112
- Kao et al. (2016) Kao, M. M., Hallinan, G., Pineda, J. S., et al. 2016, ApJ, 818, 24
- Kiraga & Stepień (2007) Kiraga, M. & Stepień, K. 2007, Acta Astron., 57, 149
- Kochukhov & Lavail (2017) Kochukhov, O. & Lavail, A. 2017, ApJ, 835, L4
- Kuzmychov et al. (2017) Kuzmychov, O., Berdyugina, S. V., & Harrington, D. M. 2017, ApJ, 847, 60
- Lacy et al. (2019) Lacy, M., Baum, S. A., Chandler, C. J., et al. 2019, ArXiv e-prints, arXiv:1907.01981
- Leto et al. (2016) Leto, P., Trigilio, C., Buemi, C. S., et al. 2016, MNRAS, 459, 1159
- López-Santiago et al. (2010) López-Santiago, J., Montes, D., Gálvez-Ortiz, M. C., et al. 2010, A&A, 514, A97
- Lynch et al. (2017) Lynch, C. R., Lenc, E., Kaplan, D. L., Murphy, T., & Anderson, G. E. 2017, ApJL, 836, L30
- McLean et al. (2012) McLean, M., Berger, E., & Reiners, A. 2012, ApJ, 746, 23
- Mechev et al. (2017) Mechev, A., Oonk, J. B. R., Danezi, A., et al. 2017, Proc. Int. Symp. Grids Clouds 2017, 2
- Melrose & Dulk (1982) Melrose, D. B. & Dulk, G. A. 1982, ApJ, 259, 844
- Mohan & Rafferty (2015) Mohan, N. & Rafferty, D. 2015, PyBDSF: Python Blob Detection and Source Finder
- Morin et al. (2010) Morin, J., Donati, J. F., Petit, P., et al. 2010, MNRAS, 407, 2269
- Moutou et al. (2017) Moutou, C., Hébrard, E. M., Morin, J., et al. 2017, MNRAS, 472, 4563
- Nakajima et al. (2010) Nakajima, T., Morino, J. I., & Fukagawa, M. 2010, AJ, 140, 713
- Newton et al. (2017) Newton, E. R., Irwin, J., Charbonneau, D., et al. 2017, ApJ, 834, 85
- Nichols et al. (2012) Nichols, J. D., Burleigh, M. R., Casewell, S. L., et al. 2012, ApJ, 760, 59
- Panagi & Andrews (1995) Panagi, P. M. & Andrews, A. D. 1995, MNRAS, 277, 423
- Pettersen (1989) Pettersen, B. R. 1989, Sol. Phys., 121, 299
- Reiners et al. (2012) Reiners, A., Joshi, N., & Goldman, B. 2012, AJ, 143, 93
- Roy et al. (2010) Roy, S., Hyman, S. D., Pal, S., et al. 2010, ApJL, 712, L5
- Samus et al. (2004) Samus, N., Durlevich, O., & al., E. 2004, VizieR Online Data Cat., II/250
- Savini et al. (2019) Savini, F., Bonafede, A., Brueggen, M., et al. 2019, A&A, 622, A24
- Shibata & Magara (2011) Shibata, K. & Magara, T. 2011, Living Rev. Sol. Phys., 8, 6
- Shimwell et al. (2017a) Shimwell, T. W., Röttgering, H. J., Best, P. N., et al. 2017a, A&A, 598, A104
- Shimwell et al. (2017b) Shimwell, T. W., Röttgering, H. J., Best, P. N., et al. 2017b, A&A, 598, A104
- Shimwell et al. (2019) Shimwell, T. W., Tasse, C., Hardcastle, M. J., et al. 2019, The LOFAR Two-metre Sky Survey: II. First data release
- Shkolnik et al. (2012) Shkolnik, E. L., Anglada-Escudé, G., Liu, M. C., et al. 2012, ApJ, 758, 56
- Slee et al. (2003) Slee, O. B., Willes, A. J., & Robinson, R. D. 2003, Publ. Astron. Soc. Aust., 20, 257
- Smirnov & Tasse (2015) Smirnov, O. M. & Tasse, C. 2015, MNRAS, 449, 2668
- Spangler (1976) Spangler, S. R. 1976, PASP, 88, 187
- Swarup (1991) Swarup, G. 1991, Proc. Int. Astron. Union, 131, 376
- Tasse (2014) Tasse, C. 2014, ArXiv e-prints
- Tasse et al. (2018) Tasse, C., Hugo, B., Mirmont, M., et al. 2018, A&A, 611, A87
- Thompson et al. (1980) Thompson, A. R., Clark, B. G., Wade, C. M., & Napier, P. J. 1980, ApJS, 44, 151
- Turnpenney et al. (2017) Turnpenney, S., Nichols, J. D., Wynn, G. A., & Casewell, S. L. 2017, MNRAS, 470, 4274
- van Haarlem et al. (2013) van Haarlem, M. P., Wise, M. W., Gunst, A. W., et al. 2013, A&A, 556, A2
- van Weeren et al. (2016) van Weeren, R. J., Brunetti, G., Brüggen, M., et al. 2016, MNRAS, 818, 204
- Villadsen & Hallinan (2019) Villadsen, J. & Hallinan, G. 2019, ApJ, 871, 214
- Wenger et al. (2000) Wenger, M., Ochsenbein, F., Egret, D., et al. 2000, A&AS, 143, 9
- West et al. (2008) West, A. A., Hawley, S. L., Bochanski, J. J., et al. 2008, AJ, 135, 785
- West et al. (2015) West, A. A., Weisenburger, K. L., Irwin, J., et al. 2015, ApJ, 812
- White et al. (1997) White, R. L., Becker, R. H., Helfand, D. J., & Gregg, M. D. 1997, ApJ, 475, 479
- White & Franciosini (1995) White, S. M. & Franciosini, E. 1995, ApJ, 444, 342
- White et al. (1989) White, S. M., Jackson, P. D., & Kundu, M. R. 1989, ApJS, 71, 895
- Wielebinski (2012) Wielebinski, R. 2012, J. Astron. Hist. Herit., 15, 76
- Williams et al. (2015) Williams, P. K., Berger, E., Irwin, J., Berta-Thompson, Z. K., & Charbonneau, D. 2015, ApJ, 799, 192
- Williams et al. (2016) Williams, W. L., Van Weeren, R. J., Röttgering, H. J., et al. 2016, MNRAS, 460, 2385
- Wright et al. (2011) Wright, N. J., Drake, J. J., Mamajek, E. E., & Henry, G. W. 2011, ApJ, 743, 48
- Yadav et al. (2016) Yadav, R. K., Christensen, U. R., Wolk, S. J., & Poppenhaeger, K. 2016, ApJ, 833, L28
- Yang et al. (2017) Yang, H., Liu, J., Gao, Q., et al. 2017, ApJ, 849, 36
- Zic et al. (2019) Zic, A., Stewart, A., Lenc, E., et al. 2019, MNRAS, 488, 559
Appendix A SPAM pipeline for GMRT data on Ross 867-868
The SPAM pipeline converts the observations into Stokes I visibilities in an early stage of the processing. This conversion is done on a best effort basis, meaning that if RR and LL are both available, Stokes I is formed through I=(RR+LL)/2, while if just one of them is available, I=RR or I=LL. Using the pipeline, we generated calibrated Stokes I visibilities and images for all observations.
In addition, the SPAM pipeline derives flux density, bandpass, and instrumental phase calibrations from a primary calibrator (typically 3C 48 or 3C 147) and applies them to the target field data (in our case RXJ1720.1+2638). Then it self-calibrates and images the target field data several times, initially bootstrapping to an externally supplied radio sky model, and ultimately applies SPAM ionospheric calibration to correct for direction-dependent phase errors (for details, see Intema et al. 2009). For the initial (phase-only) self-calibration of the 235 MHz observations, we bootstrapped to a radio sky model derived from the GMRT 150 MHz all-sky survey (TGSS; Intema et al. 2017). For every higher frequency, we bootstrapped to an image model derived from the frequency just below it (e.g., a source model from the 235 MHz image was used for bootstrapping the 325 MHz observations). This has proven to work well because of the relatively small distance in frequency between adjacent bands and the simple nature of the majority of radio sources, generally providing a good match in terms of resolution, flux density, and sensitivity. Also, the larger field of view at the lower frequency guarantees a model that fully encloses the higher frequency observation.
Appendix B LOFAR observations
The LOFAR data was observed as part of the LOFAR Two-metre Sky survey (LoTSS; Shimwell et al. 2017b, 2019), pointing P260+28 in project ID LC7024. Initially the data were processed on LOFAR archive compute facilities (e.g., Mechev et al. 2017) using PreFactor which is the standard LOFAR direction independent calibration pipeline (see van Weeren et al. 2016; Williams et al. 2016), which corrects for direction independent effects such as the bandpass (e.g., De Gasperin et al. 2019). After this, direction dependent calibration was performed to remove the ionospheric errors that are severe at low radio frequencies and to correct for errors in the LOFAR beam model. The direction dependent calibration was performed using the LoTSS processing pipeline444https://github.com/mhardcastle/ddf-pipeline that makes use of kMS (Tasse 2014; Smirnov & Tasse 2015) and DDFacet (e.g., Tasse et al. 2018) for calibration and imaging while applying direction dependent solutions.
Appendix C Radio survey observations for NVSS J171949+263007
| Survey | \tmark[(3)] | Flux density | Major\tmark[(4)] | Minor\tmark[(4)] | PA\tmark[(4)] | Mean Epoch\tmark[(5)] |
|---|---|---|---|---|---|---|
| (J2000) | (mJy) | (arcsec) | (arcsec) | (degrees) | (year) | |
| FIRST\tmark[(1)] | 17h19m49.314s +26∘30′07.69′′ | 5.52 | 5.37 | 172.8 | 1995.874 | |
| NVSS\tmark[(2)] | 17h19m49.24s +26∘30′07.2′′ | ¡19.0 | ¡18.3 | - | 19952.0 |
Notes. (1) The Faint Images of the Radio Sky at Twenty-Centimeters (FIRST) survey was made using the NRAO Very Large Array (VLA) producing images with 1.8” pixels, a typical rms of 0.15 mJy, and a resolution of 5 arcseconds (White et al. 1997). (2) The NRAO VLA Sky Survey (NVSS) was made at 1.4 GHz with a resolution of 45 arcseconds and a limiting peak source brightness of about 2.5 mJy/beam (Condon et al. 1998). (3) Source position right ascension () and declination () in sexagesimal notation. (4) Source major axis, minor axis, and position angle measured directly from map before deconvolving synthesized beam. No PA reported for NVSS observation.
Appendix D Radio observations for Ross 867-8
| Date Observation | Telescope | Frequency | Bandwidth | Correlations | Time | Sensitivity\tmark[(1)] | \tmark[(2)] | Resolution\tmark[(3)] |
|---|---|---|---|---|---|---|---|---|
| (YYYY-MM-DD) | (MHz) | (MHz) | parameters | (min) | (mJy) | |||
| 1984-06-29 | VLA | 4,860 | 100 | RR,LL,RL,LR | 141 | 81 | ND\tmark[(4)] | 11.7′′4.7′′ (-89∘) |
| 1986-02-10 | VLA | 1,540 | 50 | RR,LL,RL,LR | 50 | 250 | NA\tmark[(5)] | NA\tmark[(5)] |
| 1986-07-10 | VLA | 1,465 | 50 | RR,LL,RL,LR | 27 | NA\tmark[(5)] | NA\tmark[(5)] | NA\tmark[(5)] |
| 1986-08-06 | VLA | 1,464 | 50 | RR,LL,RL,LR | 24 | NA\tmark[(5)] | NA\tmark[(5)] | NA\tmark[(5)] |
| 4,760 | 50 | RR,LL,RL,LR | 15 | NA\tmark[(5)] | NA\tmark[(5)] | NA\tmark[(5)] | ||
| 1990-08-27 | VLA | 1,565 | 100 | RR,LL,RL,LR | 67 | 320 | ND\tmark[(4)] | 4.2′′4.0′′ (-65∘) |
| 4,785 | 100 | RR,LL,RL,LR | 64 | 38 | 1.32′′1.20′′ (-45∘) | |||
| 8,515 | 100 | RR,LL,RL,LR | 64 | 42 | ND\tmark[(4)] | 0.69′′0.68′′ (-27∘) | ||
| 2007-03-08 | GMRT | 325 | 32 | RR,LL | 280 | 356 | 9.7′′8.4′′ (-53∘) | |
| LL | 224 | 10.3′′8.4′′ (-36∘) | ||||||
| RR | 248 | 8.9′′8.6′′ (-23∘) | ||||||
| 2007-03-10 | GMRT | 610 | 32 | RR,LL | 310 | 52 | 4.5′′3.9′′ (37∘) | |
| LL | 82 | 4.6′′4.0′′ (41∘) | ||||||
| RR | 94 | 4.5′′4.2′′ (13∘) | ||||||
| 2011-07-24 | GMRT | 235 | 17 | LL | 346 | 350 | 12.4′′10.7′′ (59∘) | |
| 610 | 33 | RR | 40 | 5.0′′4.1′′ (77∘) | ||||
| 2015-03-22 | JVLA | 1,519 | 64 | RR,LL,RL,LR | 40 | 15 | 1.32′′1.20′′ (-42∘) | |
| 2017-01-25 | LOFAR | 145 | 48 | XX,YY,XY,YX | 8 | 200 | ND\tmark[(4)] | 8.78′′6.43′′ (62∘) |
| 2017-10-02 | JVLA | 2,988 | 150 | RR,LL,RL,LR | 0.83 | 124 | ND\tmark[(4)] | 2.56′′2.14′′ (52∘) |
Notes. (1) Sensitivity at the image center. (2) Flux density detected for Ross 867. Where all correlation parameters were available, the value reported corresponds to Stokes I. (3) Restoring beam major minor axis (position angle). (4) No detection. (5) Not available. Some observations made in 1986 with the VLA did not have a flux calibrator, and were not well centered on the target. Hence, any flux measurement is hard to interpret. We relied on what Jackson et al. (1987) and White et al. (1989) reported for these observations (see Section 4.3).