The Smallest Scale of Hierarchy Survey (SSH). I. Survey Description.
Abstract
The Smallest Scale of Hierarchy (SSH) survey is an ongoing strategic large program at the Large Binocular Telescope, aimed at the detection of faint stellar streams and satellites around 45 late-type dwarf galaxies located in the Local Universe within 10 Mpc. SSH exploits the wide-field, deep photometry provided by the Large Binocular Cameras in the two wide filters and . This paper describes the survey, its goals, and the observational and data reduction strategies. We present preliminary scientific results for five representative cases (UGC 12613, NGC 2366, UGC 685, NGC 5477 and UGC 4426) covering the whole distance range spanned by the SSH targets. We reach a surface brightness limit as faint as 31 mag arcsec-2 both for targets closer than 45 Mpc, which are resolved into individual stars, and for more distant targets through the diffuse light. Our analysis reveals the presence of extended low surface brightness stellar envelopes around the dwarfs, reaching farther out than what traced by the integrated light, and as far out as, or even beyond, the observed H I disk. Stellar streams, arcs, and peculiar features are detected in some cases, indicating possible perturbation, accretion, or merging events. We also report on the discovery of an extreme case of Ultra Diffuse Galaxy ( mag/arcsec2) in the background of one of our targets, to illustrate the power of the survey in revealing extremely low surface brightness systems.
keywords:
galaxies: dwarf – galaxies: formation – galaxies: interactions – galaxies: irregular – galaxies: individuals: UGC 12613, NGC 2366, UGC 685, NGC 5477, UGC 4426 – galaxies: stellar content.1 Introduction
In the Cold Dark Matter (CDM) cosmological scenario (Peebles et al., 1982), galaxies are assembled over time through the accretion of smaller systems (White, 1978). In fact, there is ample observational evidence of interaction of satellites with the massive galaxies they are orbiting around, such as the Milky Way, Andromeda, spirals and giant ellipticals in the Local Volume (e.g., Belokurov et al., 2006; Ibata et al., 2001; McConnachie et al., 2009; Martinez-Delgado et al., 2010; Crnojević et al., 2016). Actually, numerical models predict that isolated dark halos and sub-halos contain substructures down to the lowest resolution limit of the simulations (Diemand et al., 2008; Wheeler et al., 2015). Hence, not only massive galaxies, but also low-mass ones are predicted to show observational evidence of satellite accretions. A few recent discoveries have indeed revealed the existence of satellites around dwarf galaxies, but their sample is still limited (e.g., Rich et al., 2012; Martínez-Delgado et al., 2012; Sand et al., 2015; Belokurov & Koposov, 2016; Amorisco, Evans & van de Ven, 2014; Annibali et al., 2016; Makarova et al., 2018). Systematic searches for dwarf galaxy satellites are therefore important to observationally test the self-similarity of the hierarchical formation process at all scales.
So far, the most detailed searches for dwarfs’ companions have concentrated on the satellites of the Milky Way (MW) and, to a lesser extent, of M31. Since these are predominantly of early morphological type, because of the morphology-distance relation (Dressler, 1980; Binggeli, Tamman, & Sandage, 1987), the vast majority of late-type dwarfs in the Local Universe have not been searched for small companions with deep wide-field imaging observations yet. The notable exceptions are of course the Magellanic Clouds, for which the Gaia satellite has recently allowed to measure precise proper motions and to confirm the existence of at least 4 sub-satellites (Kallivayalil et al., 2019). However, late-type dwarfs are particularly interesting to search for the presence of stellar streams or companions, because of the possible connection between accretion events and star formation activity. Recent studies have shown that disturbed H I kinematics, H I companions, and filamentary H I structures are more common in starburst dwarfs than in typical star-forming irregulars (Lelli et al., 2014). Understanding the origin of starbursts in dwarf galaxies is important for several reasons: these systems are currently the primary candidate source for cosmic reionization at (Atek et al., 2014) and, due to their shallow potential well, they are the best systems to study galactic winds and feedback from massive stars.
There are two ongoing surveys that can significantly improve the census of dwarf galaxy companions in the Local Volume (but see also Stierwalt et al., 2015, for a survey of dwarf galaxy pairs at ). One is the Solitary Local dwarfs survey (Solo), a wide-field photometric study targeting all the 42 isolated dwarf galaxies within 3 Mpc of the MW and beyond the nominal virial radius of MW and M31 (Higgs et al., 2016). Solo is based on multiband imaging from the Canada-France-Hawaii Telescope/MegaCam for northern targets, and the Magellan/Megacam for southern targets. The survey includes both irregular and spheroidal dwarfs, with a prevalence of late-type systems over early-type ones. The other survey is the Magellanic Analog Dwarf Companions And Stellar Halos (MADCASH), designed to use resolved stars to map the virial volumes of dwarf spiral galaxies within 4 Mpc and with stellar masses of (Carlin et al., 2016). MADCASH is based on Subaru/Hyper Suprime-Cam wide-field imaging.
In this paper we introduce a new survey aimed precisely at searching satellites of (and signs of accretion events around) late-type dwarfs at the smallest mass scale: the Smallest Scale of Hierarchy (SSH) survey. SSH is currently in execution at the Large Binocular Telescope (LBT). LBT, with the resolving power of its two primary mirrors of 8.4 m diameter each (i.e. a combined collecting area corresponding to that of a single 11.9 m mirror) and the large field of view (23) of its Large Binocular Cameras (LBC) offers the optimal observational set-up to study the outskirts of late-type dwarfs in the Local Universe. With these data we plan to characterise the frequency and properties of streams and substructures around late-type dwarfs as a function of galaxy mass and environment, and to study the impact of accretion/merging phenomena on the system’s star formation activity.
SSH will observe 45 late-type dwarfs at distances between 1 and 10 Mpc in the and photometric bands (sampling 770 kpc auround the target), thus significantly extending the volume covered by the other two surveys. Only a few SSH targets, with distances 3 Mpc, overlap with Solo: UGC 8091, UGC 9240, UGC 12613, UGC 6817, UGCA 276, NGC 4163 and UGC 7577. Moreover, the SSH dwarfs have luminosities/masses in most cases lower than those sampled by MADCASH, and there is only one galaxy, namely NGC 4214, in common between the two samples. In conclusion, there is only marginal overlap of our survey with Solo or MADCASH.
Before embarking in such a long-term project, we tested its feasibility with a pilot study searching for streams or companions around DDO 68, a small star-forming dwarf ( in stars, Sacchi et al., 2016), extremely metal-poor (1/40 , Izotov & Thuan, 2009; Annibali et al., 2019a), located in the huge Lynx-Cancer void at 12.7 Mpc (Sacchi et al., 2016). Our LBT study revealed a few previously undetected, faint ( mag arcsec-2) stellar substructures around the main body (Annibali et al., 2016) of DDO 68, one of them later studied in more detail with HST photometry and confirmed to be actually connected to DDO 68 (Annibali et al., 2019b). This photometry, combined with N-body simulations, showed that DDO 68 is experiencing a merging with a ten times lighter companion, and is also accreting an even smaller system, 100 times lighter. This provides indisputable observational evidence of the hierarchical merging process in action at very low galactic mass scales. It also demonstrates the excellent performances of LBT in the search of substructures around dwarfs.
As suggested by the case of DDO 68, dwarfs at the outskirts of groups, or in isolation, are likely the best candidates where to search for the presence of ”sub-satellites”. Cosmological simulations show that, once a group of dwarfs with their satellites falls into a massive host, like the MW, it is eventually disassembled by tidal forces wiping out evidence of coherent structure (Deason et al., 2015). Therefore it is natural to expect satellites of satellites residing in lower density environments to survive longer than those residing close to massive hosts (e.g., Bellazzini et al., 2013).
The paper is structured as follows. Section 2 gives a general overview of the survey, its goals and observational strategy. The sample of galaxies is described in Section 3, the image acquisition in Section 4, and the image reduction in Section 5. Section 6 describes the photometric reduction, while we present color-magnitude diagrams (CMDs) and star count density maps for five representative galaxies in Sections 7 and 8, respectively. The derivation of surface brightness profiles is described in Section 9. We discuss our results in Section 10 and present a summary in Section 11.
2 The LBT SSH Survey
SSH is an Italian strategic111Strategic programs are long-term programs with the highest priority meant to increase the impact of LBT in the astronomical community at large by leading to significant advances in key scientific topic, highlighting the capabilities of the LBT unique instruments. long-term program (PI F. Annibali) in execution at LBT since the end of 2016. As mentioned above, the main goals of SSH are: i) characterizing the frequency and properties of streams and substructures around late-type dwarfs as a function of galaxy mass and environment, and ii) linking the accretion/merging events with the galaxy star formation history (SFH) derived from deep CMDs obtained with Hubble Space Telescope (HST) photometry. These two long-term goals require the study of a conspicuous sample in order to provide statistically significant results, and thus will be reached only after completion of our program. However, as with our pilot study of DDO 68, successful detection of sub-structures in individual targets may provide by itself very interesting results.
The target galaxies, located up to a distance of 10 Mpc, cover a wide range of density environments, from very isolated galaxies to group members, and a wide range in luminosity, from twice as luminous as the LMC, to 5 magnitude dimmer.
Our strategy is to search for faint substructures on - and - images obtained with LBC 1 h binocular exposures, using stellar counts for targets closer than 45 Mpc (the exact distance depending on the seeing and on the galaxy crowding), reaching a surface brightness limit as faint as mag arcsec-2 (see Section 9 of this paper and the study of Centaurus A by Crnojević et al., 2016), and relying on the integrated light for more distant targets, reaching a similar surface brightness limit (see Section 9.1). Observations in two bands are necessary to construct, for the nearest galaxies, CMDs that can allow to separate red giant branch (RGB) stars from background contaminants. For all the galaxies, and photometry will be used to constrain the age, the metallicity, and the stellar mass of the detected substructures. Candidate companions or substructures detected around targets more distant than 45 Mpc will need further follow-up observations (spectroscopy and/or high spatial resolution imaging) to constrain their distance and confirm their physical association with the host galaxies (see e.g. Annibali et al., 2016, 2019b, for the case of DDO 68).
Finally, we will run N-body simulations to reconstruct the system’s interaction history. The simulations will constrain the mass and structural and orbital parameters of the accreting satellites, as well as the timescales of the interaction.
SSH will also allow us to investigate the hypothesis that strong starbursts in dwarf galaxies are triggered by interaction/accretion events. For instance, in the case of DDO 68, a significant increase in the star formation activity occurred 100 Myr ago, compatible with the encounter timescale predicted by our N-body simulations. Is there always a temporal correspondence between periods of enhanced star formation activity and a close encounter, as derived from N-body simulations? To try to answer this question, we will homogeneously re-analyse archival HST data of our sample targets and use our code (Cignoni et al., 2015) to infer the SFH from their CMDs. Then we will look for possible relationships between the star formation activity and the galaxy accretion history.
3 The Sample
| Name | Other Name | R.A.(J2000) | Dec.(J2000) | Distance | T | MD | ||||||
|---|---|---|---|---|---|---|---|---|---|---|---|---|
| [hh:mm:ss] | [dd:mm:ss] | [arcmin] | [Mpc] | [kpc] | [mag] | [mag] | ||||||
| UGC 685 | 01:07:22.4 | +16:41:02 | 1.2 | 4.70 | 1.6 | -14.3 | 9 | 0.157 | -1.4 | NGC 0253 | -1.1 | |
| UGC 1249 | IC 1727 | 01:47:29.9 | +27:20:00 | 8.0 | 7.45 | 17.3 | -18.1 | 8 | 0.217 | 4.0 | NGC 0672 | 4.0 |
| UGC 1281 | 01:49:32.0 | +32:35:23 | 4.7 | 5.13 | 7.0 | -16.7 | 7 | 0.130 | -1.1 | NGC 0784 | -0.9 | |
| KK 16 | AGC 111977 | 01:55:20.6 | +27:57:15 | 1.0 | 4.7 | 1.4 | -12.1 | 10 | 0.187 | -1.5 | NGC 0784 | -1.1 |
| KK 17 | AGC 111164 | 02:00:09.9 | +28:49:57 | 1.0 | 4.7 | 1.4 | -11.2 | 10 | 0.146 | 1.1 | NGC 0784 | 1.1 |
| NGC 784 | UGC 1501 | 02:01:17.0 | +28:50:15 | 6.6 | 4.94 | 9.5 | -16.1 | 7 | 0.162 | -1.1 | NGC 0784 | -0.9 |
| KKH 37 | 06:47:45.8 | +80:07:26 | 1.2 | 3.39 | 1.2 | -11.6 | 10 | 0.204 | 0.0 | M 81 | 0.3 | |
| UGC 3755 | 07:13:51.6 | +10:31:19 | 1.8 | 6.66 | 3.5 | -15.9 | 10 | 0.242 | -2.2 | NGC 2683 | -1.7 | |
| NGC 2366 | UGC 3851 | 07:28:54.6 | +69:12:57 | 7.3 | 3.19 | 6.8 | -16.2 | 10 | 0.100 | 1.0 | NGC 2403 | 1.1 |
| UGC 3974 | DDO 47 | 07:41:55.4 | +16:48:09 | 5.0 | 8.02 | 11.7 | -16.0 | 8 | 0.091 | 1.0 | KK 65 | 1.0 |
| KK 65 | 07:42:31.2 | +16:33:40 | 1.1 | 8.02 | 2.6 | -14.3 | 10 | 0.085 | 1.6 | UGC 3974 | 1.6 | |
| UGC 4305 | Holmberg II | 08:19:04.0 | +70:43:09 | 7.9 | 3.39 | 7.8 | -16.7 | 9 | 0.116 | 0.7 | M 81 | 1.0 |
| UGC 4426 | DDO 52 | 08:28:28.4 | +41:51:24 | 2.0 | 10.28 | 6.0 | -15.2 | 10 | 0.099 | -1.2 | NGC 2841 | -0.9 |
| UGC 4459 | DDO 53 | 08:34:07.2 | +66:10:54 | 1.5 | 3.56 | 1.5 | -13.1 | 10 | 0.103 | 0.8 | M 81 | 1.0 |
| UGC 5139 | Holmberg I | 09:40:32.3 | +71:10:56 | 3.6 | 3.84 | 4.0 | -13.9 | 10 | 0.138 | 1.7 | M 81 | 1.8 |
| NGC 2976 | UGC 5221 | 09:47:15.3 | +67:55:00 | 5.9 | 3.56 | 6.1 | -16.7 | 7 | 0.195 | 2.9 | M 81 | 3.0 |
| UGC 5456 | 10:07:19.6 | +10:21:46 | 1.6 | 3.80 | 1.8 | -14.3 | 9 | 0.110 | -1.9 | NGC 2903 | -1.3 | |
| UGC 5666 | IC 2574 | 10:28:21.2 | +68:24:43 | 13.2 | 4.02 | 15.4 | -17.3 | 8 | 0.099 | 1.0 | M 81 | 1.2 |
| UGC 6456 | 11:27:59.9 | +78:59:24 | 1.6 | 4.3 | 2.0 | -13.7 | 10 | 0.102 | -0.1 | M 81 | 0.1 | |
| UGC 6541 | Mrk 178 | 11:33:28.9 | +49:14:14 | 1.2 | 3.89 | 1.3 | -13.6 | 11 | 0.052 | -0.6 | M 81 | -0.2 |
| NGC 3738 | UGC 6565 | 11:35:48.8 | +54:31:26 | 2.5 | 4.90 | 3.6 | -16.5 | 10 | 0.028 | -0.8 | M81 | -0.4 |
| NGC 3741 | UGC 6572 | 11:36:06.2 | +45:17:01 | 2.0 | 3.19 | 1.8 | -13.1 | 10 | 0.067 | -0.7 | M 81 | -0.4 |
| UGC 6817 | DDO 99 | 11:50:53.0 | +38:52:49 | 4.1 | 2.64 | 3.1 | -13.6 | 10 | 0.072 | -0.8 | NGC 4214 | -0.4 |
| NGC 4068 | IC 757 | 12:04:00.8 | +52:35:18 | 3.3 | 4.31 | 4.1 | -15.2 | 9 | 0.059 | -0.5 | NGC 4736 | -0.1 |
| NGC 4163 | UGC 7199 | 12:12:09.1 | +36:10:09 | 1.8 | 2.96 | 1.5 | -13.6 | 9 | 0.055 | 2.3 | NGC 4214 | 2.3 |
| UGCA 276 | DDO 113 | 12:14:57.9 | +36:13:08 | 1.5 | 3.18 | 1.4 | -11.8 | 10 | 0.054 | 1.3 | NGC 4214 | 1.5 |
| NGC 4214 | UGC 7278 | 12:15:38.9 | +36:19:40 | 8.5 | 2.92 | 7.2 | -17.1 | 8 | 0.072 | 1.2 | NGC 4163 | 1.2 |
| UGC 7408 | DDO 120 | 12:21:15.0 | +45:48:41 | 2.7 | 6.99 | 5.5 | -16.0 | 9 | 0.032 | 0.3 | NGC 4258 | 0.5 |
| NGC 4395 | UGC 7524 | 12:25:48.9 | +33:32:48 | 13.2 | 4.61 | 17.7 | -17.7 | 8 | 0.047 | 0.1 | NGC 4736 | 0.3 |
| UGC 7577 | DDO 125 | 12:27:40.9 | +43:29:44 | 4.3 | 2.74 | 3.4 | -14.4 | 9 | 0.067 | -0.8 | NGC 4214 | -0.4 |
| UGC 7605 | 12:28:38.7 | +35:43:03 | 1.1 | 4.43 | 1.4 | -13.5 | 10 | 0.040 | 0.4 | NGC 4244 | 0.8 | |
| NGC 4605 | UGC 7831 | 12:40:00.3 | +61:36:29 | 5.8 | 5.47 | 9.2 | -17.8 | 8 | 0.039 | -1.1 | M 81 | -0.6 |
| UGC 7866 | IC 3687 | 12:42:15.1 | +38:30:12 | 3.4 | 4.57 | 4.5 | -14.6 | 10 | 0.055 | 1.4 | NGC 4736 | 1.4 |
| UGC 8091 | DDO 155 | 12:58:40.4 | +14:13:03 | 1.1 | 2.13 | 0.7 | -12.0 | 10 | 0.071 | -1.4 | MW | -0.8 |
| UGC 8320 | DDO 168 | 13:14:27.9 | +45:55:09 | 3.6 | 4.33 | 4.5 | -15.1 | 10 | 0.042 | 0.3 | NGC 4736 | 0.4 |
| NGC 5204 | UGC 8490 | 13:29:36.2 | +58:25:06 | 5.0 | 4.65 | 6.8 | -16.6 | 8 | 0.034 | -0.9 | NGC 4736 | -0.4 |
| NGC 5238 | UGC 8565 | 13:34:42.5 | +51:36:49 | 2.0 | 4.21 | 2.4 | -14.3 | 10 | 0.027 | -0.4 | NGC 4736 | -0.2 |
| UGC 8638 | 13:39:19.4 | +24:46:32 | 1.2 | 4.27 | 1.5 | -13.1 | 10 | 0.036 | -0.2 | NGC 4826 | -0.1 | |
| UGC 8651 | DDO 181 | 13:39:53.8 | +40:44:21 | 2.3 | 3.02 | 2.0 | -13.0 | 10 | 0.017 | -1.1 | NGC 4736 | -0.6 |
| UGC 8760 | DDO 183 | 13:50:50.6 | +38:01:09 | 2.2 | 3.24 | 2.1 | -13.1 | 10 | 0.045 | -1.0 | NGC 4736 | -0.6 |
| NGC 5477 | UGC 9018 | 14:05:33.3 | +54:27:4 | 1.9 | 6.76 | 3.7 | -15.0 | 9 | 0.030 | 1.4 | M 101 | 1.4 |
| UGC 9240 | DDO 190 | 14:24:43.4 | +44:31:33 | 1.8 | 2.80 | 1.5 | -13.9 | 9 | 0.034 | -1.2 | M 81 | -0.7 |
| NGC 6503 | UGC 11012 | 17:49:27.1 | +70:08:40 | 7.1 | 5.27 | 10.9 | -17.8 | 6 | 0.088 | -1.1 | NGC 6946 | -0.8 |
| NGC 6789 | UGC 11425 | 19:16:42.1 | +63:58:17 | 1.80 | 3.0 | 1.6 | -14.3 | 9 | 0.183 | -1.3 | M 81 | -0.8 |
| UGC 12613 | Pegasus Dw | 23:28:36.2 | +14:44:35 | 5.0 | 0.97 | 1.1 | -12.1 | 10 | 0.187 | 0.9 | M 31 | 1.0 |
-
•
Columns (1) and(2): galaxy name; Col. (3) and (4): equatorial coordinates for the epoch J2000; Col. (5): from K13, major angular diameter in arcminutes, corresponding to the Holmberg isophote (26.5 mag/arcsec2) in the B band; Col. (6): distance in Mpc; references to the distance estimates can be found in K13; Col (7): linear major diameter in kpc, computed from the angular diameters in Col(5) and the distances in Col(6); Col (8): absolute magnitude of the galaxy in the B band, computed adopting the apparent B magnitudes in K13 and the distances in Col. (6); Col (9): morphological type according to the classification of de Vaucouleurs et al. (1991); Col (10): Galactic extinction in the V band according to Schlafly & Finkbeiner (2011); Col (10): tidal index , as defined in K13 and Eq. (1) of this paper; Col (11): main disturber galaxy; Col (13): tidal index , as defined in K13 and Eq. (2) of this paper.
The targets for the SSH survey were selected from the Updated Nearby Galaxy Catalog by Karachentsev et al. (2013), hereafter K13, which consists of 900 nearby galaxies having individual distance estimates within 11 Mpc. The K13 catalog collects several observables for each galaxy, including the angular diameter, the apparent magnitudes in different bands (far-UV, B, and Ks), the H and H I fluxes, the morphological type T as defined by de Vaucouleurs et al. (1991), the radial velocity and the distance from one or more methods (e.g., TRGB, Cepheids, surface brightness fluctuations, Tully-Fisher and Fundamental Plane relations). The catalog also provides different indices that characterize the local environment, such as the “tidal” indices , , on which we will come back later. Starting from the K13 catalog, the SSH targets were selected according to the following criteria: i) galaxies located in the northern hemisphere; ii) with distance determination from the TRGB; iii) with foreground extinction ; iv) with morphological type T6 (late spirals and irregulars); v) with absolute magnitudes in the range ; vi) with apparent major diameter in the range 1-15 arcmin; vii) with HST photometry available in the archive. These selection criteria resulted into a sample of 58 galaxies (irregulars, blue compact dwarfs and spiral dwarfs), from which we selected a smaller sub-sample of 45 galaxies uniformly distributed in right ascension to be observed with the LBT. Among the 13 galaxies not observed by SSH are objects already studied in the literature through deep, optical wide-field imaging, such as, e.g. NGC 4449 (Martínez-Delgado et al., 2012), Sextans B (Bellazzini et al., 2014), KDG 61 and NGC 3077 (Okamoto et al., 2015).
The adopted selection criteria are driven by the need to construct a sample large enough to allow for sufficient statistics in the search of rare, faint signatures of accretion events, and to permit a statistical characterization of the hierarchical formation process over a wide range of galaxy masses and local environments. At the same time it is necessary to select targets for which the LBC, with a field of view of 23′23′, is most efficient in revealing the presence of nearby companions and substructures: we translated this into the requirement of a maximum angular diameter of 15′, to allow the entire galaxy and a significant portion of its surroundings to be imaged with one single LBC pointing, and a minimum angular diameter of 1′, below which even the small HST field of view can accomplish the goal. Ancillary HST data for all the galaxies included in the sample are needed to get deep and accurate photometry of the resolved stars that allow to infer high-quality SFHs; this requirement is driven by our goal to study the connection between accretion phenomena and starbursts in dwarf galaxies, as described in Section 2. For the same reason, we restricted our sample to late-type systems, for which it is possible to reconstruct the recent SFH in great details. Our morphological selection naturally implies a bias toward low-density environments since, according to the well-known morphology-density relation (Dressler, 1980; Binggeli, Tamman, & Sandage, 1987; Binggeli, Tarenghi, & Sandage, 1990), early-type dwarfs are typically located in the proximity of massive hosts while late-type dwarfs preferentially reside at the outskirts of galaxy groups; however, we found that the selected galaxies span a wide variety of environments, as quantified by the and tidal indices introduced by K13.
More specifically, is defined as
| (1) |
where and are, respectively, the mass and the distance of the “main disturber” (MD) galaxy (i.e. the one inducing the highest tidal force ), and C is a constant chosen to give for a galaxy located on the “zero velocity sphere” relative to the MD. In practice, galaxies with are members of a group, while galaxies with can be considered isolated.
In order to account for the circumstance that can significantly change with time due to the orbital motion of galaxies, Karachentsev et al. (2013) also introduced the index, defined as the sum of the tidal forces produced by the five most important neighbors:
| (2) |
which provides a more robust characterization of the tidal forces experienced by a galaxy over its lifetime.
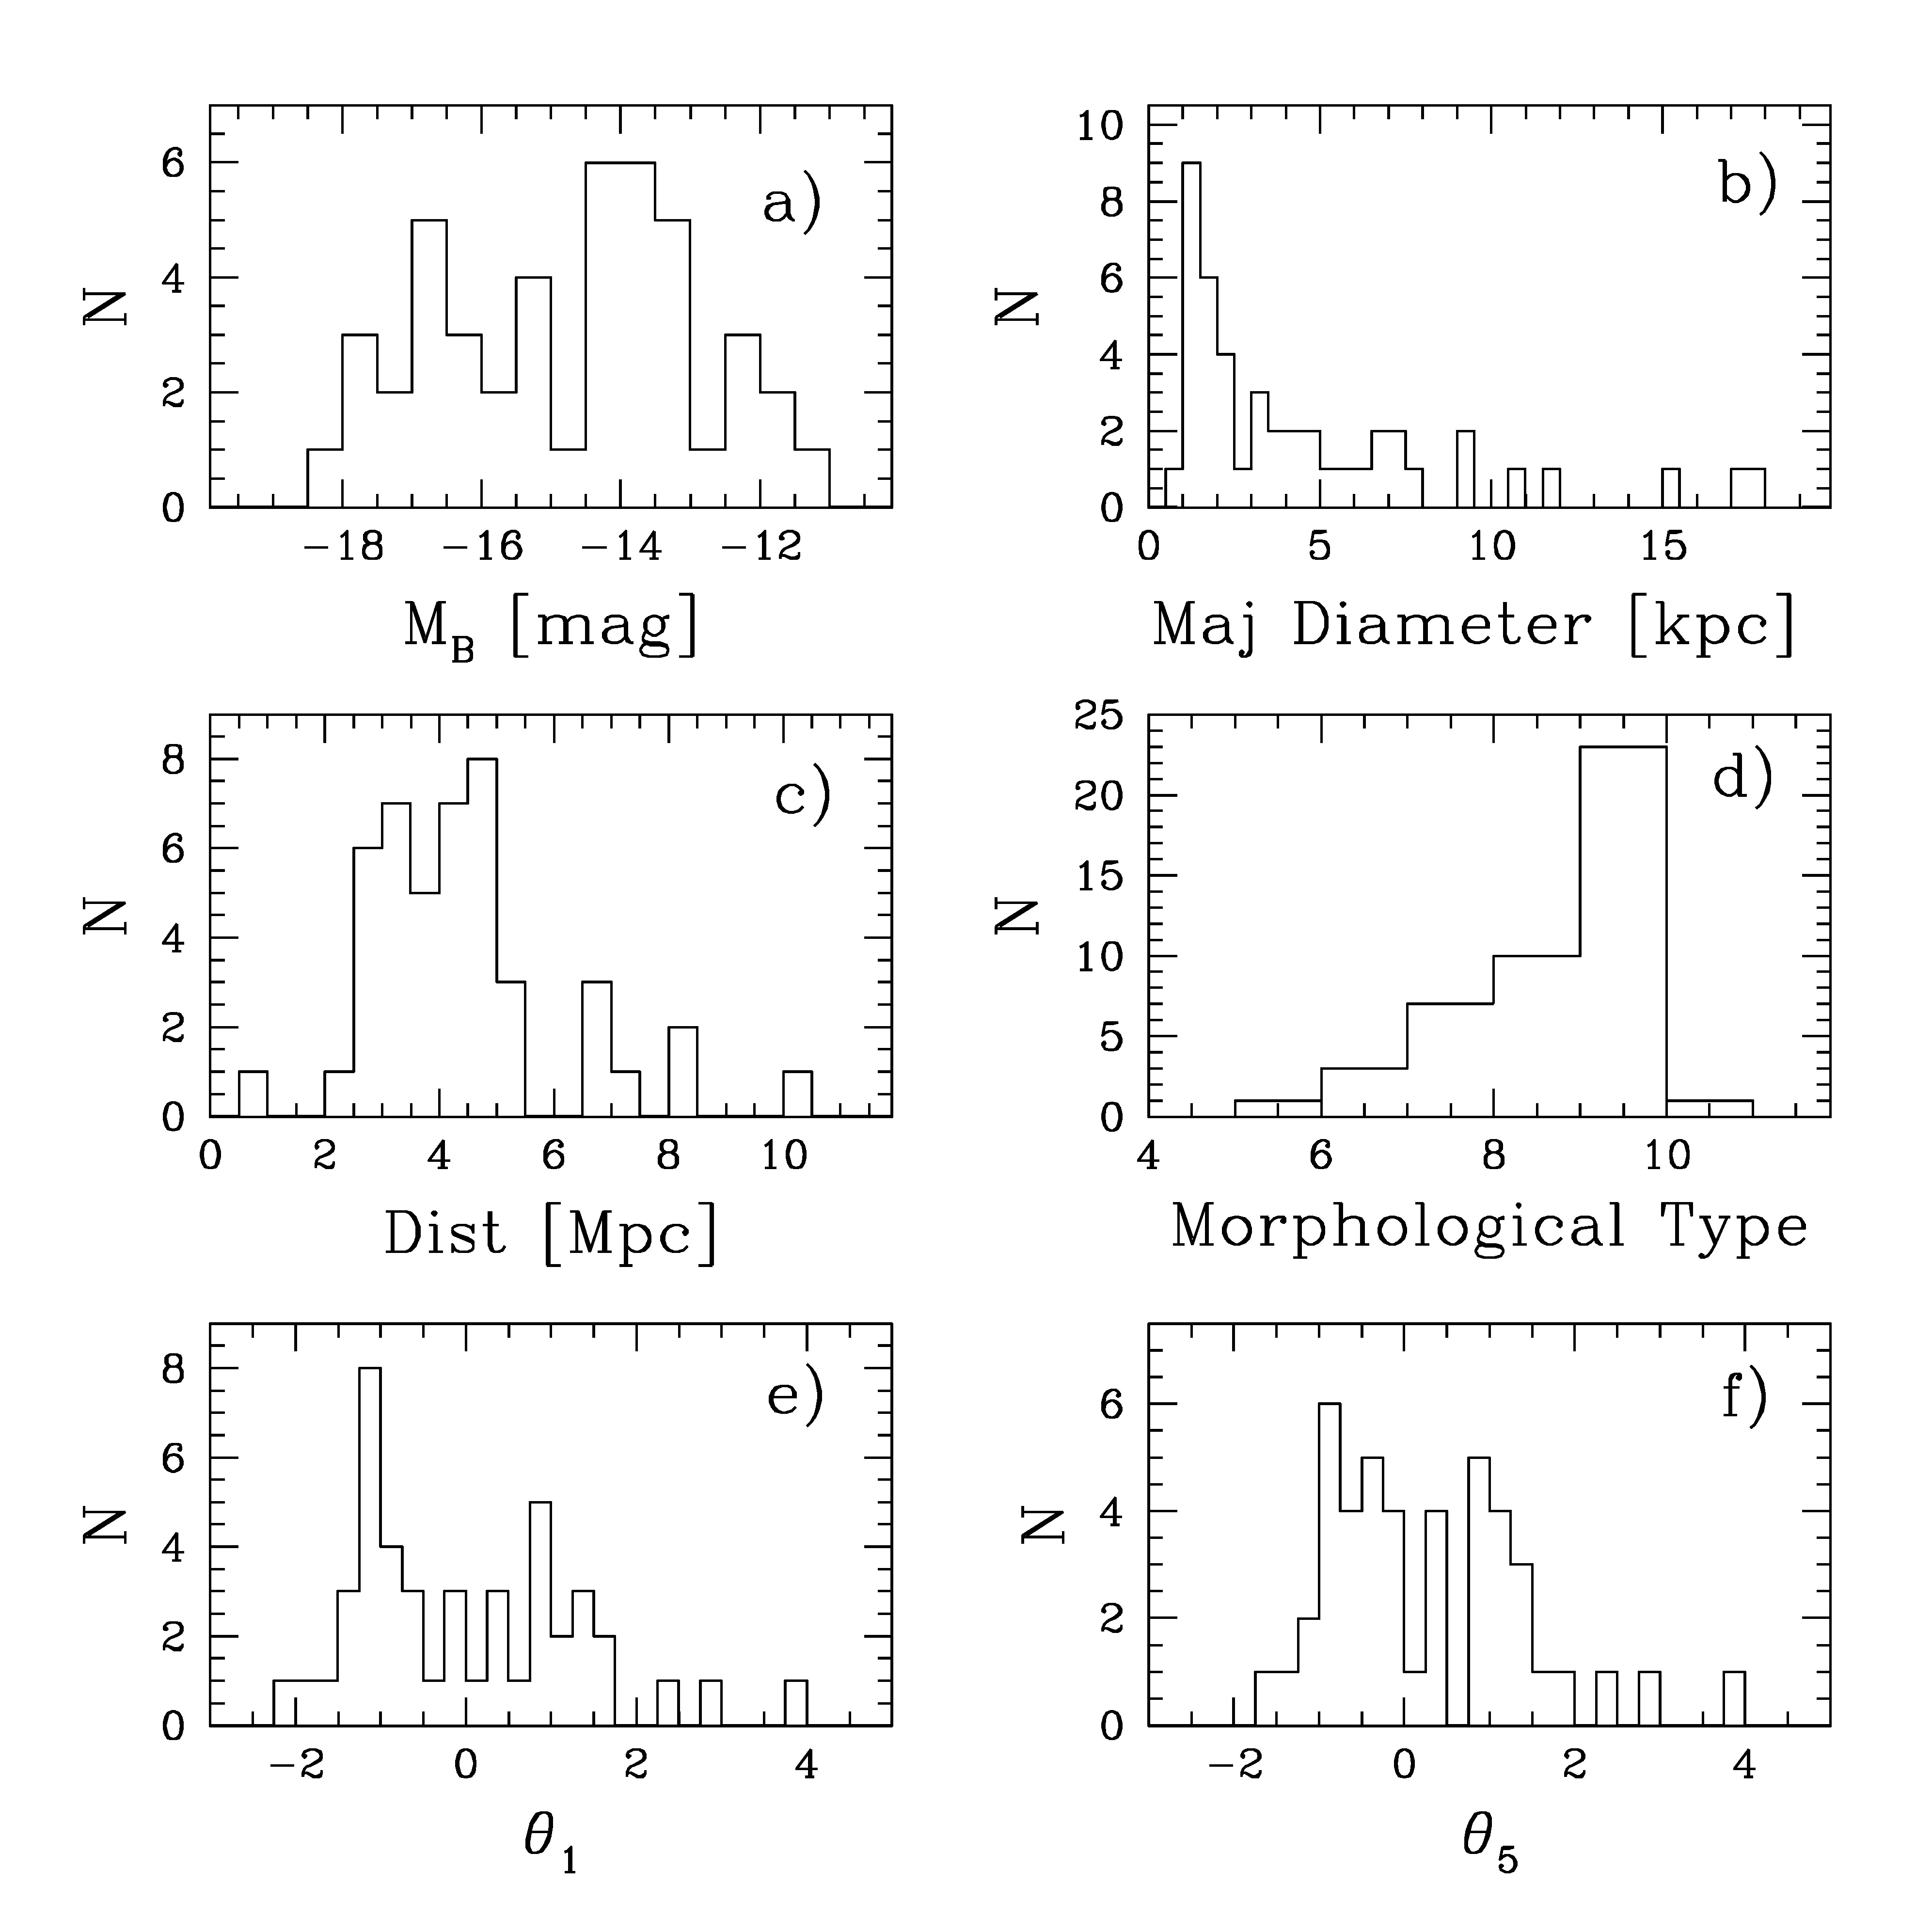
The final list of 45 galaxies in the SSH sample and their principal characteristics are presented in Table 1. For each galaxy we provide the coordinates, the angular and linear major diameters, the distance derived from the TRGB, the absolute B magnitude, the morphological type T, the galactic extinction , the two tidal indices and , and the name of the main perturber galaxy.
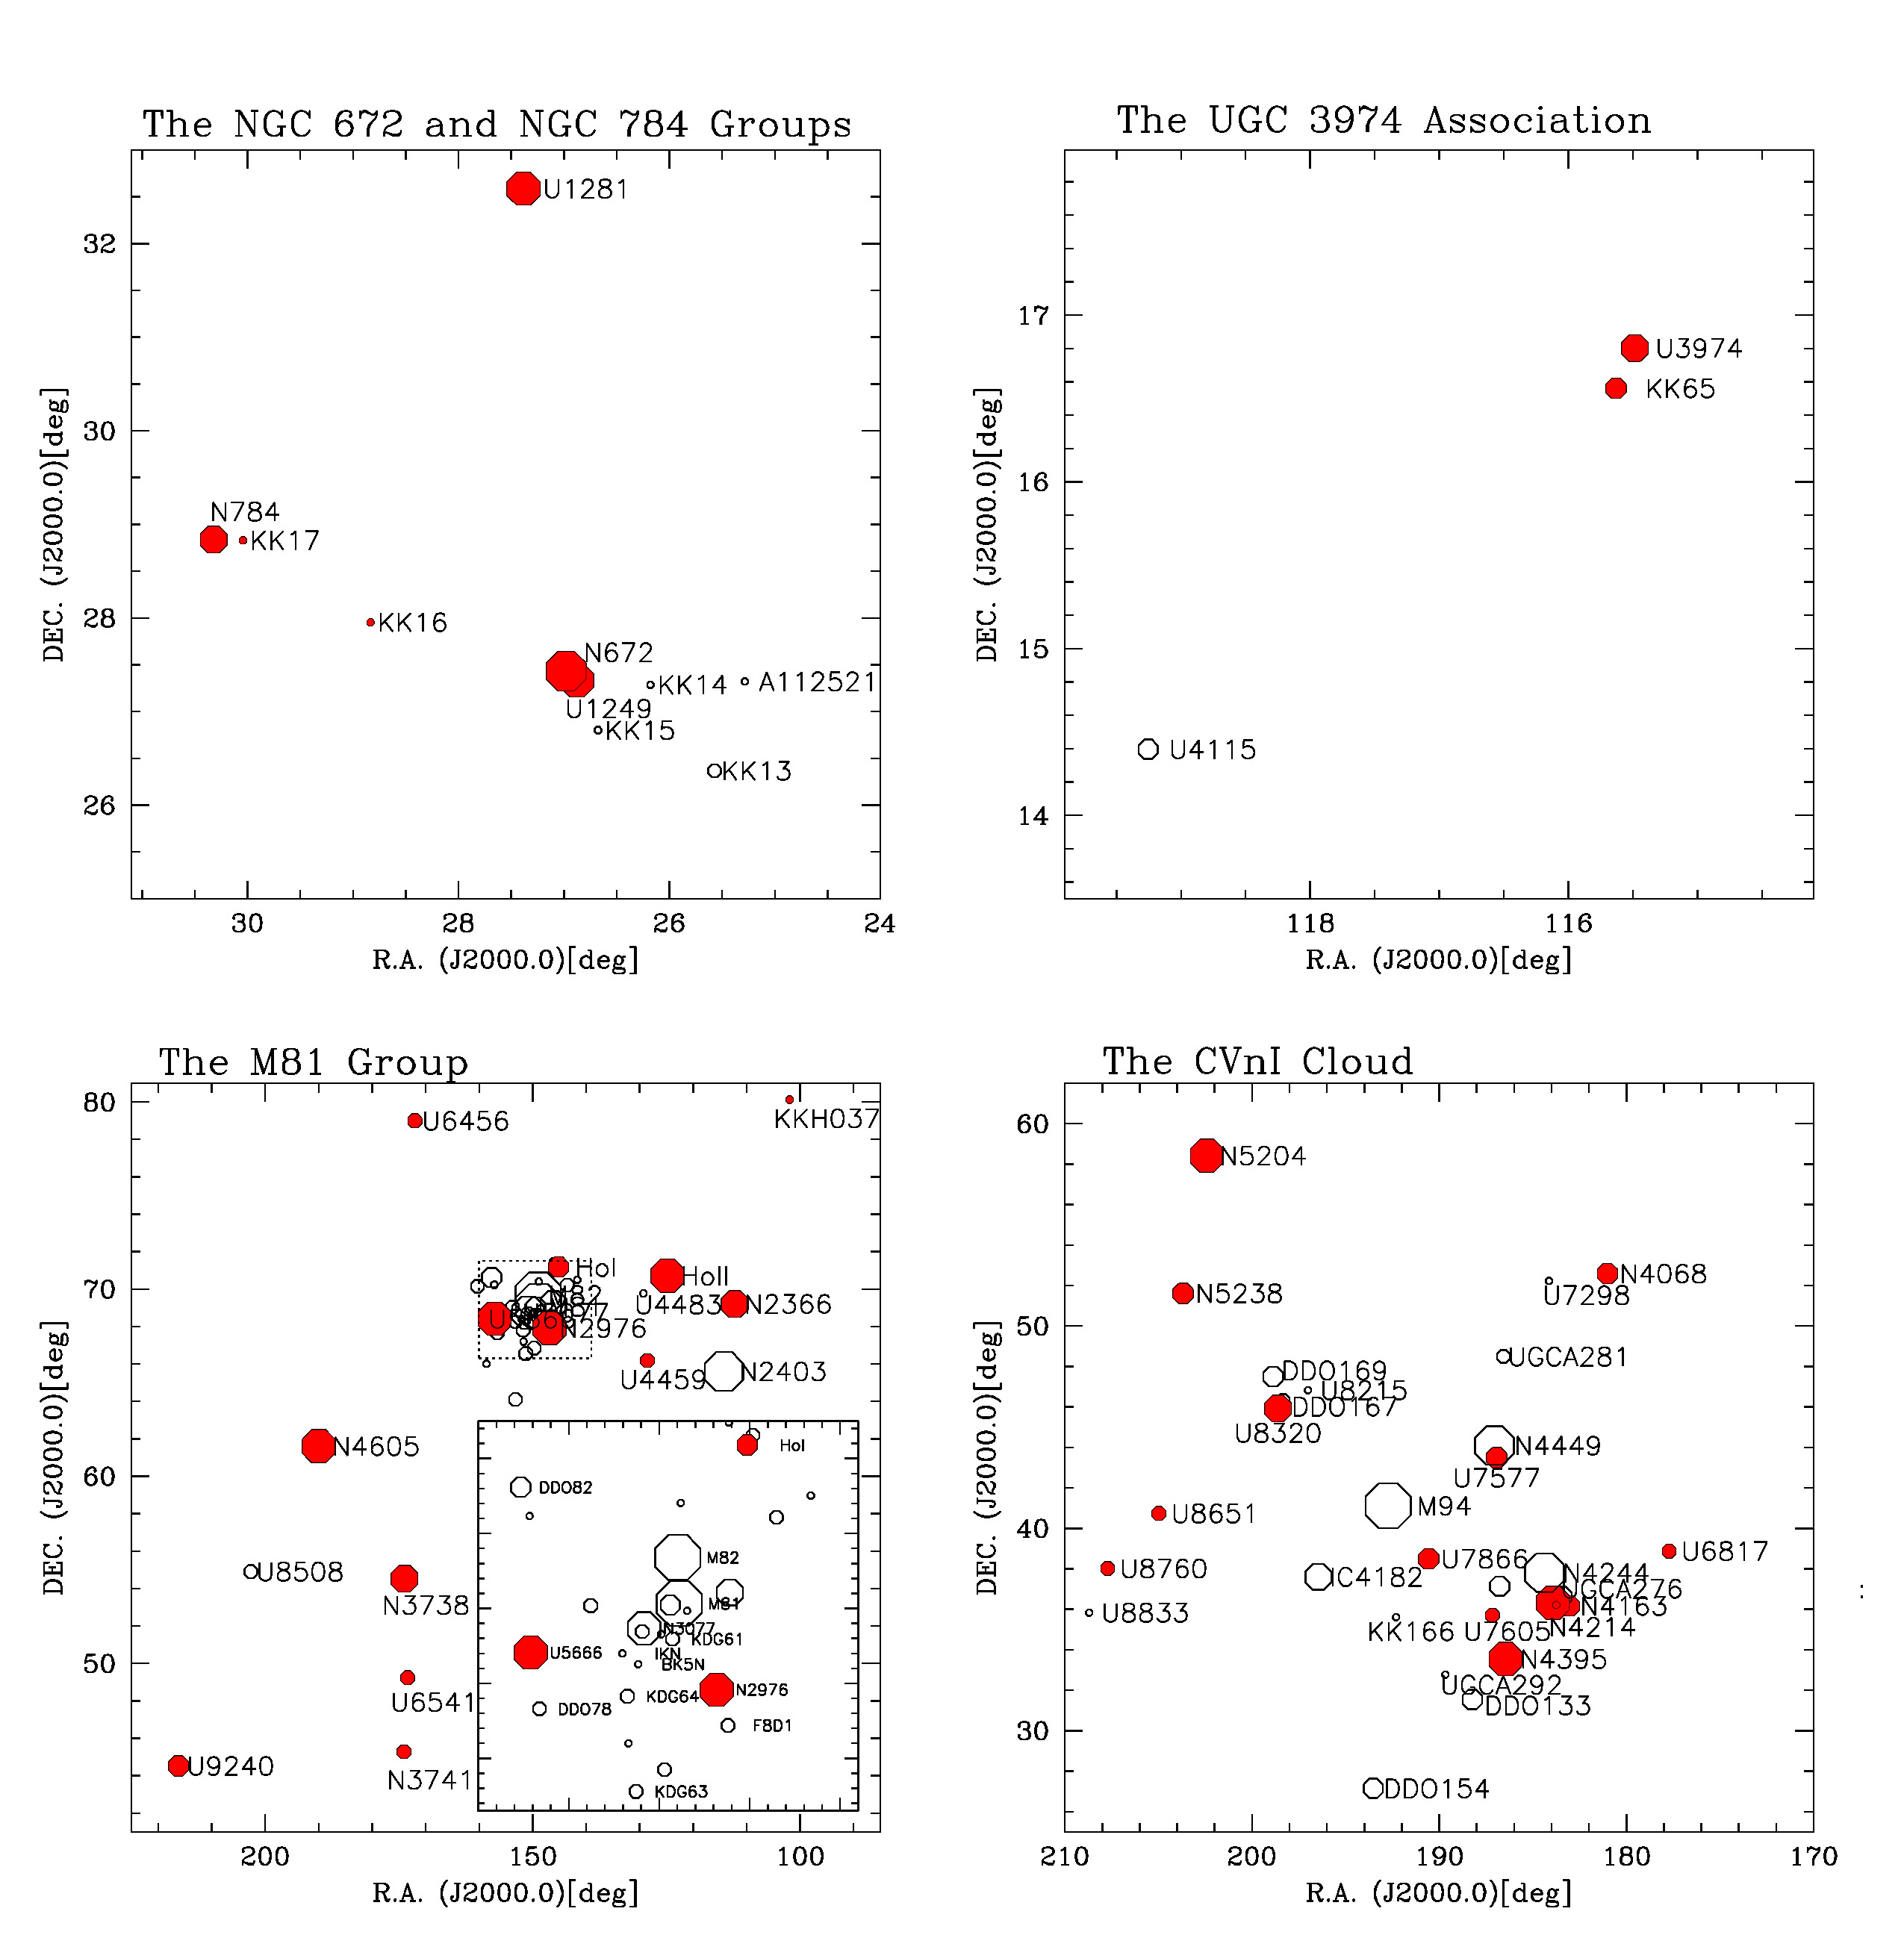
The properties of the sample in terms of absolute magnitude, linear size, distance, morphological type, and environment are presented in Figure 1. All the magnitude bins in the range are well populated [panel a) of Fig. 1], with the brightest galaxies reaching twice the luminosity of the LMC. The galaxy major diameters are in the range 1-18 kpc, with a peak in the distribution at 1 kpc. The majority of the SSH galaxies are located between 2 and 6 Mpc, with only one target as close as 1 Mpc and one as far as 10 Mpc (panel c). By construction, the morphological type T is 6 (late spirals and irregulars), with a predominance of T10 (Irr/Im) types. Finally, panels e) and f) show the distribution of the two tidal indices and defined by Karachentsev et al. (2013) (see Equations (1) and (2)) describing the environment density. By definition, the indices increase with the “stellar density contrast” (either produced by the main disturber, as in the case of , or due to the five most important neighbors, as in the case of ). The galaxies in the SSH sample span tidal indices in the range , meaning that both galaxies at the center of groups and galaxies in isolation are present. At the two extremes we find UGC 1249 (), which forms a group together with the spiral galaxy NGC 672 and other dwarfs, and the galaxy UGC 3755 ( and ), which resides in the Lynx-Cancer Void. The majority of galaxies in the SSH sample belong to, or are in the vicinity of, known groups or associations; more specifically, there are five SSH targets (UGC 1249, UGC 1281, KK 16, KK 17, and NGC 784) in the NGC 672/NGC 784 group (Karachentsev et al., 2004; McQuinn et al., 2014), thirteen (KKH 37, NGC 2366, UGC 4305, UGC 4459, UGC 5139, NGC 2976, UGC 5666, UGC 6456, UGC 6541, NGC 3738, NGC 3741, NGC 4605, UGC 9240) in the M81 group (e.g. Chiboucas et al., 2013), two (UGC 3974, KK 65) in the UGC 3974 association (Tully et al., 2006) and fourteen (NGC 4068, UGC 6817, NGC 4163, UGCA 276, NGC 4214, NGC 4395, UGC 7577, UGC 7605, UGC 7866, UGC 8320, NGC 5204, NGC 5238, UGC 8651, UGC 8760) in the Canes Venatici I Cloud (CVn I; Makarov et al., 2013). The spatial distribution of galaxies within these groups is shown in Fig. 2. Galaxies with large positive values of or are found toward the center of the groups, while galaxies with highly negative values are peripheral. In addition, our sample comprises the Pegasus Dwarf (UGC 12613), which is a satellite of M 31; NGC 5477, associated to the M 101 spiral galaxy; and UGC 7408 in the CVn II cloud. The remaining eight galaxies (UGC 685, UGC 3755, UGC 4426, UGC 8091, UGC 5456, NGC 6503, NGC 8638, NGC 6789) are fairly isolated.
4 Observations
We were approved a two-year Strategic Program (PI F. Annibali) for the LBT Italian Cycle 20162017 to observe the 45 dwarf galaxies listed in Table 1. Due to technical and environmental222Including the huge fire that burnt Mount Graham in June 2017 issues, only 25 of our targets were actually completed during the first two years; we were then approved a carry-over of our program for the years 2018-2019. As of September 2019, data acquisition for 40 targets has been completed.
The SSH targets were observed with the wide-field () Large Binocular Cameras, in binocular mode, in the SDSS g and r passbands. The g and r images were obtained with the LBC-Blue and LBC-Red camera, respectively. The optics of each LBC feed a mosaic of four 4608 px 2048 px CCDs, with a pixel scale of 0.225 arcsec px-1. Each CCD chip covers a field of . Chips 1, 2, and 3 flank one another, being adjacent along their long sides; chip 4 is placed transversely to this array, with its long side adjacent to the short sides of the other chips (see Giallongo et al., 2008).
For each target, the total exposure time of 1 hr in each band was organized into 3 visits of 150 s 8 dithered exposures or into 3 visits of 240 s 5 dithered exposures, with the shorter exposure configuration preferred in presence of bright foreground stars contaminating the field. A variable pointing offset between the visits, depending on the angular size of the target galaxy, was implemented to make the galaxy light fall into different regions of the LBC chips, allowing for an optimal flat-field correction.
We requested a seeing 0.8″for targets at distances D4 Mpc, and a seeing 1.2″for targets at larger distances. This difference reflects the distinct approaches (resolved star counts versus integrated light) selected for our search of faint companions, sub-structures, and stellar streams around the SSH dwarfs depending on their distances. More specifically, a seeing better than 0.8″is needed to resolve individual stars down to 1 mag below the TRGB in galaxies within D45 Mpc (depending also on the crowding). At larger distances, on the other hand, resolving individual RGB stars is no longer feasible from the ground in seeing limited mode, even in the least-crowded galaxy outskirts; therefore, we relaxed our constraint on the seeing, but required dark moon observation, in order to keep the background low and be able to detect integrated-light overdensities in the g and r images.
For each galaxy, the 1 hr total exposure time per band is dictated by the need to measure stars down to 1 mag below the TRGB at D4 Mpc with a signal-to-noise 5 in both and . At 4 Mpc, the TRGB tip is expected at r25.3, gr1 (for metal-poor populations), therefore we need to reach stars with , g. The same exposure time was adopted also for targets closer than 4 Mpc in order to reach the same uniform apparent depth for all the sample. The impact of crowding is mitigated by the fact that we are mainly interested in resolving stars in the very low surface brightness external galaxy regions. The same 1 hr exposure time was also adopted for the un-resolved part of the sample at D4 Mpc, since previous studies with the LBT (e.g. Annibali et al., 2016) have shown that this is sufficient to reveal integrated-light sub-structures as faint as mag/arcsec2 (or better, see Sect. 9.1).
The choice of the and bands provides the best compromise to: a) be able to reach old (1-2 Gyr) RGB stars, b) minimize, as far as possible, the contribution from the sky background, which becomes particularly important at wavelengths longer than the r band, and c) calibrate the LBT photometry through g and r catalogs available from the Sloan Digital Sky Survey and/or PS1. Short 60 sec 4 exposures in and were also obtained to get un-saturated photometry of bright foreground stars to be used to anchor the photometry to the SDSS system.
5 Image Reduction
Image reduction and creation of the final and stacked mosaics were performed using a specific pipeline developed at INAF-OAR. The main steps of the procedure are described below.
5.1 Pre-reduction
First, the raw LBC images were pre-reduced removing a master-bias and applying a master-flat to normalize the response of each image pixel. The master-bias was obtained from the median stack of a set of bias frames. The master-flat is the stack of a set of twilight sky-flats acquired with the same observational setup of the science images, to which the bias was previously subtracted; furthermore, each individual flat was normalized to its own median background level, so that the final stacked master-flat is normalized to unity. During pre-reduction, several image artifacts, such as saturated and hot/cold pixels, cosmic rays (quite frequent), and trails from orbiting satellites (rare) were also masked out.
5.2 Background Subtraction
Typically, after pre-reduction, the images are still far from being “flat”, and both small- and large-scale structures, such as pupil ghosts, dust, and sky-background variation during the observations, may still be present in the images. To cope with this, background maps were subtracted to the pre-reduced images. The SExtractor package (Bertin & Arnouts, 1996) allows to construct background maps using a combination of k--clipping and mode estimation to evaluate the local background in each mesh of a grid that covers the whole frame, and then performing an interpolation between the grid meshes. The resulting map crucially depends on the user-defined BACK_SIZE parameter, which defines the size of the mesh. In particular, if the mesh size is too small, roughly comparable to the source spatial extension, a background over-subtraction at the source edges may occur. The larger the source, the more dramatic the over-subtraction. On the other hand, if the mesh size is too large, the map will fail to reproduce the small-scale variations of the background. To deal with this difficulty, the following series of steps were implemented into the INAF-OAR pipeline: 1) first, SExtractor was run to detect sources and to create a mask where the detections are flagged-out; 2) the mask was then transformed into a “broadened” version, where the masked regions were “expanded” to flag-out residual flux potentially present around the sources; 3) bad pixels and artifacts were also masked out; 4) SExtractor was run again with a relatively small mesh size and with the flagged-pixel mask to create the background map. The small mesh size allows us to follow the small-scale background variation, while the relatively extended masked regions at the source positions prevent to over-subtract the background at the source edges.
5.3 Astrometric Solution
The individual images present geometric distortions due to various effects (optics distortions, atmospheric refraction, chip rotations); therefore, astrometric calibration is needed before co-adding the individual frames into a final stacked mosaic image. The astrometric calibration was accomplished through two separate steps: first, relative linear offsets between the individual exposures were derived through cross-matching of the source catalogs created by SExtractor with respect to a chosen reference frame; then, the absolute astrometric calibration was accomplished through cross-matching onto a reference absolute astrometric catalog, such as the United States Naval Observatory (USNO). The astrometric solution was derived and stored into the image header. Note that in the final stellar catalogues this solution will be re-adjusted using a dense grid of stars in common with PanSTARRS1 (PS1), see Sect. 6.1, below.
5.4 Noise and Image Co-addition
Noise maps were created from the individual images under the assumption that the noise follows the Poisson statistics of the counts measured in each pixel of the original frames. To evaluate the noise, the scaling factors applied to each pixel during processing (e.g. flat-fielding, exposure time normalization, etc.) were taken into account. More specifically, each noise map was computed according to the formula:
| (3) |
where denotes the chip number, is the computed noise at the (x,y) position, is the number of counts in the raw image, is the read-out-gain (2), and is the value of the flat image used in the pre-reduction.
The individual processed images were resampled according to the geometry described in a global header and finally they were combined into - and -band stacked images making use of the SWarp software (Bertin et al., 2002). The noise maps were used to derive the weights [] that enter in the weighted summation of all individual frames.
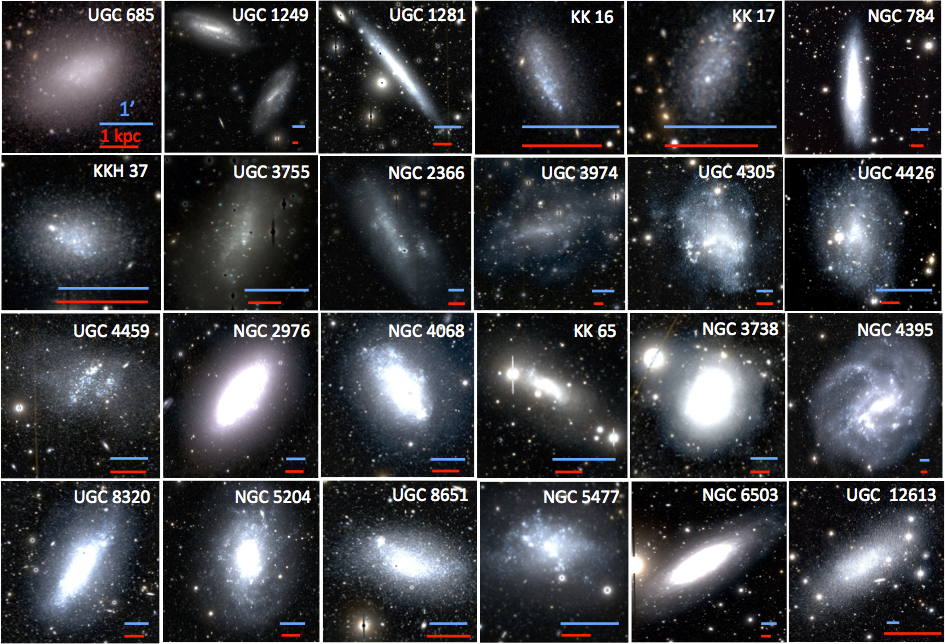
As of today, image reduction has been completed for 24 targets in the SSH sample. Portions of their LBC , color combined images are shown in Fig. 3.
6 Photometry
Photometry of individual sources was performed on stacked mosaic images using PSFEx (Bertin, 2011). In practice PSFEx produces a numeric model of the Point Spread Function (PSF) using the brightest isolated stars in each image. In the present case, the spatial variation of the PSF was modeled with a second order polynomial in the x and y image coordinates. Then the derived model is used by SExtractor to estimate PSF magnitudes by fitting the proper model PSF to each detected source, according to its position in the image.
The detection was made independently in both passbands, using rms images as weight maps. We used a mexhat filter and we considered as valid detections all the sources having a flux level larger than above the background in at least 3 adjacent pixels. Even if the sky was subtracted from our images, we required it to be estimated locally, over 24 px thick annuli around each source, to remove any possible local residual of the sky subtraction. The catalogues from the g and r images where matched and combined using the Catapack suite333http://davide2.bo.astro.it/ paolo/Main/CataPack.html, as done in Bellazzini et al. (2014, 2015). In our catalog we include the following parameters provided by SExtractor and PSFEx: an identification number, the position of the sources derived with the PSF fitting, both in image and world coordinates, aperture magnitudes over a diameter of and the associated uncertainties, MAG_BEST444see Bertin & Arnouts (1996) and http://astroa.physics.metu.edu.tr/MANUALS/sextractor/Guide2source_extractor.pdf for a detailed description of the meaning of this as well as other output parameters of Sextractor., as a reasonable magnitude estimate for extended sources, the PSF magnitudes and the associated uncertainties and value, the SExtractor quality flag and stellarity index, the axis ratio, the half-light radius and the maximum surface brightness in mag/arcsec2.
We remark that, while our catalog contains useful information on extended sources, the overall data reduction strategy has been optimized to get the best results and the most reliable photometry for point sources (stars).
6.1 Astrometric and photometric calibration.
The astrometric and photometric calibration procedure follows strictly Bellazzini et al. (2015), where a detailed description is provided. The only difference is that here we use catalogs extracted from PS1, instead of SDSS, to derive the photometric zero points and the final astrometric solution. We chose PS1 for homogeneity as all our targets are included in the PS1 footprint, while this is not the case for the SDSS. PS1 photometry is transformed into the SDSS photometric system using the equations provided by Tonry et al. (2012).
The original astrometry embedded in the images and transported into the original catalogs by SExtractor was transformed into the PS1 system with third order polynomials, using several hundreds of stars in common between our catalogs and the corresponding PS1 catalogs. In all cases, we carefully checked that the stars used to compute the transformation were distributed all over the LBC field. The typical rms of the solutions is in both directions.
The brightest well-measured stars in common were used to fit the photometric zero points, once color terms were removed from our instrumental magnitudes with Eq. A.1 of Bellazzini et al. (2015). The range of magnitude in which our deep photometry and PS1 photometry overlaps is limited on one side by saturation and on the other side by large photometric errors near the PS1 limiting magnitude, respectively. For this reason, the uncertainty on the zero points may amount to magnitudes (see Bellazzini et al., 2015), the zero point in the r band being the most uncertain of the two. However, in all the cases, the CMD from the original PS1 matches very well the CMD from our calibrated photometry.
In the following we will use final catalogues in which are only sources having valid PSF magnitudes in both passbands, and we will refer to PSF magnitudes, if not otherwise stated.
6.2 Selection Cuts
In order to remove spurious detections from the final photometric catalogs, we applied selection cuts using some of the SExtractor output quantities. In the first place, we performed a selection based on the flag parameter, which provides a record of all possible problems encountered during the photometry (see Holwerda, 2005). In particular, flag=1 indicates the presence of bright nearby neighbours that may have affected the source photometry, flag=2 indicates that the source was originally blended to another object, and higher flag values denote the presence of saturated pixels, truncated objects, and corrupted or incomplete output data or combination of these problems. Retaining all sources with flag=0 provides the most conservative and cleanest selection of well-measured, individual sources, and we adopted this selection for the closest galaxies in our sample, at D5 Mpc, where we expect to resolve (depending also on the seeing and on the stellar crowding) individual stars down to the RGB level. On the other hand, we relaxed our constraints for more distant galaxies and selected all sources with flag=0,1,2 in order to at least retain bright young stars, located in regions of active star formation and typically blended to other sources. This is the only kind of selection that was applied to targets at D5 Mpc in our sample.
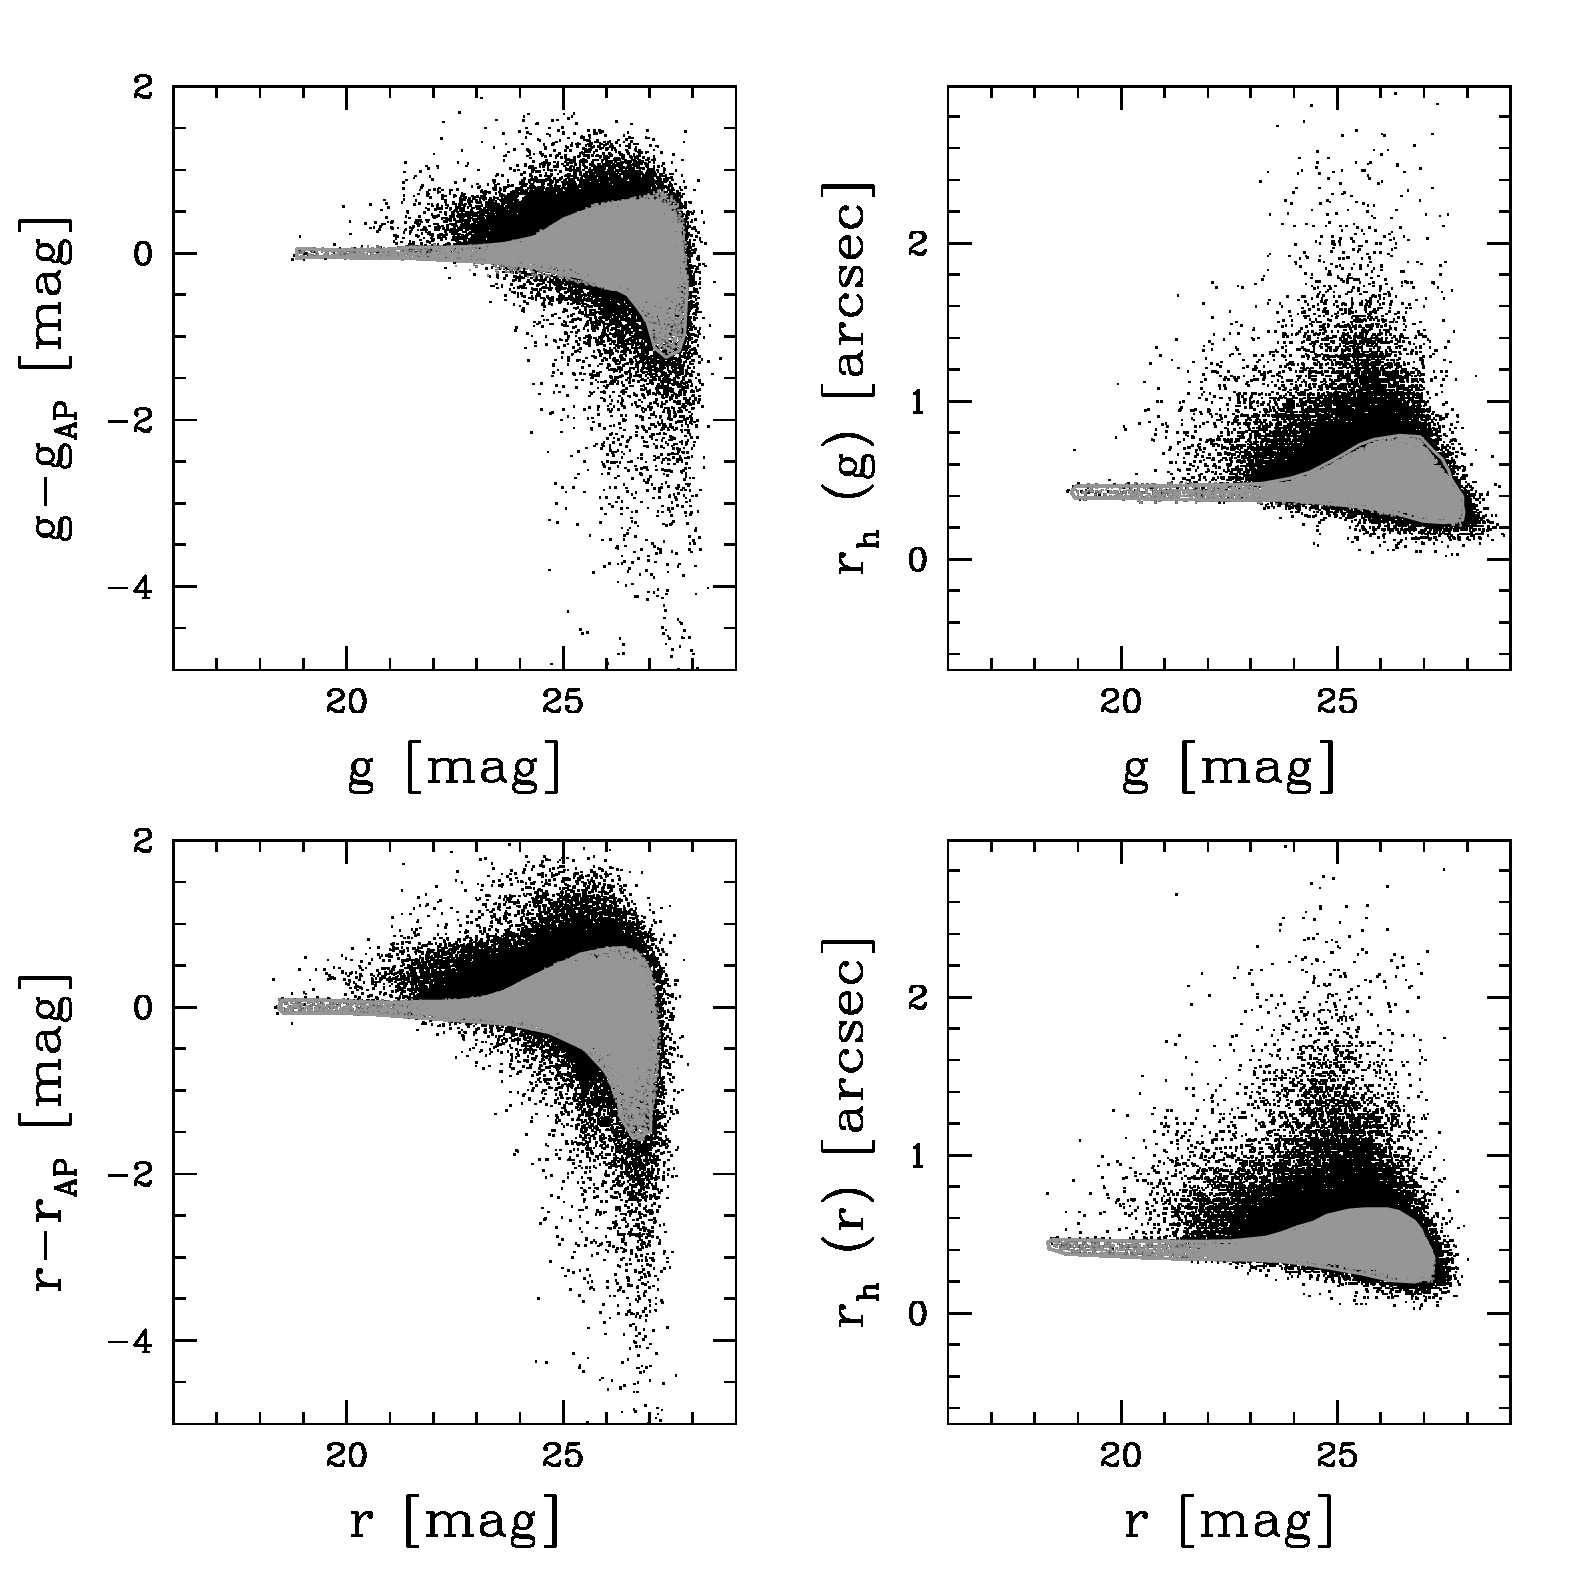
For targets at D5 Mpc, further selection cuts on parameters related to the source’s size were applied to remove extended background galaxies from the catalogs; an exploration of all possible combinations of the SExtractor output parameters indicates that selections on the distributions of the PSF-fitting minus aperture magnitudes (, ) or of the half-light radius () provide the most effective removal of extended sources. As an illustrative example, we show in Fig. 4 the selection adopted for UGC 12613 (Pegasus dwarf galaxy). The left panels exhibit the distribution of versus and versus for all objects with flag()=0; the distribution resembles that of the sharpness versus magnitude typically obtained from other widely-used PSF-fitting photometric packages (e.g. Daophot, Stetson, 1987). At bright magnitudes, the distribution peaks around zero, as expected for point-like sources. An additional broad peak at , 0.2 is visible as well; the presence of this feature is due extended objects (background galaxies, stellar clusters, blends of two or more stars), for which the PSF does not provide a good description of the profile and thus underestimates the source flux. At the opposite extreme, toward faint magnitudes, low , values indicate sizes smaller than the PSF, likely associated to cosmic rays or detector’s artifacts. Following these considerations, we adopted the selections provided by the grey shaded area in the left panels of Fig. 4. The other SExtractor parameter that turns out useful to separate stars from background galaxies is the half-light radius , whose distribution as a function of magnitude in both bands is shown in the right panels of Fig. 4. Extended objects removed on the basis of the PSF minus aperture magnitude distributions exhibit also large values of . A selection in the vs. and vs. planes, as shown in the right panels of Fig. 4, allows for a refined removal of the extended sources that were not captured by the previous selections.
7 Color-Magnitude Diagrams
To analyse which kinds of populations have been resolved by our photometry, we plotted the CMDs of all the SSH fields and compared them with theoretical isochrones. In several cases, the CMD of the total field of view is heavily contaminated by foreground Milky Way stars (specially if the target is at low Galactic latitudes), either disc or halo ones, and by background galaxies. For this reason, the CMDs of more internal galactic regions are often more informative on the evolutionary properties of the target galaxy than the global ones. We have also checked if the CMD evolutionary sequences show trends with galacto-centric distance (i.e., gradients) or with other position parameters (i.e., signs of perturbations).
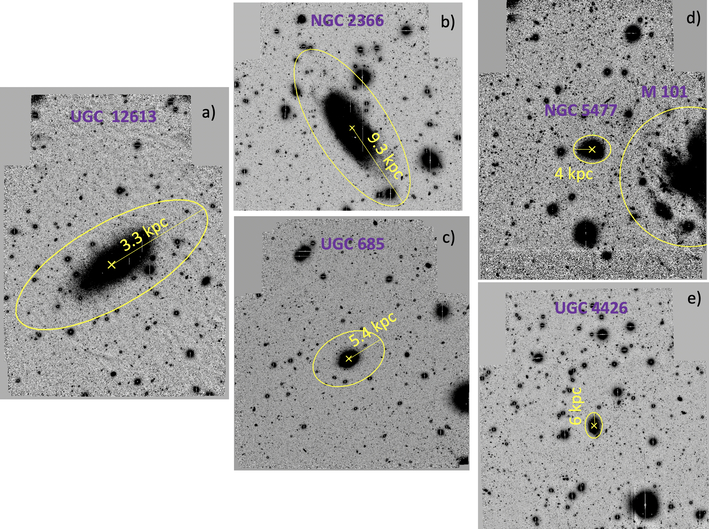
We consider it useful to illustrate the kind of CMDs that we obtain with SSH, and the corresponding analyses, in this survey presentation paper. We thus show the CMDs for a few representative cases in the SSH survey: UGC 12613, NGC 2366, UGC 685, NGC 5477, and UGC 4426, located at distances of 1, 3.2, 4.7, 6.8, and 10.3 Mpc, respectively (see Fig. 5). In particular, UGC 12613, and UGC 4426 are the closest and the most distant galaxy in our sample, respectively. These five illustrative examples provide a direct grasp of our ability in resolving individual stars as a function of galaxy distance. Previous studies have demonstrated that individual RGB stars can be resolved from the ground in the least crowded galaxy outskirts up to distances of 4-5 Mpc, provided that the seeing is as good as 0.8″(e.g Bernard et al., 2012; Okamoto et al., 2015; Crnojević et al., 2016). The CMDs obtained from our analysis confirm these results, showing that RGB stars, tracing the underlying old (1-2 Gyr) stellar population, are reached up to targets at D5 Mpc, while only brighter stellar phases (young main sequence stars, blue and red supergiants, asymptotic giant branch stars) are accessible at larger distances.
A detailed description of the CMDs for all five targets follows below.
7.1 UGC 12613
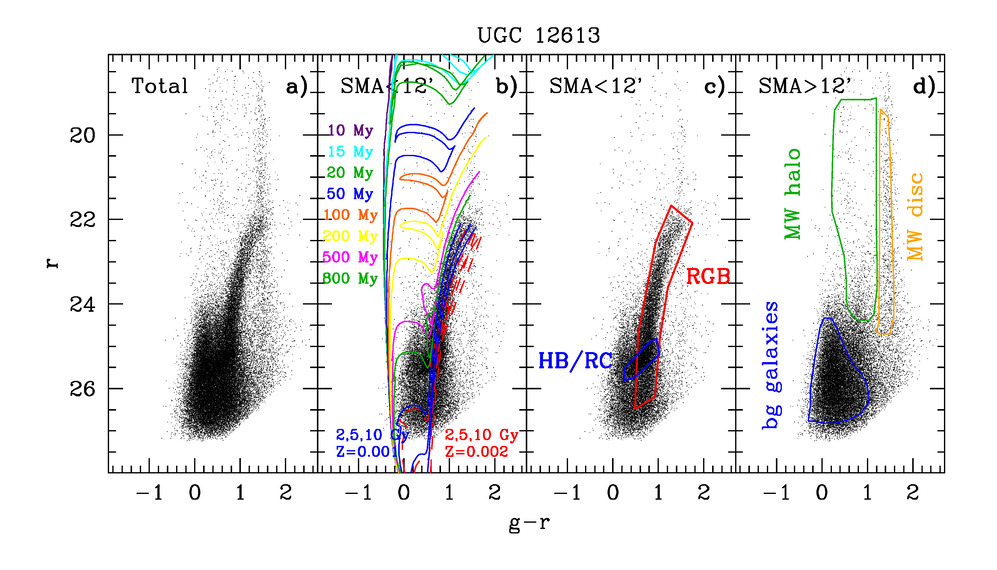
UGC 12613 (also known as the Pegasus dwarf irregular galaxy), at a distance of D=0.97 Mpc (Jacobs et al., 2009), is the closest target in our sample. Its final CMD, obtained after application of the selection cuts described in Section 6.2, is shown in Fig. 6. There we display both the total CMD (panel a) obtained from all sources detected in the LBC field of view, and two selections respectively for sources within an elliptical contour with ellipticity , major axis position angle PA (see Section 9 below) and semi-major axis (SMA) = (panels b and c)555Here we denote as SMA the elliptical radius as defined in Bellazzini et al. (2011)., as indicated in Fig. 5, and for sources outside that region (panel d).
The external field at SMA provides a representation of the foreground and background contamination affecting our CMD of UGC 12613: as discussed in details by Bellazzini et al. (2014), the narrow vertical feature at is due to the population of local M dwarf stars, while the sparse band of stars extending from , to , is made of main sequence stars at different distances in the MW halo. On the other hand, the triangle-shaped clump of objects at , is due to unresolved background galaxies. The presence of these contaminants must be taken into account when discussing the CMD of the internal field.
The CMD of UGC 12613 at SMA exhibits a well defined and narrow ( mag) red giant branch, extending from , down to , , populated by stars older than 1 Gyr, and the fainter sequence of the red clump (RC) or horizontal branch (HB) at , , corresponding to low-mass core helium burning stars, from a few Gyr to 13 Gyr old. Younger stars are scarse in the CMD, likely because confined to the most internal galaxy regions where severe crowding hampers their detection. In panel b) of Fig. 6, the PARSEC stellar isochrones (Bressan et al., 2012) have been superimposed to the observed CMD adopting a distance of D=0.97 Mpc ((m-M)0=24.93) from Jacobs et al. (2009) and correcting for a foreground reddening of E(B-V)=0.06 (Schlafly & Finkbeiner, 2011). Internal reddening can be neglected here, given that dust extinction is found to be modest in low metallicity galaxies and typically confined to regions of active star formation (see e.g. Draine et al., 2007; Madden et al., 2013); indeed our photometry is strongly incomplete toward the most central, star-forming regions, and the vast majority of detected RGB or RC/HB stars reside in external, close to dust-free, galaxy zones. The displayed models cover a wide age range from 10 Myr to 10 Gyr, and have a metallicity of Z=0.002, consistent with the metallicity measured in UGC 12613’ s H II regions (12+log(O/H)=7.90.1-0.2, i.e. 1/7 solar, Skillman et al., 1997). However, it is immediately clear that these models predict too red RGBs, indicating that the stars older than 12 Gyr are more metal poor than the present-day interstellar medium. Indeed, models as metal poor as Z=0.001 (1/16 solar metallicity), displayed in Fig. 6 provide a more satisfactory fit to the RGB colors.
There has been some debate in the literature about the distance of the Pegasus dwarf irregular (e.g., Aparicio, 1994; Gallagher et al., 1998), with the most recent estimates providing values in the range 0.91.2 Mpc (McConnachie et al., 2005; Pietrzyński et al., 2010; McCall et al., 2012; Tully et al., 2013; McQuinn et al., 2017). Our dataset provides the most reliable detection of the RGB tip so far, thanks to the large number of measured stars, from which we derive a distance modulus of , or D=0.97 Mpc, compatible with the quoted range.
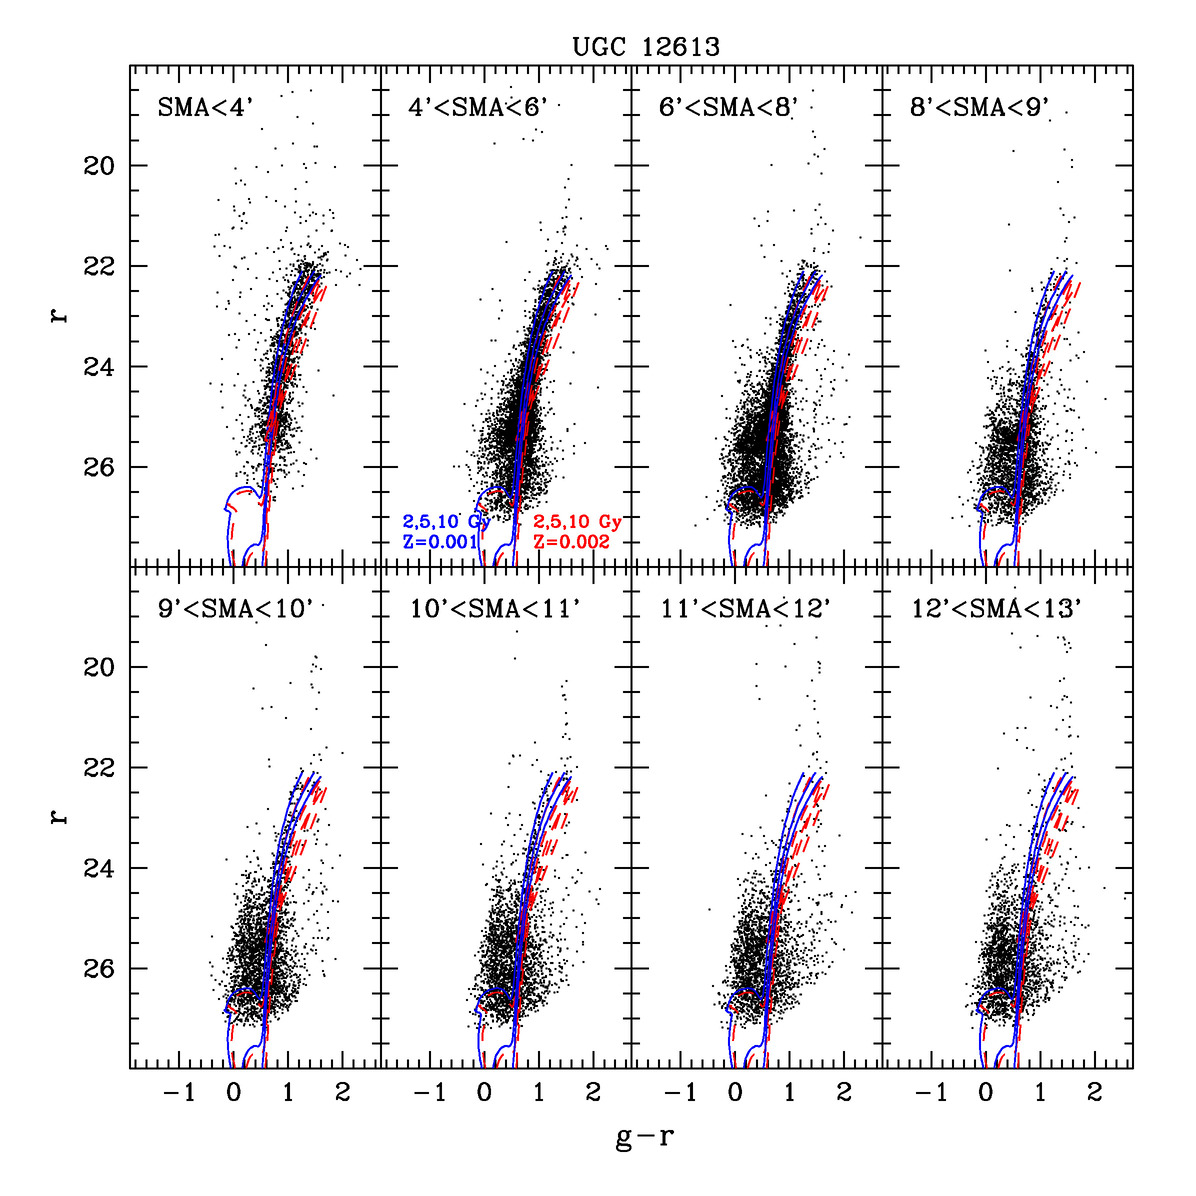
The behaviour of the stellar populations in UGC 12613 as a function of galacto-centric distance is illustrated in Fig. 7, where we plot the CMDs for stars selected in elliptical annuli of increasing semi-major axes (SMA). Overplotted to the observed CMDs are the PARSEC stellar isochrones for ages2 Gyr, and for the Z=0.001 and Z=0.002 metallicities. Stars younger than 1 Gyr are only detected within the internal SMA region (1.2 kpc), although we caution that some of these sources may in fact be unresolved blends of two or more individual stars or compact star clusters. The RGB and HB/RC populations due to the galaxy can be recognized in the CMDs out to SMA (3 kpc), while at larger radii it is only possible to recognize in the CMD the contribution due to background galaxies and MW stars. No significant metallicity variation with increasing galacto-centric distance is observed in the CMDs, and the RGB colors are overall compatible with a Z=0.001 metallicity.
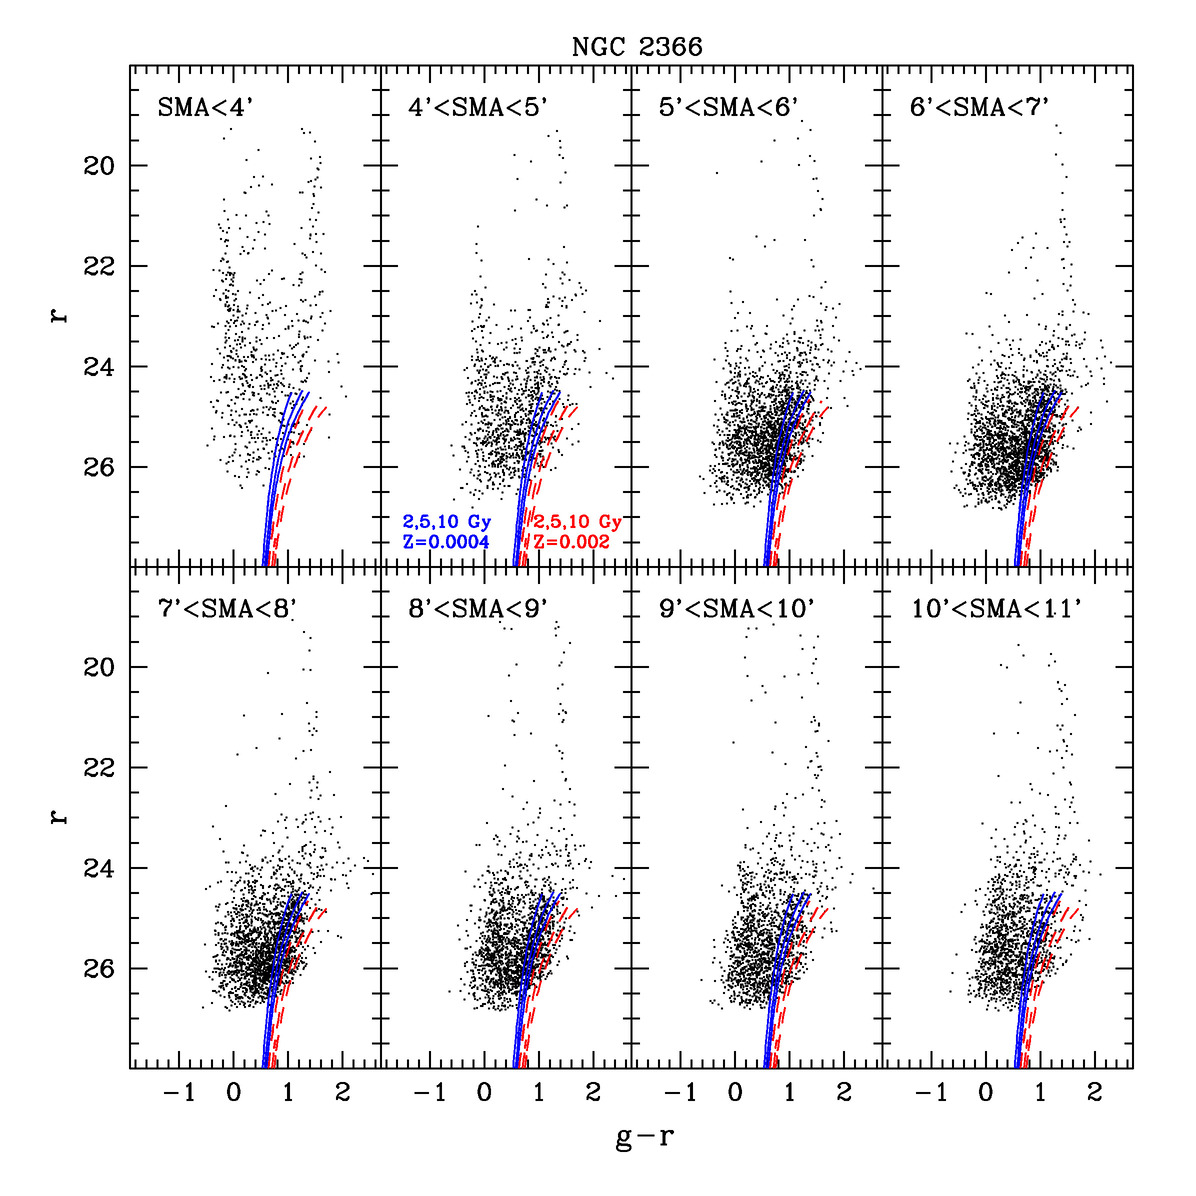
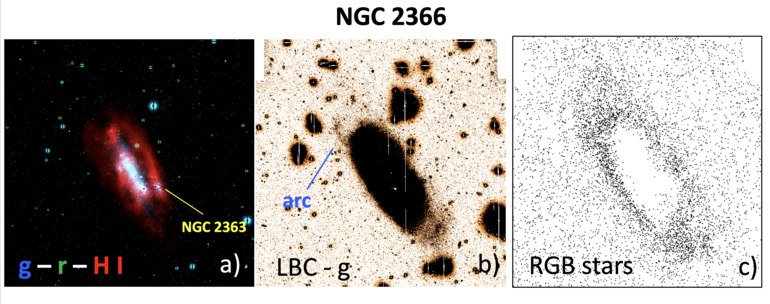
7.2 NGC 2366
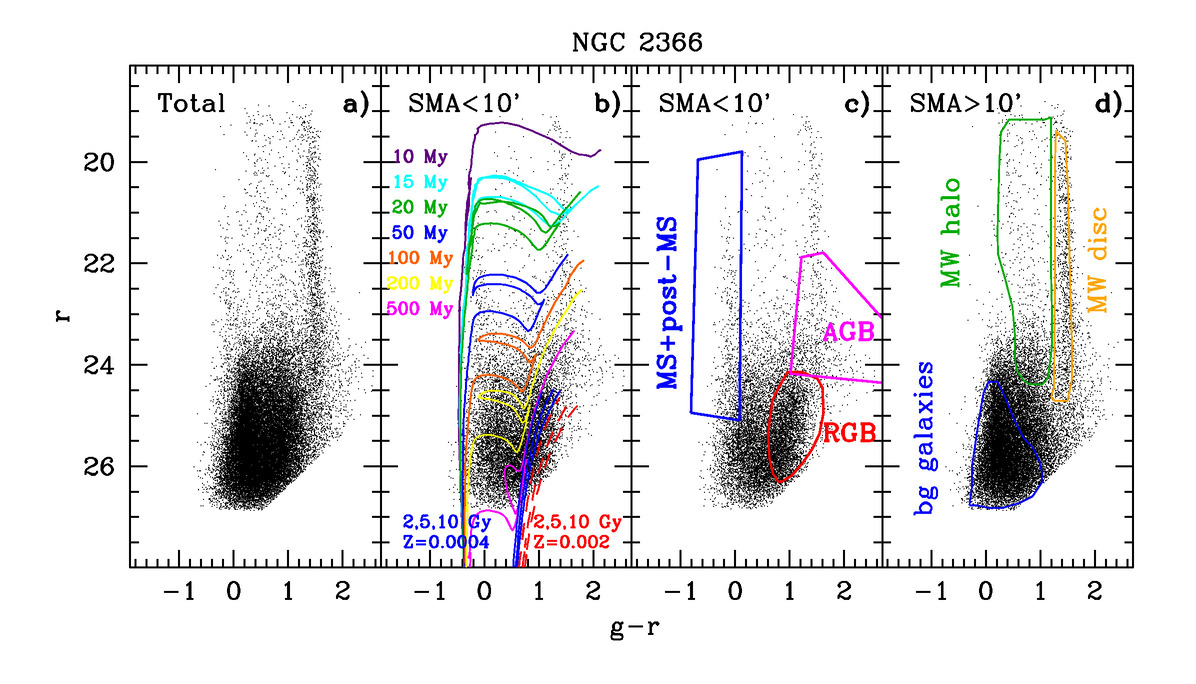
The LBT/LBC image of NGC 2366, at a distance of D=3.2 Mpc, is shown in panel b) of Fig. 5, while its , CMD is displayed in Fig. 8. As for the case of UGC 12613, we show both the total CMD, obtained from all sources photometred in the LBC field of view, and two separate CMDs corresponding to sources located inside and outside an elliptical region of semi-major axis (SMA) = 10′. Stellar evolutionary features associated to the dwarf galaxy are not identified in the external field CMD, which mostly samples foreground MW stars and unresolved background galaxies, and looks exactly like that in the outer field of view around UGC 12613 (Fig. 6).
On the other hand, we recognize in the CMD at SMA10′ the typical evolutionary sequences associated to young, intermediate-age, and old stellar populations. For an easier visualization, the main stellar evolution phases have been indicated in panel c) of Fig. 8, while the PARSEC isochrones, shifted to a distance of D=3.2 Mpc [(m-M)0=27.5] and corrected for a foreground reddening of E(B-V)=0.03, have been superimposed on the observed CMD in panel b). The plotted isochrones have ages from 10 Myr to 10 Gyr and metallicity Z=0.002, consistent with the 1/8 solar metallicity derived in the giant H II region complex Mrk 71 (i.e., 12 + log(O/H)7.98.0; Izotov et al., 1997; Noeske et al., 2000; James et al., 2016). The vertical blue plume at , encloses stars younger than 200 Myr both in the main-sequence (MS) phase and at the hot edge of the core helium burning - blue loop - phase (post-MS). The red vertical plume at , is populated by young red supergiants (RSGs) at the brighter magnitudes, and by intermediate-age asymptotic giant branch (AGB) stars at fainter luminosities, although contamination from foreground MW stars can be significant here. Sources of intermediate colours, , and fainter than , are consistent with blue-loops of intermediate-mass stars, with ages from 500 Myr to 100 Myr, but a major contamination from background galaxies occurs in this region of the CMD. Finally, the concentration of stars at , is the RGB of low-mass, old (age1-2 Gyr) stars. This RGB is shallower and much broader in color than that observed in the closer Pegasus dwarf, reaching only down to 1.5 mag below the tip. This prevents a robust constraint on the stellar metallicity, although it is reasonable to exclude from panel b) of Fig. 8 a metallicity as high as Z=0.002.
In order to characterize the spatial behaviour of the resolved stars in NGC 2366, we displayed in Fig. 9 the CMDs for stars selected in elliptical annuli of increasing semi-major axes. RGB stars can be identified in the CMDs out to SMA10′(9.3 kpc), while at larger galacto-centric distances we only recognize features due to MW foreground stars and background galaxies. The lack of RGB stars in the internal SMA5′region is not real, but is due to the severe crowding hampering the detection of faint stars. On the other hand, the young population is concentrated toward the internal galaxy regions, with stars younger than 50 Myr confined within SMA4′. This result is consistent with what is typically found for dIrrs and BCDs (see, e.g., Tosi et al., 2001; Annibali et al., 2013; Cignoni et al., 2013; Sacchi et al., 2016). We also notice that the Z=0.002 models, while providing a satisfactory agreement with the CMD of the young population, are always redder than the bulk of the observed RGB stars. This suggests that stars older than 12 Gyr are significantly metal-poorer than Z=0.002. In particular, a metallicity as low as Z=0.0004 (1/40 solar) appears consistent with both the RGB color and slope. We are thus witnessing the presence of an age-metallicity relation in NGC 2366, as usually found in galaxies, but not an evident metallicity gradient in stars older than 1-2 Gyr.
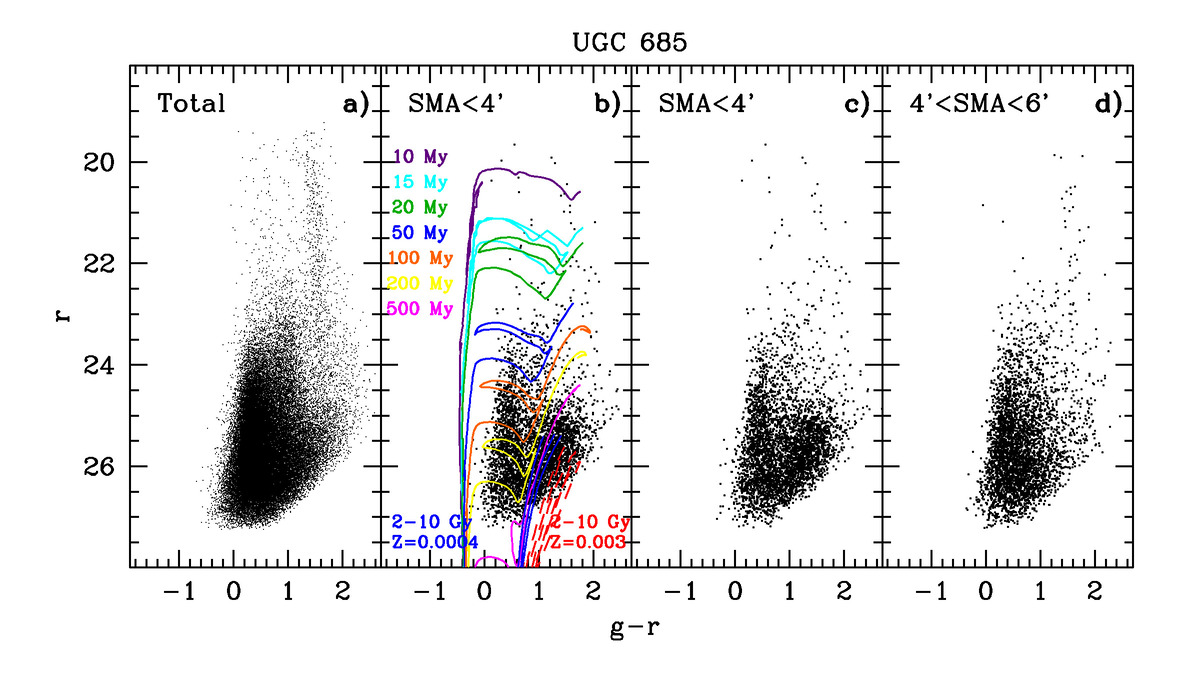
7.3 UGC 685
The LBC image of UGC 685, at a distance D=4.7 Mpc, is displayed in panel c) of Fig. 5, while its CMD is shown in Fig. 10. This galaxy lies at the largest distance where we expect to resolve individual RGB stars from the ground in seeing-limited mode, and indeed the detection of the RGB on the displayed total CMDs in panel a) may be challenging. Nevertheless, panel b) and c) of Fig. 10, showing the CMD within an elliptical region of SMA=4′(5.4 kpc), demonstrate that the RGB is detected in this case, thanks to a seeing as good as 0.7″. The detection appears quite convincing once we compare the internal CMD with an adjacent external field at 4′SMA6′containing approximately the same number of stars: from the comparison of panel c) and d), one can immediately see that a concentration of stars at r 25, , compatible with the locus of the RGB models, is present in the internal field but not in the external adjacent region, and thus belongs to the galaxy.
We also notice that no young blue stars are present in the CMD of UGC 685, likely because severely blended to other sources and therefore removed by our selection criteria. From HST CMDs it is however evident that a young population is present in the innermost regions of this galaxy (Sabbi et al., 2018). Cignoni et al. (2019) derived its SFH through UV data from the HST Treasury program LEGUS (Legacy Extra-Galactic UV Survey, Calzetti et al., 2015) and showed that the galaxy has been quite actively forming stars during the last 200 Myr.
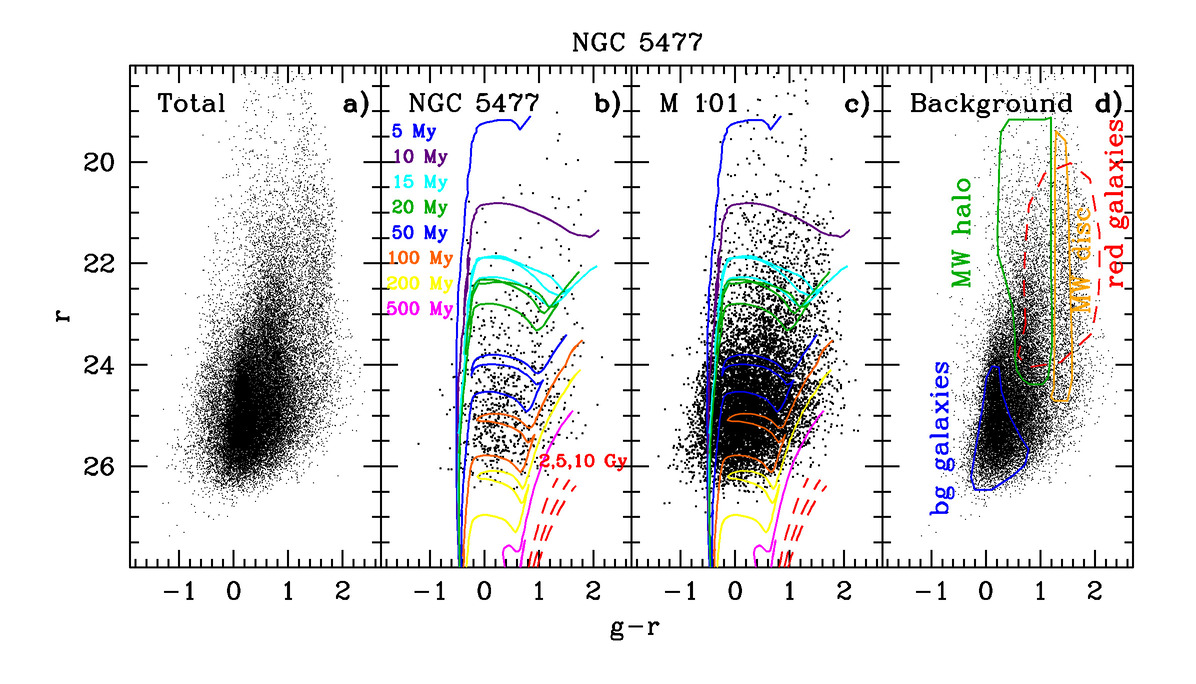
7.4 NGC 5477
NGC 5477, at a distance of D=6.8 Mpc and fairly close to M101, is shown in panel d) of Fig. 5, while its CMD is displayed in Fig. 11. The CMD, as explained in section 6.2, results from less stringent selection cuts than in the case of UGC 12613, NGC 2366 and UGC 685, since the photometry was shallower, because of poorer seeing conditions (, and we are in a situation where severe crowding prevents to resolve individual stars; therefore we accept to retain bright sources even if blended to other objects. Blends of two or more stars can still be useful to trace the galaxy stellar population.
We notice that in the total CMD displayed in panel a), the MW disk sequence appears less defined than in Figs. 6,8,10; this is due to the contamination from bright and extended red sequence galaxies, efficiently removed in the previous examples by the selections in , and , but retained in the photometric catalog of NGC 5477. Panel b) and c) of Fig. 11 show the CMDs for two regions centered on NGC 5477 and on M 101, according to the elliptical contours displayed in Fig. 5. A comparison with stellar isochrones shifted to the galaxies’ distance shows that we are far from reaching the RGB, with the tip expected at r26; on the other hand, both CMDs show a population of blue plume stars (MS and post-MS stars) at , , with ages 50 Myr. The presence of these stars in the photometric catalog is particularly striking once the total CMD in panel a) is compared with the CMD in panel d) obtained from all sources outside the regions including NGC 5477 and M 101.
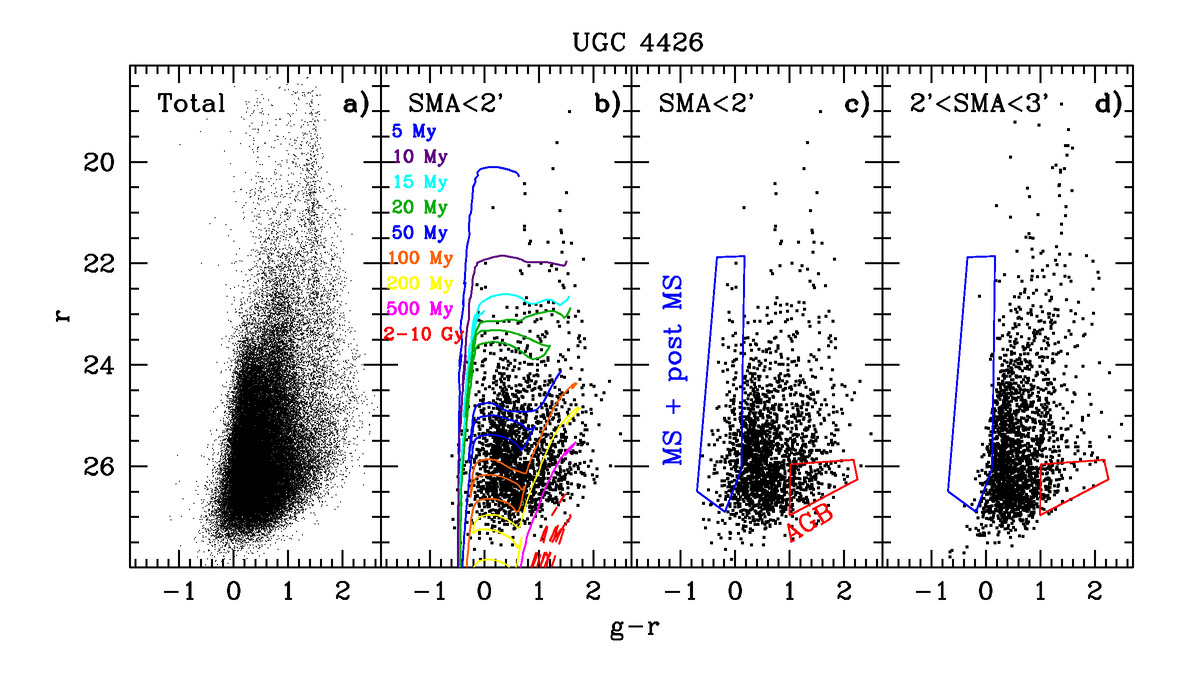
7.5 UGC 4426
UGC 4426, at D=10.3, is the most distant target in our sample. Its LBC image is shown in panel e) of Fig. 5, and its CMD in Fig. 12. The total CMD in panel a) is dominated by background galaxies and MW stars, and no noticeable feature associated to UGC 4426 is visible. Panels b) and c) display the CMD for an elliptical region of SMA2′centered on UGC 4426, while panel d) displays the CMD for an adjacent outer field at 2′SMA3′containing approximately the same number of stars as the internal field. Stellar isochrones, superimposed to the CMD in panel b), show that the RGB tip is expected at r27, about 1 mag below the faintest stars resolved with our photometry. A comparison between panel c) and d) reveals in UGC 4426 an excess of blue stars at , compared to the background field; these objects fall in the locus of young (age100 Myr) blue MS and post-MS stars. There is also a concentration of red stars at , consistent with AGB stars with ages500 Myr, but we can not exclude that these objects are blends of fainter RGB stars.
8 Stellar Density Maps
The CMDs presented in section 7 provide a powerful diagnostic to separate stars belonging to the target galaxies from background and foreground contaminants. This technique has been extensively used in the literature to identify low surface brightness stellar streams, satellites, and extended stellar halos in galaxies within the Local Group and beyond (e.g., Belokurov et al., 2006; Bernard et al., 2012; Bonaca et al., 2012; Beccari et al., 2014; Greggio et al., 2014; Ibata et al., 2014; Martin et al., 2014; Roderick et al., 2015; Belokurov & Koposov, 2016; Crnojević et al., 2016; Higgs et al., 2016; Mackey et al., 2016; Tanaka et al., 2017; McConnachie et al., 2018; Pucha et al., 2019). This approach allows to typically reach much fainter surface brightness structures than from the integrated light, down to values as low as 31-35 mag arcsec-2, depending on the faintest evolutionary phase sampled by the CMD.
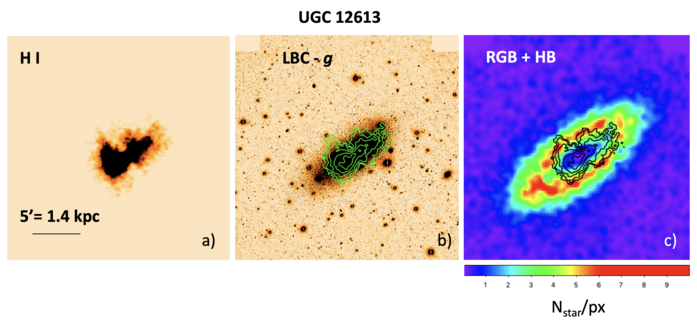
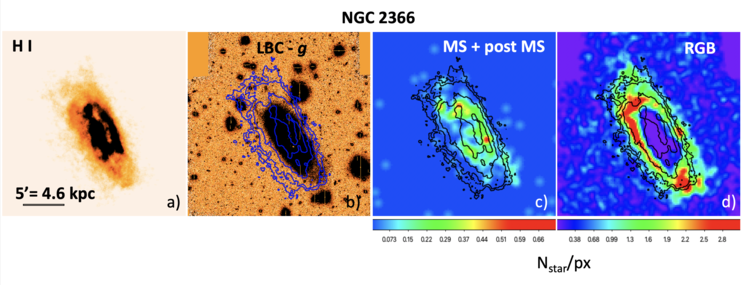
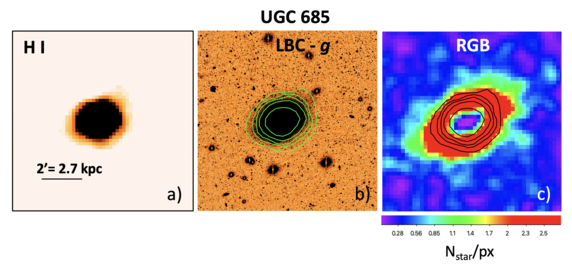
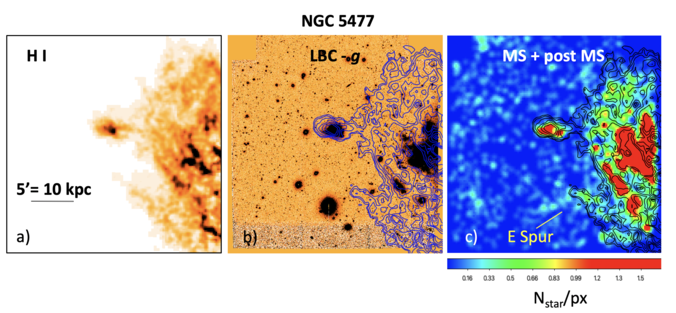
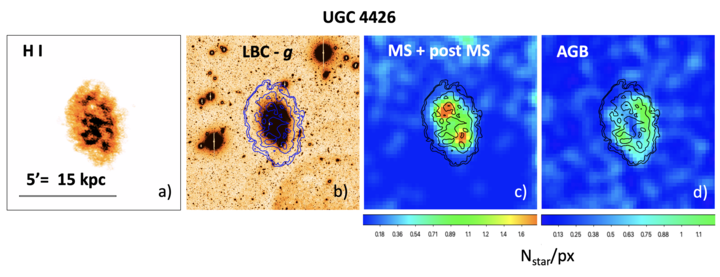
In Figs. 13 through 17 we present stellar density maps for UGC 12613, NGC 2366, UGC 685, NGC 5477, and UGC 4426. The maps are based on RGB and HB/RC stars down to r26 for UGC 12613, and on RGB stars down to r26.3 and r26.5 for NGC 2366 and UGC 685, respectively, corresponding to limits of 2 mag and 1.5 mag below the RGB tip. The density maps of NGC 5477 and UGC 4426 were instead constructed from evolutionary phases younger than the HB/RC or RGB, since the galaxies’ distances prevent to reach even the latter. For NGC 5477, the stellar density map traces blue MS and post-MS stars, with ages100 Myr. For UGC 4426, the photometry is quite deeper than usual (reaching down to r27) and allowed us to use, besides blue MS and post-MS stars, also AGB stars at magnitudes just brighter than the expected RGB tip location, with ages500 Myr. The displayed maps provide the density of truly observed star counts, not corrected for incompleteness; as a consequence, the maps of RGB and HB/RC stars exhibit a “hole” in the central, more crowded galaxy regions, due to loss of stars counts in the increasingly unresolved stellar background. On the other hand, incompleteness is less important in the external galaxy regions, allowing us to trace the outer low surface brightness component.
The stellar maps were compared with H I data from different sources: the Local Irregulars That Trace Luminosity Extremes, The H I Nearby Galaxy Survey (LITTLE THINGS, Hunter et al., 2012) for UGC 12613, NGC 2366, and UGC 4426; the Westerbork observations of neutral Hydrogen in Irregular and SPiral galaxies (WHISP, Swaters et al., 2002) for NGC 5477; and the Faint Irregular Galaxies GMRT Survey (FIGGS, Begum et al., 2008; Roychowdhury et al., 2009) for UGC 685. For the LITTLE THINGS data, we adopted the naturally weighted total intensity maps 666https://science.nrao.edu/science/surveys/littlethings/data, that are more sensitive to large scale structures than the robust weighted maps. The WHISP data at a 30″30″resolution were obtained from the ASTRON http://wow.astron.nl web site. The high sensitivity, low resolution () FIGGS data of UGC 685 were kindly provided to us by S. Roychowdhury (see also Roychowdhury et al., 2009, for higher resolution data of this galaxy). For each galaxy, we show the H I emission image and the H I contours superimposed both to the LBC image and to the stellar density maps. To produce H I contours in units of M⊙/pc2, we used Eq.(3) of Iorio et al. (2017).
Figs. 13, 14 and 15 show that, whenever the CMD is deep enough to sample RGB or HB/RC stars, the old (age1-2 Gyr) stellar population appears extended at least as much as the H I gas, and possibly even more; the case of UGC 12613 is extreme in this sense, with the old stellar component, detected down to a surface brightness limit of 31 mag arcsec-2 (see section 9), extending in projection as far as twice the faintest H I contour at 0.4 M⊙ pc-2 (see also McConnachie et al., 2007; Kniazev et al., 2009). Here the difference between the star count and the H I extensions is striking, and we investigated whether it could be due to a limited sensitivity of the LITTLE THINGS, high resolution H I data: a comparison of the H I contours displayed in Fig. 13 with higher sensitivity VLA H I data from Young et al. (2003) and with very deep Arecibo Legacy Fast ALFA extragalactic H I survey (ALFALFA) data (Giovanelli et al., 2005; Kniazev et al., 2009) reveals comparable H I extensions, indicating that the neutral gas is indeed much less extended than the stellar component.
Young stars are observed to be less extended than the old stellar component and than the H I; this is well shown in the stellar maps obtained for NGC 2366 in Fig. 14, where stars younger than 200 Myr are more centrally concentrated than the old stellar component, and do not reach as far as the H I extension. This is a typical behavior of the stellar populations in star-forming dwarfs, where the youngest stellar populations preferentially clump toward the most central galaxy regions, while old stars are homogeneously distributed and extend out to large galacto-centric distances (see Tolstoy, Hill, & Tosi, 2009, for a review).
In Figs. 16 and 17, the density maps for NGC 5477 and UGC 4426 provide partial knowledge of the existing stellar populations, since the CMD is far from reaching the locus of old RGB stars. Nevertheless, it is possible to gather some information from the distribution of young blue MS and post MS stars and of intermediate-age AGB stars. The density map for the dwarf NGC 5477 and for a portion of the spiral M 101 in Fig. 16 was derived from stars at 2126, , with ages100 Myr (see Fig. 11). Young star counts trace quite well the H I distribution. For M 101, we recover the E spur, a low surface brightness feature extending from M 101 to East, previously identified by Mihos et al. (2013) from deep optical images; this stellar feature spatially corresponds to a similar morphology feature observed in the H I. The H I emission map also shows a “bridge” connecting NGC 5477 to M 101, however this has no visible counterpart in our stellar density map.
As for UGC 4426, we provide in Fig. 17 maps both for the young (age100 Myr) stellar component and for an older population composed of AGB stars with age500 Myr plus possible blends of older RGB stars (see the regions outlined on the CMD of Fig. 12 for the adopted selection). A comparison of the stellar density maps with the -LBC and H I emission images indicates that, while young stars agree with the galaxy extension outlined by the optical image, the older AGB component extends further away, reaching out to the faintest H I contour at 0.5 M⊙/pc2. This indicates that, even for the most distant targets where individual RGB stars can not be resolved from the ground, stellar photometry is a valuable tool for tracing the galaxy stellar population down to fainter surface brightness sensitivities than allowed by the integrated light.
9 Surface Brightness Profiles
Integrated light profiles in and were derived through the ellipse task in IRAF, which is based on the iterative method described by Jedrzejewski (1987). The light intensity as a function of the semi-major axis (SMA) was computed as the mean flux within concentric elliptical annuli of fixed ellipticity () and position angle (PA), where the ellipse parameters were derived iteratively by fitting isophotes to the galaxy image in the band. Bright foreground stars and obvious bright background galaxies were masked out; however, to account for the remaining fainter population of background galaxies, we subtracted to the derived profile a constant background level computed as the average surface brightness in the external regions where the profile flattens out. The final errors were calculated by summing the intensity uncertainty provided by the ellipse task and the standard deviation of the background in quadrature. As an example, we show in Fig. 18 the band profile computed for UGC 12613 in elliptical annuli with ellipticity and major axis position angle PA; we consider the integrated-light profile robust out to SMA, while we observe very large errors, mainly due to the dominant effect of the background uncertainty, at larger distances.
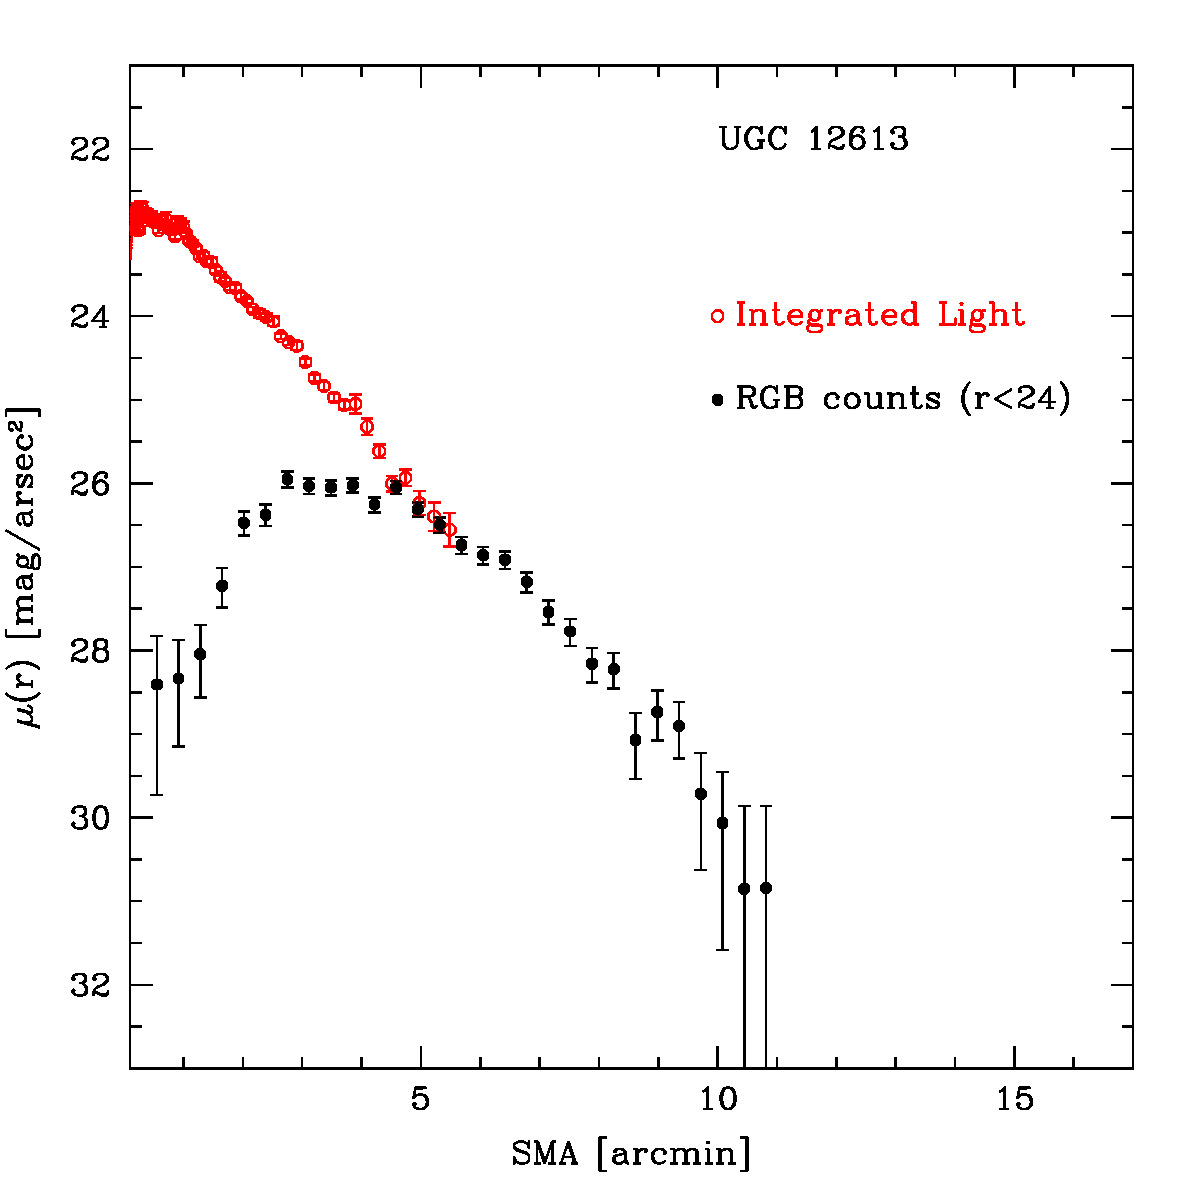
Resolved star counts allow us to reach much outer galaxy regions than the integrated light; for UGC 12613, for instance, the stellar density map displayed in Fig. 13 shows that stars are observed out to SMA12′(3 kpc at the galaxy’s distance of 0.97 Mpc). RGB stars trace the distribution of the stellar populations older than 1-2 Gyr, and are typically considered good tracers of the stellar mass (see e.g. Ryś et al., 2011). In Fig. 18, we show the RGB count profile computed for UGC 12613, after having applied a vertical shift to match the integrated light profile at 4.5′SMA6′where the two profiles overlap with the same slope. To calculate the profile, we selected RGB stars brighter than in order to minimize incompleteness effects toward the most central, crowded galaxy regions. Indeed, the CMDs displayed in Fig. 7 for annuli of increasing galacto-centric distances show that the UGC 12613 photometry reaches down to r27 at SMA4′, and therefore it is reasonable to assume a 100% completeness for counts brighter than at these galacto-centric distances. On the other hand, the RGB counts are highly incomplete within the internal SMA4′region, which causes a flattening and drop of the profile toward the galaxy center. The star count profile displayed in Fig. 18 was background-subtracted; in fact, to account for the contamination from unresolved background galaxies to the RGB counts, we subtracted to the profile a constant level computed from the counts at SMA12′, where the stellar density map shows no significant signal from the galaxy stellar population.
The combined integrated light/ RGB count profile indicates that we reach a surface brightness sensitivity at least as faint as 31 mag arcsec-2 for UGC 12613; indeed, fainter HB/RC stars may allow for even deeper surface brightness limits in the most external regions. In subsequent papers where we will present a dedicated study of the surface brightness profiles for the galaxies in the SSH sample.
9.1 Sensitivity for unresolved structures: the example of an extreme UDG
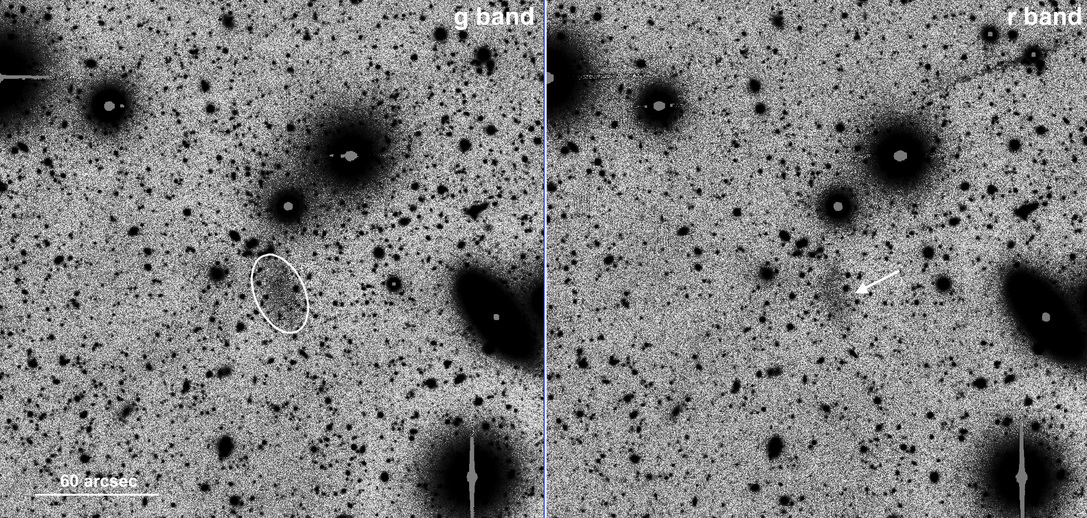
Our deep wide field images capture several interesting objects lying in the background of our target galaxies, like, e.g., interacting galaxies, galaxy clusters and groups, low surface brightness (SB) galaxies etc. Here we briefly report on the serendipitous discovery of a very low SB galaxy, an Ultra Diffuse Galaxy (UDG, see van Dokkum et al., 2015a; Koda et al., 2015), in the background of UGC 1281, as it may serve as an example of the sensitivity of the survey to low SB structures not resolved into stars.
Zoomed images in g and r bands of the newly discovered galaxy, that we dub SSH-UDG 1 (hereafter UDG 1, for brevity), are shown in Fig. 19. The system appears as a slightly irregular and fuzzy, elongated light cloud at the center of the images.
| quantity | value | units |
|---|---|---|
| RA | 27.46218 | deg |
| Dec | +32.62831 | deg |
| 11.3a | arcsec | |
| E(B-V) | 0.039 | mag |
| mag | ||
| mag | ||
| mag |
-
•
All the magnitudes are corrected for reddening.
-
•
The subscript denotes integrated magnitudes, corrected for extinction.
-
•
a Average of the fits to the r and g band profiles.
-
•
b Obtained using the transformations by Lupton (2005)777http://www.sdss3.org/dr9/algorithms/sdssUBVRITransform.php#Lupton2005.
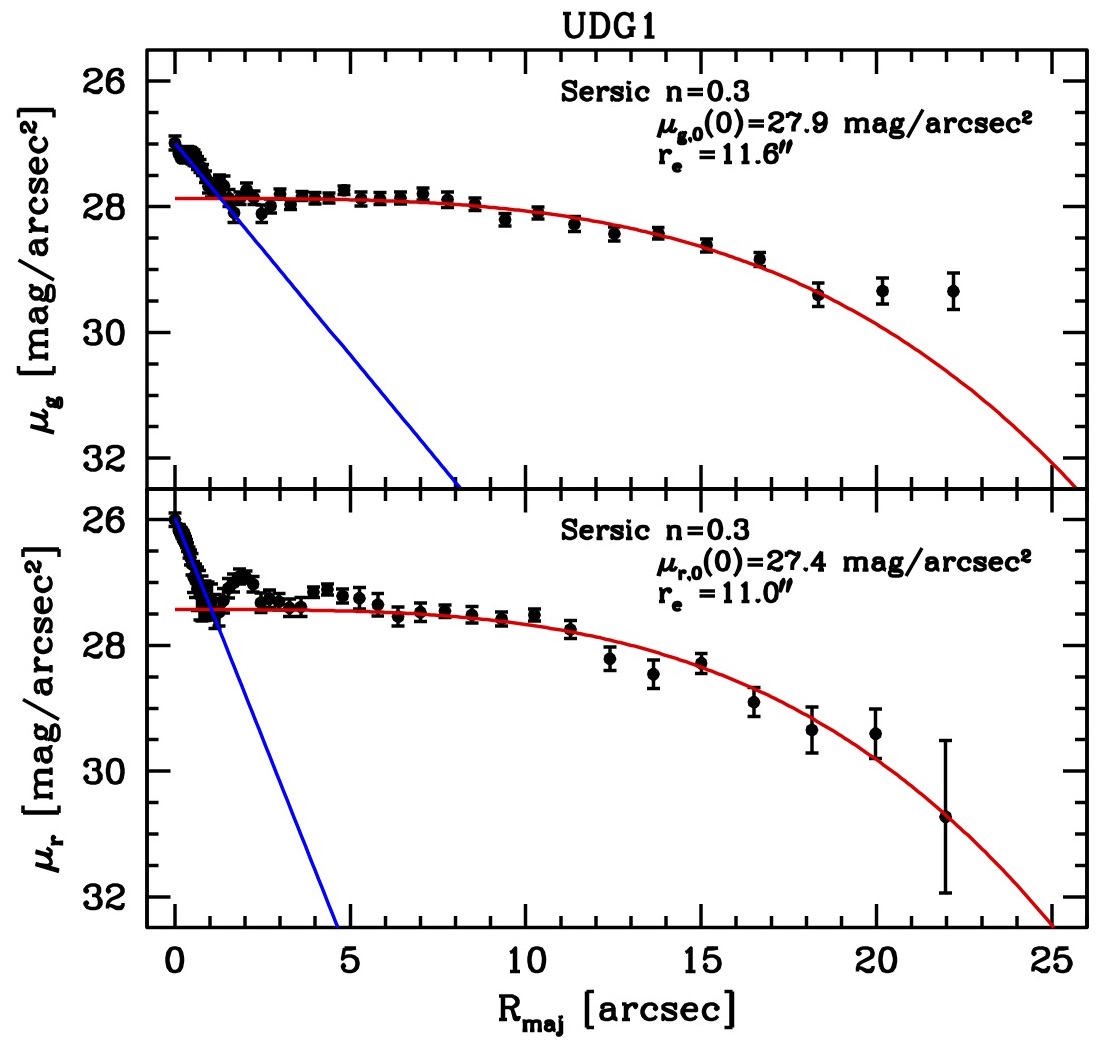
We used Galfit (Peng et al., 2002) to estimate the position of the center, the axis ratio () and the position angle (PA). Then, assuming these values, we derived the SB profile in both passbands with IRAF/ellipse. The two profiles are shown in Fig. 20 while the main properties of the system are listed in Tab. 2. The main body of the galaxy is well fitted by a Sérsic (1968) profile with Sérsic index lower than unity (n=0.3), as typical for UDGs (Koda et al., 2015), and an extremely low central surface brightness ( mag/arcsec2 in both bands). A central cusp, fitted with an exponential profile in Fig. 20, suggests the possible presence of a central stellar nucleus, that is not unusual in this kind of galaxies (Koda et al., 2015). The integrated color is typical of blue UDGs, that are more frequently found in low density environments (e.g., field, groups Roman & Trujillo, 2017; Bellazzini et al., 2017). Fig. 20 shows that we are able to reach a surface brightness as faint as mag/arcsec2 not only by star counts in the outskirts of (relatively) nearby galaxies, as shown above, but also tracing diffuse unresolved light in more distant systems.
UDG 1 is projected unto a substructure of many tens of galaxies with , likely associated with the UGC 1306 group. Since UDGs are preferentially found in clusters and groups of galaxies, it is worth considering the hypothesis that also UDG 1 is a member of this group. Tully et al. (2013) provide an estimate of the distance to UGC 1306 itself of Mpc, using the Tully-Fisher relation. Adopting the same distance for UDG 1 we would obtain and kpc. On the other hand, if we assume the redshift of the likely group member that is the nearest, in projection, to UDG 1 (2MASXI J0149427+323730, z=0.038361, according to SIMBAD888http://simbad.u-strasbg.fr/simbad/), and km s-1 Mpc-1, we obtain D=153 Mpc. At this distance UDG 1 would have and kpc. In any case UDG 1 appears as extremely diffuse. Its central (and effective) surface brightness and Sérsic index are at the lower limit of the distribution of known UDGs (Koda et al., 2015). Its discovery, just by visual inspection of the images, clearly illustrates the high sensitivity of the SSH images to very low SB galaxies and sub-structures.
Due to its low surface brightness, UDG 1 remains undetected in existing all-sky or large-scale public surveys that cover its field of view (such as the Sloan Digital Sky Survey, the All Wide-field Infrared Survey Explorer program, and the Canada-France-Hawaii Telescope MegaCam Legacy survey), which are much shallower than SSH.
10 Discussion
The stellar density maps derived from RGB and HB/RC counts for UGC 12613, NGC 2366 and UGC 685 in Figs 13, 14, and 15 provide evidence for extended low surface brightness stellar envelopes around the three dwarf galaxies, reaching as far out as, or even beyond, the observed H I disk. These extended envelopes consist of stars at least 12 Gyr old, while young stars are found to be confined toward the innermost galaxy regions, a typical behavior observed in star-forming dwarfs (see Tolstoy, Hill, & Tosi, 2009, for a review).
From a theoretical point of view, the disruption of smaller merging galaxies onto a more massive host has been proposed as a possible mechanism for the origin of extended stellar envelopes. According to Peñarrubia et al. (2006), the emergence of extended exponential discs is a generic feature of the disruption of satellites on coplanar orbits. Some simulations show that minor merger events are typically responsible for depositing stellar mass in the galaxy outskirts, whereas relatively massive satellites tend to deposit their stars further inside the host galaxy (e.g. Amorisco, 2017). According to Karademir et al. (2019), mini-mergers, with mass ratios lower than 1:10, can lead to an increase of the disc size, depending also on the infall direction of the satellite relative to the host disc, without significantly disturbing the center. These mechanisms offer a possible explanation for the extended low surface brightness stellar components observed in the SSH dwarfs.
The presence of an extended stellar envelope is particularly striking in the case of UGC 12613 (Pegasus dwarf irregular) where the deep LBT data allow us to trace a low surface brightness (31 mag arcsec-2) population of old RGB and RC/HB stars extending out to 6 times the galaxy half light radius (, McConnachie, 2012), and largely beyond the observed H I disk. McConnachie et al. (2007) noticed a “cometary” appearance of the H I as opposed to a regular, elliptical distribution of the stars in Pegasus, and proposed ram pressure stripping as a possible explanation.
In the case of NGC 2366, support in favor of a merging event comes from the comparison between the H I emission and the starlight distribution in the innermost regions. In fact, the grH I color-combined image displayed in panel a) of Fig. 21 highlights the presence of two ridges of H I running parallel to the semi-major axis that if de-projected appear as a large ring (Hunter et al., 2001); the H I ring connects the central star forming regions of NGC 2366 with the supergiant H II complex NGC 2363, providing hints that NGC 2363 is a gas-rich satellite being accreted by NGC 2366 (see also Drissen et al., 2000). This scenario is further supported by H I kinematics: NGC 2366 has an extended regularly-rotating H I disk, however a strong kinematic distortion is detected to the North-West (Oh et al., 2008; Lelli et al., 2014b; Iorio et al., 2017), and a steep velocity gradient is observed at the position of NGC 2363, suggesting that the NGC 2363/NGC 2366 system is an on-going minor merger (Lelli et al., 2014b). On our deep LBC image, a stellar arc-like feature is identified 5 kpc away from the galaxy center (panel b)). Then, faint RGB stars in panel c) trace a low surface-brightness component extending beyond structures visible in the optical image, toward the North-East direction and along the semi-major axis of the NGC 2366 disc; this faint component appears itself structured into arc-like features (see panel d) of Fig. 14 and panel c) of Fig.21). We speculate that this extended stellar envelope may have been produced by the accretion of NGC 2363 or of other satellites and a dynamical analysis of the system is currently ongoing.
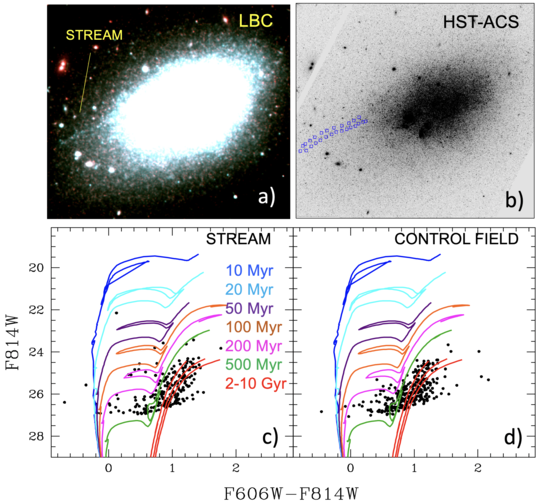
Further interesting features that are worth discussing because potentially associated to interaction, merging, or accretion events are observed for UGC 685 and NGC 5477. Panel a) of Fig. 22 displays our deep LBC image of UGC 685 highlighting a thin “stream” of stars running parallel to the galaxy major axis. The stream falls into the field of view of HST ACS data from the LEGUS survey (Calzetti et al., 2015) and is resolved into individual stars there (panel b) of Fig. 22). Its recent SFH from the UV data from the LEGUS survey has been derived by Cignoni et al. (2019). In order to get insights into its stellar populations, we inspected F606WF814W vs. F814W CMDs constructed from the photometric catalog of Sabbi et al. (2018), selected for a region containing the stream-like feature and for an adjacent control-field. The derived CMDs are displayed in panels c) and d) of Fig. 22, and indicate that both fields are dominated by a population of old (1-2 Gyr) RGB stars; however, we recognize in the stream a sizeable population of younger blue loop stars with ages of 100 -200 Myr, not present in the control field. We tested the robustness of this result by checking the absence of this younger population in other similar control-fields, not finding any. We also visually inspected the appearance of these objects on the HST images to exclude that they could be in fact background galaxies, star clusters, or blends of two or more stars.
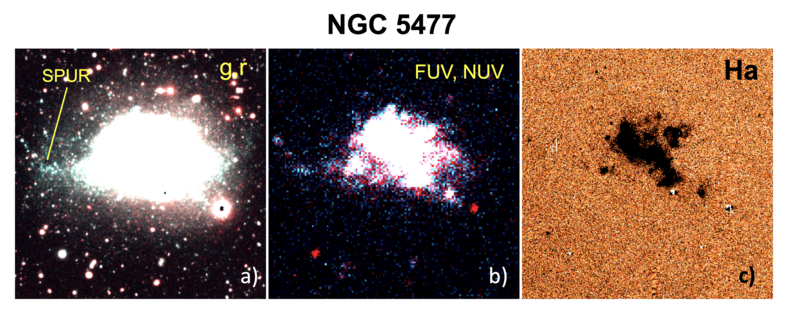
Finally, we show in panel a) of Fig. 23 our deep LBC , color-combined image of NGC 5477, where we observe a “spur” of blue stars departing from the galaxy and extending toward East. The spur is well visible also in GALEX images (panel b)), with rather blue FUVNUV colors compared to the galaxy body, suggesting a very young stellar population. The fact that some H emission is detected at its position (panel c)) indicates that star formation is still active there. A portion of the spur falls within the LEGUS data of NGC 5477 and is resolved into stars younger than 60 Myr; this confirms a spatial progression of the star formation toward the East direction.
11 Conclusions
SSH is an LBT strategic long-term program imaging 45 late-type dwarf galaxies in and , with the aim of searching for satellites and/or evidences of accretion/perturbation events down to the smallest mass scales. With SSH we plan to characterise the frequency and the properties of streams and sub-structures around dwarfs outside the Local Group (except for one target, UGC 12613, which is inside), but close enough (namely, closer than 11 Mpc) in the Local Universe to allow us to study their resolved stellar populations with LBT or with HST. The properties of our sample galaxies make SSH complementary to any other existing survey of similar aim we are aware of.
The sample galaxies have been chosen to study the properties of the satellites/streams as a function of the galaxy mass and environment. We expect our database to become a reference set for further studies of these objects, both with follow-up observations (either deeper imaging with more powerful instruments, or ad-hoc spectroscopy) and with hydro-dynamical and N-body modelling of their components.
So far, 40 galaxies in SSH have been observed, while data analysis has been completed for about half of the target sample (24 galaxies). In this presentation paper, we describe the goal of the survey, the sample properties, the image acquisition, and our strategies for both the data reduction and the corresponding analyses of the results. We present a few representative cases to illustrate the kind of analyses that we will apply to all the 45 targets and the expected results. In particular, the analysis presented here indicates that we are reaching, for the closets targets which can be resolved into individual stars, a surface brightness limit at least as faint as 31 mag arcsec-2. This sensitivity provides direct evidence for the presence of extended low surface brightness stellar envelopes around the dwarfs, reaching farther out than traced by the integrated light. These stellar envelopes extend as far out as, or even beyond, the observed H I disk. Stellar streams, arcs, and peculiar features are detected for some of the dwarfs, indicating possible perturbation, accretion, or merging events.
We also report on the discovery of an extreme case of Ultra Diffuse Galaxy ( mag/arcsec2) in the background of one of our targets, to illustrate the power of the survey in revealing extremely low surface brightness systems.
When SSH is completed, we will present its overall results in a concluding paper. Particularly interesting cases will be presented individually.
Acknowledgements
We thank the anonymous referee of his/her useful comments and questions, which helped to improve the paper.
We thank G. Iorio and B. Holwerda for useful discussion. We are deeply indebited to S. Roychowdhury for giving us the FIGGS H I data of UGC 685.
This research is partially funded through the INAF Main Stream program SSH 1.05.01.86.28. F. A., M.C. and M.T. acknowledge funding from INAF PRIN-SKA-2017 program 1.05.01.88.04. We acknowledge the support from the LBT-Italian Coordination Facility for the execution of observations, data distribution and pre-reduction. LBT is an international collaboration among institutions in the United States, Italy and Germany. LBT Corporation partners are: the University of Arizona on behalf of the Arizona Board of Regents; Istituto Nazionale di Astrofisica, Italy; LBT Beteiligungsgesellschaft, Germany, representing the Max-Planck Society, the Leibniz Institute for Astrophysics Potsdam, and Heidelberg University; the Ohio State University, and the Research Corporation, on behalf of the University of Notre Dame, University of Minnesota and University of Virginia.
We have made use of the WSRT on the Web Archive. The Westerbork Synthesis Radio Telescope is operated by the Netherlands Institute for Radio Astronomy ASTRON, with support of NWO. The WHISP observation were carried out with the Westerbork Synthesis Radio Telescope, which is operated by the Netherlands Foundation for Research in Astronomy (ASTRON) with financial support from the Netherlands Foundation for Scientific Research (NWO). The WHISP project was carried out at the Kapteyn Astronomical Institute by J. Kamphuis, D. Sijbring and Y. Tang under the supervision of T.S. van Albada, J.M. van der Hulst and R. Sancisi.
This research has made use of the SIMBAD database, operated at CDS, Strasbourg, France
This research has made use of the NASA/IPAC Extragalactic Database (NED), which is operated by the Jet Propulsion Laboratory, California Institute of Technology, under contract with the National Aeronautics and Space Administration.
Part of the analysis presented in this paper has been performed with TOPCAT (Taylor, 2005).
References
- Amorisco, Evans & van de Ven (2014) Amorisco, N. C., Evans, N. W., & van de Ven, G. 2014, Nature 507, 335
- Amorisco (2017) Amorisco, N. C. 2017, MNRAS, 464, 2882
- Annibali et al. (2019a) Annibali, F., La Torre, V., Tosi, M., et al. 2019a, MNRAS, 482, 3892
- Annibali et al. (2019b) Annibali, F., Bellazzini, M., Correnti, M., et al. 2019b, ApJ, in press
- Annibali et al. (2013) Annibali, F., Cignoni, M., Tosi, M., et al. 2013, AJ, 146, 144
- Annibali et al. (2016) Annibali, F., Nipoti, C., Ciotti, L., et al. 2016, ApJ, 826, L27
- Annibali et al. (2018) Annibali, F., La Torre, V., Tosi, M., , et al. 2018, MNRAS
- Aparicio (1994) Aparicio, A. 1994, The Astrophysical Journal, 437, L27
- Atek et al. (2014) Atek et al. 2014, ApJ, 789, 96
- Beccari et al. (2014) Beccari, G., Bellazzini, M., Fraternali, F., et al. 2014, A&A, 570, A78
- Begum et al. (2008) Begum, A., Chengalur, J. N., Karachentsev, I. D., Sharina, M. E., & Kaisin, S. S. 2008, MNRAS, 386, 1667
- Bellazzini et al. (2004) Bellazzini, M., Ferraro, F.R., Sollima, A., Pancino, E., Origlia, L., 2004, A&A, 424, 199
- Bellazzini et al. (2011) Bellazzini, M., Beccari, G., Oosterloo, T.A., et al. 2011, A&A, 527, A58
- Bellazzini et al. (2013) Bellazzini, M., Oosterloo, T., Fraternali, F., & Beccari, G. 2013, A&A, 559, L11
- Bellazzini et al. (2014) Bellazzini, M., Beccari, G., Fraternali, F., et al. 2014, A&A, 566, A44
- Bellazzini et al. (2015) Bellazzini, M., Beccari, G., Battaglia, G., et al. 2015, A&A, 575, A126
- Bellazzini et al. (2017) Bellazzini, M., Belokurov, V., Magrini, L., Fraternali, F., Testa, V., Beccari, G., Marchetti, A., Carini, R., 2017, MNRAS, 467, 3751
- Belokurov et al. (2006) Belokurov, V. et al. 2006, ApJ, 642, L137
- Belokurov & Koposov (2016) Belokurov, V. & Koposov, S. E. 2016, MNRAS, 456, 602
- Berg et al. (2012) Berg, D. A., Skillman, E. D., Marble, A. R., et al. 2012, ApJ, 754, 98
- Bernard et al. (2012) Bernard, E. J., Ferguson, A. M. N., Barker, M. K., et al. 2012, MNRAS, 426, 3490
- Bertin & Arnouts (1996) Bertin, E., & Arnouts, S. 1996, A&AS, 117, 393
- Bertin et al. (2002) Bertin, E., Mellier, Y., Radovich, M., et al. 2002, Astronomical Data Analysis Software and Systems XI, 281, 228
- Bertin (2011) Bertin, E., 2011, ASP Conference Series, Vol. 442, 2011, I.N. Evans, A. Accomazzi, D.J. Mink, and A.H. Rots, eds., p. 435
- Binggeli, Tamman, & Sandage (1987) Binggeli, B., Tamman, G.A., Sandage, A., 1987, AJ, 94, 251
- Binggeli, Tarenghi, & Sandage (1990) Binggeli, B., Tarenghi, M., Sandage, A., 1990, A&A, 228, 42
- Bonaca et al. (2012) Bonaca, A., Geha, M., & Kallivayalil, N. 2012, ApJ, 760, L6
- Bressan et al. (2012) Bressan, A., Marigo, P., Girardi, L., et al. 2012, MNRAS, 427, 127
- Calzetti et al. (2015) Calzetti, D., et al., 2015, ApJ, 149, 51
- Carlin et al. (2016) Carlin, J. L., Sand, D. J., Price, P., et al., 2016, ApJ, 828, L5
- Cignoni et al. (2019) Cignoni, M, Sacchi, E., Tosi M., et al. 2019, apj submitted
- Chiboucas et al. (2013) Chiboucas, K., Jacobs, B. A., Tully, R. B., & Karachentsev, I. D. 2013, AJ, 146, 126
- Cignoni et al. (2013) Cignoni, M., Cole, A.A., Tosi, M., et al, 2013, ApJ, 775, 83
- Cignoni et al. (2015) Cignoni et al 2015, ApJ, 811, 76
- Crnojević et al. (2016) Crnojević, D., Sand, D. J., Spekkens, K., et al. 2016, ApJ, 823, 19
- Dale et al. (2009) Dale, D. A., Cohen, S. A., Johnson, L. C., et al. 2009, The Astrophysical Journal, 703, 517
- Deason et al. (2015) Deason, A. J., Wetzel, A. R., Garrison-Kimmel, S. & Belokurov, V. , 2015, MNRAS, 453, 3568
- de Vaucouleurs et al. (1991) de Vaucouleurs, G., de Vaucouleurs, A., Corwin, H. G., Jr., et al. 1991, Third Reference Catalogue of Bright Galaxies. Springer, New York, NY (USA), 1991, 2091 p., ISBN 0-387-97552-7
- Diemand et al. (2008) Diemand, J., Kuhlen, M., Madau, P., et al. 2008, Nature, 454, 735
- Draine et al. (2007) Draine, B. T., Dale, D. A., Bendo, G., et al. 2007, ApJ, 663, 866
- Dressler (1980) Dressler, A., 1980, ApJ, 236, 351
- Drissen et al. (2000) Drissen, L., Roy, J.-R., Robert, C., Devost, D., & Doyon, R. 2000, AJ, 119, 688
- Gallagher et al. (1998) Gallagher, J. S., Tolstoy, E., Dohm-Palmer, R. C., et al. 1998, AJ, 115, 1869
- Giallongo et al. (2008) Giallongo, E., Ragazzoni, R., Grazian, A., et al., 2008, A&A482, 349
- Greggio et al. (2014) Greggio, L., Rejkuba, M., Gonzalez, O. A., et al. 2014, A&A, 562, A73
- Higgs et al. (2016) Higgs, C. R., McConnachie, A. W., Irwin, M., et al. 2016, MNRAS, 458, 1678
- Holwerda (2005) Holwerda, B. W. 2005, arXiv:astro-ph/0512139
- Hunter et al. (2001) Hunter, D. A., Elmegreen, B. G., & van Woerden, H. 2001, ApJ, 556, 773
- Hunter et al. (2012) Hunter, D. A., Ficut-Vicas, D., Ashley, T., et al. 2012, AJ, 144, 134
- Ibata et al. (2001) Ibata, R., Irwin, M., Lewis, G., Ferguson, A. M. N., Tanvir, N. , 2001, Nature, 412, 49
- Ibata et al. (2014) Ibata, R. A., Lewis, G. F., McConnachie, A. W., et al. 2014, ApJ, 780, 128
- Iorio et al. (2017) Iorio, G., Fraternali, F., Nipoti, C., et al. 2017, MNRAS, 466, 4159
- Izotov & Thuan (2009) Izotov, Y. I. & Thuan, T. X. ,2009, ApJ, 690, 1797
- Izotov et al. (1997) Izotov, Y. I., Thuan, T. X., & Lipovetsky, V. A. 1997, ApJS, 108, 1
- Jacobs et al. (2009) Jacobs, B. A., Rizzi, L., Tully, R. B., et al. 2009, AJ, 138, 332
- James et al. (2016) James, B. L., Auger, M., Aloisi, A., Calzetti, D., & Kewley, L. 2016, ApJ, 816, 40
- Jedrzejewski (1987) Jedrzejewski, R. I. 1987, MNRAS, 226, 747
- Kallivayalil et al. (2019) Kallivayalil, et al 2019 ….
- Karademir et al. (2019) Karademir, G. S., Remus, R.-S., Burkert, A., et al. 2019, MNRAS, 487, 318
- Karachentsev et al. (2004) Karachentsev, I. D., Karachentseva, V. E., Huchtmeier, W. K., & Makarov, D. I. 2004, AJ, 127, 2031
- Karachentsev et al. (2013) Karachentsev, I. D., Makarov, D. I., & Kaisina, E. I. 2013, AJ, 145, 101
- Kennicutt et al. (2003) Kennicutt, R. C., Bresolin, F., & Garnett, D. R. 2003, ApJ, 591, 801
- Kniazev et al. (2009) Kniazev, A. Y., Brosch, N., Hoffman, G. L., et al. 2009, MNRAS, 400, 2054
- Koda et al. (2015) Koda, J., Yagi, M., Yamanoi, H., & Komiyama, Y. 2015, ApJ, 807, L2
- Lelli et al. (2014b) Lelli, F., Verheijen, M., & Fraternali, F. 2014, A&A, 566, A71
- Mackey et al. (2016) Mackey, A. D., Koposov, S. E., Erkal, D., et al. 2016, MNRAS, 459, 239
- Madden et al. (2013) Madden, S. C., Rémy-Ruyer, A., Galametz, M., et al. 2013, PASP, 125, 600
- Makarov et al. (2013) Makarov, D. I., Makarova, L. N., & Uklein, R. I. 2013, Astrophysical Bulletin, 68, 125
- Makarova et al. (2018) Makarova, L. N., Makarov, D. I., Antipova, A. V., Karachentsev, I. D., & Tully, R. B. 2018, MNRAS, 474, 3221
- Monachesi et al. (2016) Monachesi, A., Bell, E. F., Radburn-Smith, D. J., et al. 2016, MNRAS, 457, 1419
- Martin et al. (2014) Martin, N. F., Ibata, R. A., Rich, R. M., et al. 2014, ApJ, 787, 19
- Martinez-Delgado et al. (2010) Martinez-Delgado, D., Gabany, R. J., Crawford, K., et al., 2010, AJ, 140, 962
- Martínez-Delgado et al. (2012) Martínez-Delgado, D., Romanowsky, A. J., Gabany, R. J., et al. 2012, ApJ, 748, L24
- McCall et al. (2012) McCall, M. L., Vaduvescu, O., Pozo Nunez, F., et al. 2012, Astronomy and Astrophysics, 540, A49
- McConnachie et al. (2005) McConnachie, A. W., Irwin, M. J., Ferguson, A. M. N., et al. 2005, Monthly Notices of the Royal Astronomical Society, 356, 979
- McConnachie et al. (2007) McConnachie, A. W., Venn, K. A., Irwin, M. J., Young, L. M., & Geehan, J. J. 2007, ApJ, 671, L33
- Giovanelli et al. (2005) Giovanelli, R., Haynes, M. P., Kent, B. R., et al. 2005, AJ, 130, 2598
- Lelli et al. (2014) Lelli, F., Verheijen, M., & Fraternali, F. 2014, Monthly Notices of the Royal Astronomical Society, 445, 1694
- McConnachie et al. (2009) McConnachie, A. W., Irwin, M. J., Ibata, R. A., et al., 2009, Nature 461, 66
- McConnachie (2012) McConnachie, A. W., 2012, AJ, 144, 4
- McConnachie et al. (2018) McConnachie, A. W., Ibata, R., Martin, N., et al. 2018, ApJ, 868, 55
- McQuinn et al. (2014) McQuinn, K. B. W., Cannon, J. M., Dolphin, A. E., et al. 2014, ApJ, 785, 3
- McQuinn et al. (2017) McQuinn, K. B. W., Boyer, M. L., Mitchell, M. B., et al. 2017, The Astrophysical Journal, 834, 78
- Mihos et al. (2013) Mihos, J. C., Harding, P., Spengler, C. E., Rudick, C. S., & Feldmeier, J. J. 2013, ApJ, 762, 82
- Noeske et al. (2000) Noeske, K. G., Guseva, N. G., Fricke, K. J., et al. 2000, A&A, 361, 33
- Oh et al. (2008) Oh, S.-H., de Blok, W. J. G., Walter, F., Brinks, E., & Kennicutt, R. C., Jr. 2008, AJ, 136, 2761
- Okamoto et al. (2015) Okamoto, S., Arimoto, N., Ferguson, A. M. N., et al. 2015, ApJ, 809, L1
- Peebles et al. (1982) Peebles, P., et al., 1982, AJ, 263. L15
- Pietrzyński et al. (2010) Pietrzyński, G., Górski, M., Gieren, W., et al. 2010, The Astronomical Journal, 140, 1038
- Peñarrubia et al. (2006) Peñarrubia, J., McConnachie, A., & Babul, A. 2006, ApJ, 650, L33
- Peng et al. (2002) Peng, C.Y., Ho, L.C., Impey, C.D., Rix, H.-W., 2002, AJ, 124, 266
- Pucha et al. (2019) Pucha, R., Carlin, J. L., Willman, B., et al. 2019, arXiv:1905.02210
- Pustilnik et al. (2016) Pustilnik, S. A., Perepelitsyna, Y. A., & Kniazev, A. Y. 2016, MNRAS, 463, 670
- Rich et al. (2012) Rich, R. M., et al., 2012, Nature 482, 192
- Roderick et al. (2015) Roderick, T. A., Jerjen, H., Mackey, A. D., & Da Costa, G. S. 2015, ApJ, 804, 134
- Roman & Trujillo (2017) Roman, J., Trujillo, I., 2017, MNRAS, 468, 4039
- Roychowdhury et al. (2009) Roychowdhury, S., Chengalur, J. N., Begum, A., & Karachentsev, I. D. 2009, MNRAS, 397, 1435
- Ryś et al. (2011) Ryś, A., Grocholski, A. J., van der Marel, R. P., Aloisi, A., & Annibali, F. 2011, A&A, 530, A23
- Sacchi et al. (2016) Sacchi, E., Annibali, F., Cignoni, M., et al., 2016, ApJ, 830, 3
- Sabbi et al. (2018) Sabbi, E., Calzetti, D., Ubeda, L., et al. 2018, ApJS, 235, 23
- Sand et al. (2015) Sand, D. J., Spekkens, K., Crnojević, D., Hargis, J. R.;,Willman, B., Strader, J., Grillmair, C. J. 2015, ApJ, 812, L13
- Sérsic (1968) Sérsic, J.-L. 1968, Atlas de Galaxias Australes (Cordoba: Observa- torio Astronomico)
- Schlafly & Finkbeiner (2011) Schlafly, E. F., & Finkbeiner, D. P. 2011, ApJ, 737, 103
- Skillman et al. (1997) Skillman, E. D., Bomans, D. J., & Kobulnicky, H. A. 1997, ApJ, 474, 205
- Stetson (1987) Stetson, P. B. 1987, PASP, 99, 191
- Stierwalt et al. (2015) Stierwalt, S., Besla, G., Patton, D., et al. 2015, ApJ, 805, 2
- Swaters et al. (2002) Swaters, R. A., van Albada, T. S., van der Hulst, J. M., & Sancisi, R. 2002, A&A, 390, 829
- Tanaka et al. (2017) Tanaka, M., Chiba, M., & Komiyama, Y. 2017, ApJ, 842, 127
- Taylor (2005) T Taylor, M.B., 2005, in Astronomical Data Analysis Software and Systems XIV, ASP Conference Series, Vol. 347, P. Shopbell, M. Britton, and R. Ebert Eds. San Francisco: Astronomical Society of the Pacific, p.29
- Tolstoy, Hill, & Tosi (2009) Tolstoy, E., Hill, V., & Tosi, M., 2009, ARA&A, 47, 371
- Tonry et al. (2012) Tonry, J.L., Stubbs, C.W., Lykke, K.R., et al. 2012, ApJ, 750, 99
- Tosi et al. (2001) Tosi, M., Sabbi, E., Bellazzini, M., et al., 2001, AJ, 122, 127
- Tully et al. (2006) Tully, R. B., Rizzi, L., Dolphin, A. E., et al. 2006, AJ, 132, 729
- Tully et al. (2013) Tully, R. B., Courtois, H. M., Dolphin, A. E., et al. 2013, The Astronomical Journal, 146, 86
- van Dokkum et al. (2015a) van Dokkum, P. G., Abraham, R., Merritt, A., et al. 2015a, ApJ, 798, L45
- van Zee, & Haynes (2006) van Zee, L., & Haynes, M. P. 2006, ApJ, 636, 214
- Wheeler et al. (2015) Wheeler, C. et al. 2015, MNRAS, 453, 1305
- White (1978) White, S. D. M. & Rees, M. J. 1978, MNRAS, 183, 341
- Young et al. (2003) Young, L. M., van Zee, L., Lo, K. Y., Dohm-Palmer, R. C., & Beierle, M. E. 2003, ApJ, 592, 111