Critical behaviors of high-degree adaptive and collective-influence percolation
Abstract
How the giant component of a network disappears under attacking nodes or links addresses a key aspect of network robustness, which can be framed into percolation problems. Various strategies to select the node to be deactivated have been studied in the literature; for instance, a simple random failure or high-degree adaptive (HDA) percolation. Recently a new attack strategy based on a quantity called collective-influence (CI) has been proposed from the perspective of optimal percolation. By successively deactivating the node having the largest CI-centrality value, it was shown to be able to dismantle a network more quickly and abruptly than many of the existing methods. In this paper, we focus on the critical behaviors of the percolation processes following degree-based attack and CI-based attack on random networks. Through extensive Monte Carlo simulations assisted by numerical solutions, we estimate various critical exponents of the HDA percolation and those of the CI percolations. Our results show that these attack-type percolation processes, despite displaying apparently more abrupt collapse, nevertheless exhibit standard mean-field critical behaviors at the percolation transition point. We further discover an extensive degeneracy in top-centrality nodes in both processes, which may provide a hint for understanding the observed results.
Network robustness is a longstanding problem in complex systems. Among various heuristics of optimal percolation proposed to effectively disintegrate a network, high-degree adaptive (HDA) attack and collective-influence (CI) attack are simple heuristics that use local information but can nevertheless destroy a network much more effectively than random percolation. It is, however, largely unknown as yet how the critical behavior of percolation transition (i.e., the manner in which the giant component disappears) is affected by various attack strategies. In this work, it is revealed that despite apparently more abrupt disintegration the critical behavior of HDA and CI percolation transitions remains of standard mean-field type, accompanied by the massive degeneracy of top-centrality nodes near the critical point in these processes.
I Introduction
Statistical physics is the study of many-body problems. Complex networks, in which many nodes interact via links, have been the subject of research by many statistical physicists Newman (2010). Understanding the robustness of complex networks is a longstanding problem Cohen and Havlin (2010). Observing how complex networks respond to intentional attacks is one common way to approach this problem. The giant component of the network under intentional attack gets smaller and finally disappears at the critical point. This can map to an optimal percolation problem that destroys the giant component of a network by deactivating a minimal set of nodes. The minimal set of deactivated nodes is considered to be important nodes for maintaining the function of the network. These important nodes are also called influencers Morone and Makse (2015).
Unfortunately, finding the minimal set of nodes that can destroy the giant component in a network is in general an NP-hard problem. Thus, various heuristic methods were developed for this problem. In the early research stages, the nodes with high degree or high betweenness centrality were considered influencers Albert et al. (2000); Callaway et al. (2000); Cohen et al. (2001); Holme et al. (2002). Since then, a number of strategies have been proposed to find near-optimal influencers more effectively Morone and Makse (2015); Kitsak et al. (2010); Braunstein et al. (2016); Clusella et al. (2016); Lü et al. (2016); Mugisha and Zhou (2016); Zdeborová et al. (2016); Ren et al. (2019). These strategies are summarized in Ref. Lü et al. (2016). In general, each strategy assigns a certain centrality value to nodes in its own way, and the node with highest centrality value is deactivated one by one. Centrality value of nodes can either be kept fixed as the initial value during the percolation process or be updated in every step “adaptively” as the nodes are deactivated.
There is, however, no integrated perspective of various optimal percolation strategies yet. An important step towards integrated understanding from the perspective of statistical physics is to characterize the percolation phase transition properties of each strategy. It is well known that continuous mean-field phase transition occurs in the random percolation process on random networks Newman (2010); Cohen and Havlin (2010). On the other hand, several papers reported that the near-optimal percolation processes induce discontinuous collapse of the giant component at the transition point Braunstein et al. (2016); Clusella et al. (2016); Morone et al. (2016); Mugisha and Zhou (2016); Zdeborová et al. (2016); Pei et al. (2017); Ren et al. (2019). Yet our understanding of how the universality of the percolation processes changes between these two extremes and what factors cause discontinuity is still limited. Our primary aim in the current study is to contribute to make progress in this direction.
The percolation process we chose to study in this work about the critical behaviors of phase transition is the collective-influence (CI) percolation Morone and Makse (2015). CI percolation includes also the high-degree adaptive (HDA) percolation as a special case. Principal reason why we chose CI percolation is that it is a near-optimal percolation process with abrupt yet continuous disintegration of the giant component at the critical point. It is also known that CI percolation is able to attain near-optimal percolation results by straightforward and fast algorithm of time complexity Morone and Makse (2015); Morone et al. (2016). For this reason, it has been actively studied Morone et al. (2017); Del Ferraro et al. (2018) and refined Morone et al. (2016); Pei et al. (2017). Detailed model description will be given in Sec. II.
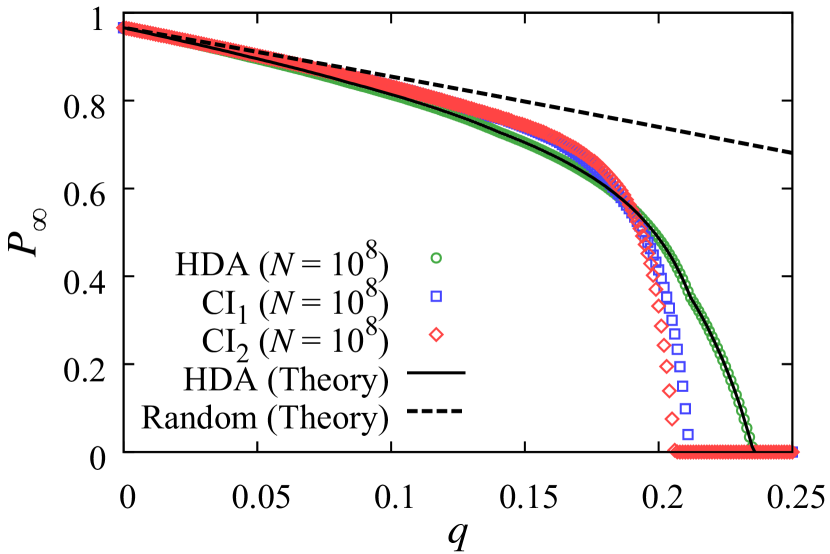
As shown in the Fig. 1, in the case of CI percolation, the order parameter seems to disappear rapidly in the vicinity of the critical point. This raises the question if it might possess the order-parameter critical exponent different from that of random percolation. To answer this question, we performed finite-size scaling analysis using extensive Monte Carlo simulations. Despite the apparently abrupt change at critical point, we obtained standard mean-field critical exponents in both the HDA and CI percolations. Moreover, to gain more insight of what is happening near the transition point, we examined the behavior of top-centrality nodes, discovering extensive degeneracy.
II Models
To select the influencers, we used the degree-centrality for HDA percolation and the CI-centrality for CI percolation Morone and Makse (2015). When a node is deactivated, the links attached to the node are also considered deactivated and in effect the degree of the deactivated node becomes zero. Consequently, as the percolation process proceeds by successively deactivating nodes, a node’s degree undergoes change. In the following, we denote node ’s degree, , as the number of node ’s active neighbors in the remaining network.
In HDA percolation, one deactivates the node with highest degree and updates its neighbors’ degree in every step. If there are more than one node with the same top-centrality (meaning largest degree), one of them is randomly deactivated.
For CI percolation, we follow the definition of CI-centrality in Ref. Morone and Makse (2015), given as follows:
| (1) |
Here is the CI-centrality value of node with distance parameter , and is the set of nodes which are at distance (disallowing backtracking) from the node . The CI-centrality value of node incorporates not only its own degree but also the degrees of nodes which are at distance away from it. Therefore, CI percolation does not simply deactivate high-degree nodes themselves, but tends rather to deactivate “bridges” between high-degree nodes Morone and Makse (2015). In CI percolation, one deactivates the node with top-centrality (meaning largest CI-centrality) and updates the CI-centrality values within the distance from the deactivated node each step. Similarly to HDA percolation, if there are multiple nodes with same top-centrality, then a randomly-chosen node among them is deactivated. Note that by considering the distance- neighbor to be the node itself, we have . Thus HDA percolation can be treated as the special case of CI percolation with Morone and Makse (2015).
III Monte Carlo simulation methods and numerical solutions
We applied HDA percolation and CI percolation with on Erdős-Rényi (ER) networks Erdos and Rényi (1960). The control parameter is the fraction of deactivated nodes (). Primary quantity of interest is the probability that a randomly-chosen node among all nodes (regardless of remaining active or being deactivated) belongs to the giant component, which serves as the order parameter in the percolation process. Numerically we calculate it by the largest connected component fraction averaged over Monte Carlo configurations. We also examine the average size of the component that a randomly-chosen node belongs to, which plays the role of susceptibility, defined as follows:
| (2) |
where is the component size, is the number of components with size at deactivated-node fraction , and the summation runs over only finite sizes. Numerically we calculate Eq. (2) using the connected component configurations obtained by Monte Carlo simulations by omitting the largest connected component. We have performed Monte Carlo simulations on ER networks with different mean degrees to find consistent results and in the following will present the results specifically for the mean degree .
We also formulate the numerical solution for HDA percolation. For a random network, various quantities can be calculated by generating function method with degree distribution Callaway et al. (2000); Newman et al. (2001). Fortunately, we can calculate degree distribution as a function of the deactivated-node fraction for HDA percolation using iteration method. To apply the iteration method, we need the initial condition and the recurrence relations. To begin with, the degree distribution of ER network of mean degree is well known to be the Poisson distribution Erdos and Rényi (1960).
To obtain the recurrence relations for the degree distribution as the nodes are deactivated, let the degree distribution be the probability that the randomly chosen node has degree at the deactivated-node fraction in HDA percolation. The degree distribution after additionally deactivating fraction of nodes, , can be obtained as follows. First, as increases by , increases by and decreases by where , the maximum degree in the network at the deactivated-node fraction . At the same time, when a node with degree is deactivated, the degree of the nodes linked to that deactivated node decreases by 1. The probability that a node with degree is connected to a link from the deactivated node is . Combining the two effects, we obtain the complete set of recurrence relations as follows.
| (3) | ||||
The right hand side of each line contains a gain term due to the nodes with degree linked to the deactivated node and the loss term due to the nodes with degree linked to the deactivated node, except for the () equation that contains two gain (loss) terms. Theoretically, the maximum degree is not limited; however, when numerically solving Eq. (3) we can practically introduce a finite maximum degree without sacrificing precision. In our numerical calculation we set the cutoff probability to be , meaning that the degree with is considered nonexistent in the network. In this way, the initial value of was obtained to be for the ER network with mean-degree . As Eq. (3) is iterated, the maximum degree decreases when drops below the cutoff.
Once the is obtained by solving the recurrence relations Eq. (3), one can apply the standard generating function technique Callaway et al. (2000); Newman et al. (2001) to calculate and as a function of the deactivated-node fraction . The underlying assumption behind this procedure is that after the HDA percolation, the remaining network can be characterized solely by like random networks. The agreement of the numerical solution with the Monte Carlo simulations, as shown in Fig. 1, validates this assumption.
IV Critical behaviors
As one deactivates nodes (hence increasing ), the giant component size decreases and becomes zero at the critical point . Typical of continuous phase transitions, the average component size and the correlation length diverge at the critical point in the thermodynamic limit. In the vicinity of critical point, the order parameter, the average component size and the correlation length are known to exhibit power laws with the critical exponent , and , respectively:
| (4) | |||||
| (5) | |||||
| (6) |
We use finite-size scaling ansatz and Monte Carlo simulations to obtain these critical exponents. According to the finite-size scaling theory, percolation quantities like and have the scaling form near the critical point with the size of the system as
| (7) | |||
| (8) |
where and , respectively, is the scaling function. These equations imply the following power-law scalings,
| (9) | |||||
| (10) | |||||
| (11) |
where with being effective dimension Hong et al. (2007), which is for ER network with random percolations. In Eq. (9), is the value of at which displays maximum value in the networks of finite size .
To apply the finite-size scaling theory, we first need to know the critical point . Using numerical solution from Sec. III, the critical point of HDA percolation on ER network with mean degree is obtained to be . For CI percolations, we estimated that best fits Eqs. (10, 11) using Monte Carlo simulation results. We note that using Eq. (9) for estimating was not as reliable due to relatively large errors in locating from Monte Carlo simulations. For the ER networks with the same mean degree , we obtained the critical point of percolation to be , and for percolation .
| Model | ||||
|---|---|---|---|---|
| HDA percolation | 0.235 550 | 0.99(4) | 1.00(4) | 2.99(11) |
| percolation | 0.211 61(1) | 1.02(4) | 1.03(4) | 3.06(13) |
| percolation | 0.206 01(1) | 1.03(5) | 1.03(4) | 3.07(13) |
| Random percolation | 0.714 285 | 1 | 1 | 3 |
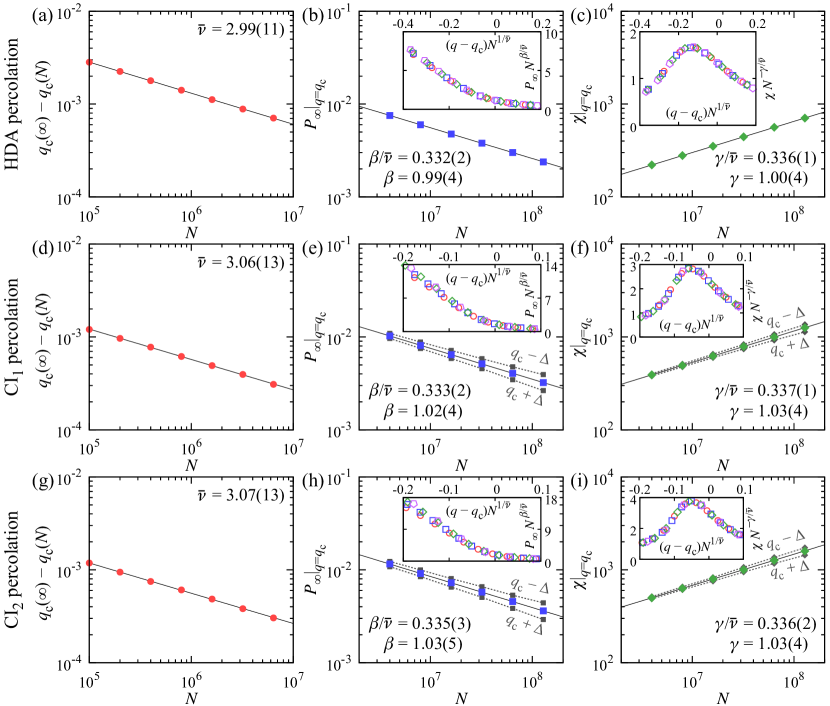
Fig. 2 displays, for the HDA, CI1, and CI2 percolations, the finite-size scaling results of Eqs. (9–11) in the main panels, together with corresponding finite-size-scaled data collapse curves of Eqs. (7–8) in the insets. This analysis provides estimates of the exponents , , and , from which we extract values of the critical exponents , , and . The obtained values of the critical point and the critical exponents are summarized in Table 1. The critical exponents we obtained are consistent with those of random percolation within margin of error. Our results show that, despite the apparently more rapid change near the transition point, both HDA and CI percolations still belong to the same universality as random percolation in random networks.
V Degeneracy of top-centrality value
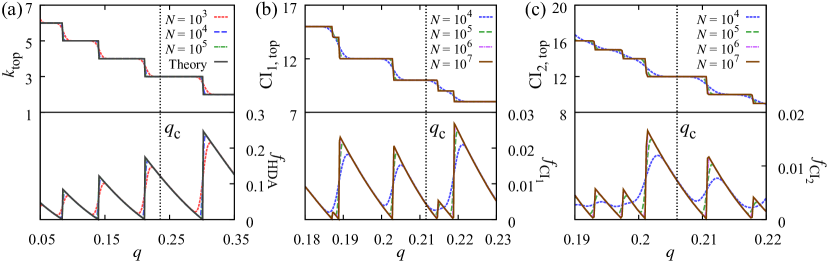
Despite the apparently more abrupt collapse, the results of our analysis strongly suggest that HDA and CI percolations belong to the same universality as random percolation. To gain more insight, we examine how the top-centrality value (degree-centrality for HDA percolation and CI-centrality value for CI percolation) behaves near the percolation critical point (Fig. 3). First we observe that as the percolation process proceeds and approaches to the critical point, the top-centrality value becomes highly degenerate, which is realized as the succession of long plateaus in the upper panels of Fig. 3. For HDA, the lines for different system size converge to the stairs-like curve predicted by the numerical solution as the system size increases. Same limiting behavior is observed for the CI1,2 percolations, suggesting that they would develop the stairs-like behavior asymptotically as well. Next, we show the fraction of top-centrality nodes in the lower panels of Fig. 3. It also tends to the limiting saw-like curve as the system size increases, implying that the number of top-centrality nodes near the critical point is extensive, that is, proportional to the system size . In other words, if the system size goes to infinity, the number of nodes with the top-centrality value would also go to infinity, confirming a massive degeneracy of top-centrality value.
According to the rules of HDA and CI percolation, when there are many nodes with the same top-centrality value, one of the nodes is randomly selected and deactivated. The presence of extensive degeneracy of top-centrality nodes near the critical point implies that one of the extensively-many top-centrality nodes is chosen randomly and deactivated. This induces that the selectiveness is weakened and the node-deactivation process would become more random-like.
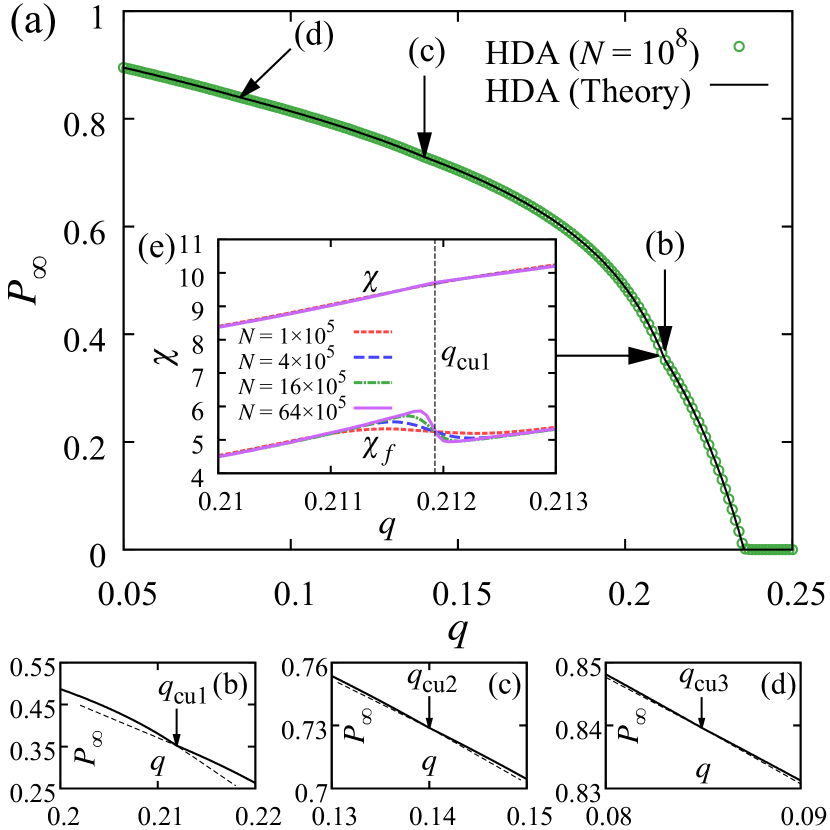
The presence of extensive degeneracy in top-centrality value manifests itself in the behavior of order parameter as well. In HDA percolation, the cusp points in the order parameter curve are observed at the points where change its value (see for example the cusps at , , and in Fig. 4). The discrete change of value across the cusp point induces discontinuous change of the rate of decrease of the order parameter across that point, establishing the cusp [see Fig. 4(b–d)]. This phenomenon is also verified by the Monte Carlo simulation near . The susceptibility-like quantities, the average component size and the fluctuation of the order parameter , also exhibit non-analytic behavior such as cusp () or discontinuity () at the cusp point, as shown in Fig. 4(e). Here is defined by where denotes the ensemble average. They do not, however, diverge there. These cusp points, therefore, are not likely critical points. The existence (or absence) of similar cusps in the CI percolations is not clearly discernible due to limited resolution of our Monte Carlo simulations.
VI Discussion
In this paper, we have studied the critical behaviors of HDA and CI percolation transitions on random networks using Monte Carlo simulations and numerical solutions. We found that the critical behavior of the two attack-based processes is in the same universality class as the random percolation, despite their more abrupt, near-optimal disruption of network connectivity than random percolation. We uncovered the massive degeneracy of maximum centrality value near the critical point, which might contribute to render the transition of mean-field type. Recently, a study reported Almeira et al. (2020) non-standard-mean-field critical exponent for HDA percolation, specifically , which contradicts with our mean-field-consistent result in this work. Our analysis uses much larger network size (up to compared to in Ref. Almeira et al. (2020)) and is supported also by the numerical solutions. It is noteworthy that Ref. Almeira et al. (2020) also reported high-betweenness adaptive percolation to exhibit different critical exponents from those of random percolation. It has also been reported that HDA percolation has the same exponents as random percolation on two-dimensional proximity graphs Norrenbrock et al. (2016). This also indirectly supports that HDA percolation belongs to the same universality class as random percolation.
In a broader perspective, our work initiates the studies of attack-type and optimal percolation processes for deeper understanding from the viewpoint of critical behaviors at the percolation transition point. Understanding the nature of critical behaviors will help for example devise detection and protection strategy upon the attacks on the network, as different criticality entails different ‘early warnings’ Scheffer et al. (2009). Another interesting standing question is the condition for the non-mean-field criticality in the optimal percolation processes. The HDA and CI percolation processes implement local heuristics for selecting nodes to be deactivated. There exist approaches based on global optimization methods Braunstein et al. (2016); Clusella et al. (2016); Morone et al. (2016); Mugisha and Zhou (2016); Zdeborová et al. (2016); Pei et al. (2017); Ren et al. (2019). that reportedly produce discontinuous disappearance of the giant component in the attacked network. Identifying minimal condition for the non-standard-mean-field criticality as well as the discontinuity in the network attack process remains a theoretically intriguing problem, to be explored in future works. Finally, the phase transition property of the CI percolation with higher-order network effects such as on modular networks is also an interesting problem for future study.
Acknowledgments
This work was supported in part by the National Research Foundation of Korea (NRF) grants funded by the Korea government (MSIT) (No. 2017R1A2B2003121 and No. 2020R1A2C2003669).
Author contributions
J-HK, S-JK and K-IG conceived the project; J-HK, S-JK performed the simulations; all authors interpreted the results and contributed to the writing of the manuscript.
References
- Newman (2010) M. E. J. Newman, Networks: an introduction (Oxford, 2010).
- Cohen and Havlin (2010) R. Cohen and S. Havlin, Complex networks: structure, robustness and function (Cambridge university press, 2010).
- Morone and Makse (2015) F. Morone and H. A. Makse, “Influence maximization in complex networks through optimal percolation,” Nature 524, 65 (2015).
- Albert et al. (2000) R. Albert, H. Jeong, and A.-L. Barabási, “Error and attack tolerance of complex networks,” Nature 406, 378 (2000).
- Callaway et al. (2000) D. S. Callaway, M. E. J. Newman, S. H. Strogatz, and D. J. Watts, “Network robustness and fragility: Percolation on random graphs,” Phys. Rev. Lett. 85, 5468 (2000).
- Cohen et al. (2001) R. Cohen, K. Erez, D. ben Avraham, and S. Havlin, “Breakdown of the internet under intentional attack,” Phys. Rev. Lett. 86, 3682 (2001).
- Holme et al. (2002) P. Holme, B. J. Kim, C. N. Yoon, and S. K. Han, “Attack vulnerability of complex networks,” Phys. Rev. E 65, 056109 (2002).
- Kitsak et al. (2010) M. Kitsak, L. K. Gallos, S. Havlin, F. Liljeros, L. Muchnik, H. E. Stanley, and H. A. Makse, “Identification of influential spreaders in complex networks,” Nature physics 6, 888 (2010).
- Braunstein et al. (2016) A. Braunstein, L. Dall’Asta, G. Semerjian, and L. Zdeborová, “Network dismantling,” Proceedings of the National Academy of Sciences 113, 12368 (2016).
- Clusella et al. (2016) P. Clusella, P. Grassberger, F. J. Pérez-Reche, and A. Politi, “Immunization and targeted destruction of networks using explosive percolation,” Phys. Rev. Lett. 117, 208301 (2016).
- Lü et al. (2016) L. Lü, T. Zhou, Q.-M. Zhang, and H. E. Stanley, “The h-index of a network node and its relation to degree and coreness,” Nature communications 7, 10168 (2016).
- Mugisha and Zhou (2016) S. Mugisha and H.-J. Zhou, “Identifying optimal targets of network attack by belief propagation,” Phys. Rev. E 94, 012305 (2016).
- Zdeborová et al. (2016) L. Zdeborová, P. Zhang, and H.-J. Zhou, “Fast and simple decycling and dismantling of networks,” Scientific reports 6, 37954 (2016).
- Ren et al. (2019) X.-L. Ren, N. Gleinig, D. Helbing, and N. Antulov-Fantulin, “Generalized network dismantling,” Proceedings of the National Academy of Sciences 116, 6554 (2019).
- Lü et al. (2016) L. Lü, D. Chen, X.-L. Ren, Q.-M. Zhang, Y.-C. Zhang, and T. Zhou, “Vital nodes identification in complex networks,” Physics Reports 650, 1 (2016).
- Morone et al. (2016) F. Morone, B. Min, L. Bo, R. Mari, and H. A. Makse, “Collective influence algorithm to find influencers via optimal percolation in massively large social media,” Scientific reports 6, 30062 (2016).
- Pei et al. (2017) S. Pei, X. Teng, J. Shaman, F. Morone, and H. A. Makse, “Efficient collective influence maximization in cascading processes with first-order transitions,” Scientific reports 7, 45240 (2017).
- Morone et al. (2017) F. Morone, K. Roth, B. Min, H. E. Stanley, and H. A. Makse, “Model of brain activation predicts the neural collective influence map of the brain,” Proceedings of the National Academy of Sciences 114, 3849 (2017).
- Del Ferraro et al. (2018) G. Del Ferraro, A. Moreno, B. Min, F. Morone, Ú. Pérez-Ramírez, L. Pérez-Cervera, L. C. Parra, A. Holodny, S. Canals, and H. A. Makse, “Finding influential nodes for integration in brain networks using optimal percolation theory,” Nature communications 9, 2274 (2018).
- Newman et al. (2001) M. E. J. Newman, S. H. Strogatz, and D. J. Watts, “Random graphs with arbitrary degree distributions and their applications,” Phys. Rev. E 64, 026118 (2001).
- Erdos and Rényi (1960) P. Erdos and A. Rényi, “On the evolution of random graphs,” Publ. Math. Inst. Hung. Acad. Sci 5, 17–60 (1960).
- Hong et al. (2007) H. Hong, M. Ha, and H. Park, “Finite-size scaling in complex networks,” Phys. Rev. Lett. 98, 258701 (2007).
- Almeira et al. (2020) N. Almeira, O. V. Billoni, and J. I. Perotti, “Scaling of percolation transitions on erdös-rényi networks under centrality-based attacks,” Phys. Rev. E 101, 012306 (2020).
- Norrenbrock et al. (2016) C. Norrenbrock, O. Melchert, and A. K. Hartmann, “Fragmentation properties of two-dimensional proximity graphs considering random failures and targeted attacks,” Phys. Rev. E 94, 062125 (2016).
- Scheffer et al. (2009) M. Scheffer, J. Bascompte, W. A. Brock, V. Brovkin, S. R. Carpenter, V. Dakos, H. Held, E. H. Van Nes, M. Rietkerk, and G. Sugihara, “Early-warning signals for critical transitions,” Nature 461, 53 (2009).