Pinching a glass reveals key properties of its soft spots
Abstract
It is now well established that glasses feature quasilocalized nonphononic excitations — coined “soft spots”—, which follow a universal density of states in the limit of low frequencies . All glass-specific properties, such as the dependence on the preparation protocol or composition, are encapsulated in the non-universal prefactor of the universal law. The prefactor, however, is a composite quantity that incorporates information both about the number of quasilocalized nonphononic excitations and their characteristic stiffness, in an apparently inseparable manner. We show that by pinching a glass, i.e. by probing its response to force dipoles, one can disentangle and independently extract these two fundamental pieces of physical information. This analysis reveals that the number of quasilocalized nonphononic excitations follows a Boltzmann-like law in terms of the parent temperature from which the glass is quenched. The latter, sometimes termed the fictive (or effective) temperature, plays important roles in non-equilibrium thermodynamic approaches to the relaxation, flow and deformation of glasses. The analysis also shows that the characteristic stiffness of quasilocalized nonphononic excitations can be related to their characteristic size, a long sought-for length scale. These results show that important physical information, which is relevant for various key questions in glass physics, can be obtained through pinching a glass.
I Introduction
Understanding the micromechanical, statistical and thermodynamic properties of soft nonphononic excitations in structural glasses remains one of the outstanding challenges in glass physics, despite decades of intensive research Ilyin et al. (1987); Buchenau et al. (1991); Gurevich et al. (2003); Parshin et al. (2007); Wyart (2005, 2010); Schirmacher (2006); Schirmacher et al. (2007); Marruzzo et al. (2013); DeGiuli et al. (2014); Franz et al. (2015); Beltukov (2015); Lerner et al. (2016); Kapteijns et al. (2018); Lerner and Bouchbinder (2018a); Stanifer et al. (2018); Benetti et al. (2018); Ikeda (2019); Shimada et al. (2017). Soft nonphononic excitations are believed to give rise to a broad range of glassy phenomena, many of which are still poorly understood; some noteworthy examples include the universal thermodynamic and transport properties of glasses at temperatures of 10K and lower Zeller and Pohl (1971); Anderson et al. (1972); Phillips (1972); Buchenau et al. (1991); Parshin et al. (2007), the low-temperature yielding transition in which a mechanically-loaded brittle glass fails via the formation of highly localized bands of plastic strain Schuh et al. (2007); Hufnagel et al. (2016), and anomalous, non-Rayleigh wave attenuation rates Gelin et al. (2016); Mizuno and Ikeda (2018); Moriel et al. (2019).
Computational studies have been invaluable in advancing our knowledge about the statistical and mechanical properties of soft glassy excitations, and in revealing the essential roles that these excitations play in various glassy phenomena. Dating back to the early 1990’s, Schober and Laird were the first to reveal the existence of soft spots in the form of low-frequency, quasilocalized vibrational modes in a model computer glass Laird and Schober (1991); Schober and Laird (1991). Soon later, Schober and coworkers showed that relaxation events deep in the glassy state exhibit patterns that resemble quasilocalized modes Schober et al. (1993), suggesting a link between soft glassy structures and dynamics. In an important subsequent work Widmer-Cooper et al. (2008), this link was further strengthened by showing that relaxational dynamics in supercooled liquids strongly correlates with quasilocalized low-frequency vibrational modes measured in underlying inherent states. Some years later, it was shown that plastic activity in model structural glasses and soft-sphere packings is intimately linked to nonphononic low-frequency modes Tanguy et al. (2010); Manning and Liu (2011); Rottler et al. (2014).
It was, however, only recently that the universal statistical and structural properties of soft quasilocalized modes in glasses were revealed, first in a Heisenberg spin glass in a random field Baity-Jesi et al. (2015), and later in model structural glasses Lerner et al. (2016); Gartner and Lerner (2016); Mizuno et al. (2017); Kapteijns et al. (2018); Wang et al. (2019). It is now well accepted that the density of nonphononic quasilocalized modes of frequency grows from zero (i.e. without a gap) as , independently of microscopic details Lerner et al. (2016), preparation protocol Lerner and Bouchbinder (2018a), or spatial dimension Kapteijns et al. (2018). Importantly, as shown in Wang et al. (2019) and demonstrated again in this work, the distribution of quasilocalized modes persists even in inherent states that underlie very deeply supercooled states, i.e. in stable computer glasses whose stability is comparable to conventional laboratory glasses. Furthermore, soft quasilocalized modes have been shown to generically feature a disordered core of linear size of a few particle spacings, decorated by long-range Eshelby-like displacement fields whose amplitude decays as at a distance from the core, in spatial dimensions Lerner et al. (2016); Kapteijns et al. (2018).
 |
The key challenge in revealing the statistical, structural and energetic properties of soft quasilocalized modes — to be termed hereafter QLMs — in computer investigations lies in the abundance of spatially-extended low-frequency phonons in structural glasses Gartner and Lerner (2016); Bouchbinder and Lerner (2018). These phononic excitations hybridize with quasilocalized excitations, as pointed out decades ago by Schober and Oligschleger Schober and Oligschleger (1996). These hybridization processes hinder the accessibility of crucial information regarding characteristic length and frequency scales of QLMs, and regarding their prevalence.
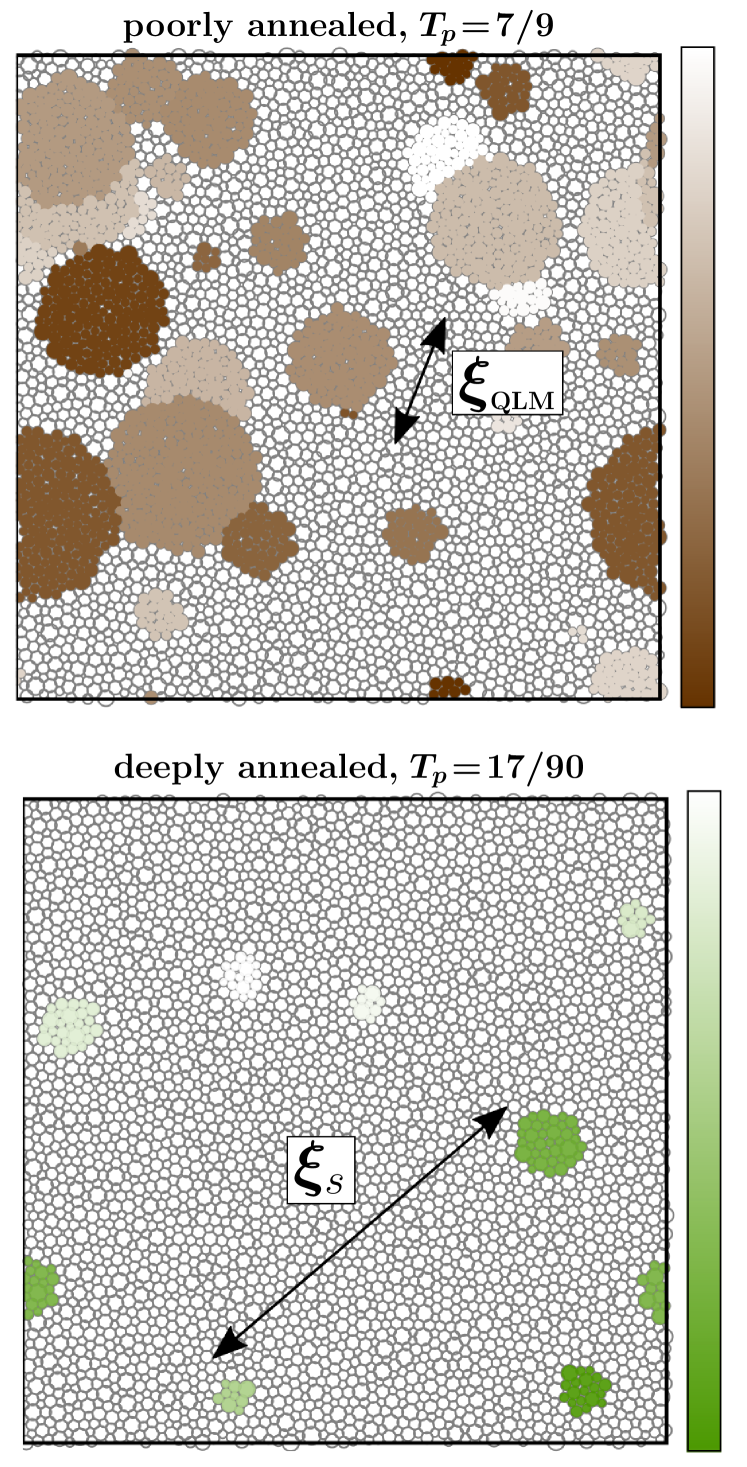
While promising attempts to overcome the aforementioned hybridization issues have been put forward Schober and Oligschleger (1996); Gartner and Lerner (2016); Zylberg et al. (2017); Wijtmans and Manning (2017), a complete statistical-mechanical picture of QLMs is still lacking. In particular, recent work has revealed that annealing processes affect QLMs in three ways: firstly, the number of QLMs appears to decrease upon deeper annealing, i.e. they are depleted, as first pointed out in Lerner and Bouchbinder (2017, 2018a). Secondly, the core size of QLMs, , was shown to decrease with deeper annealing Lerner et al. (2016); Lerner and Bouchbinder (2018b). Lastly, in Lerner et al. (2016); Lerner and Bouchbinder (2018a) it was shown that the characteristic frequencies of QLMs also increase upon deeper annealing, i.e. they stiffen, in addition to their depletion. These three effects, and other concepts discussed below, are graphically illustrated in Fig. 1.
In this work, we investigate the effect of very deep supercooling/annealing on the statistical, structural and energetic properties of QLMs in a model computer glass (see Methods section for details). First, we explain why information regarding the number of QLMs cannot typically be obtained from the universal vibrational density of states (vDOS) of QLMs alone. Instead, we show that the vDOS grants access to a composite physical observable, which encodes information regarding both the characteristic frequency scale of QLMs, , and their number, . Then, following recent suggestions Yan et al. (2016); Lerner and Bouchbinder (2018a), we use the average response of the glass to a local pinch — more formally, we use the bulk-average response of a glass to force dipoles — as a measure of . This assumption, in turn, allows us to quantitatively disentangle the processes of annealing-induced stiffening of QLMs from their annealing-induced depletion.
Interestingly, this analysis reveals that follows an equilibrium-like Boltzmann relation , with denoting the parent temperature from which glassy states are quenched, is Boltzmann’s constant, and is the energetic cost of creating a QLM. That is, our results indicate that QLMs behave as “quasiparticles” whose number is determined by equilibrium statistical thermodynamics at the parent equilibrium temperature , and that this number is preserved when the glass goes out-of-equilibrium during a quick quench to a temperature much smaller than . The QLMs thus appear to correspond to configurational degrees of freedom that carry memory of the equilibrium state at , deep into the non-equilibrium glassy state, and in this sense has a clear thermodynamic interpretation as a non-equilibrium temperature. This physical picture has been for quite some time the cornerstone of the non-equilibrium thermodynamic Shear-Transformation-Zones (STZs) theory of glass deformation Bouchbinder and Langer (2009a, b); Falk and Langer (2011), where is termed a fictive/effective/configurational temperature, once QLMs are identified with STZs, i.e. with glassy “flow defects” Falk and Langer (1998).
Furthermore, we show that can be used to define a length that appears to match the independently determined core size of QLMs, argued to mark the crossover between the disorder-dominated elastic response of glasses at the mesoscale, and the continuum-like elastic response at the macroscale Lerner et al. (2014). Taken together, these results show that important physical information, which is relevant for various key questions concerning the formation, relaxation and flow of glasses, can be obtained through pinching a glass.
II The QLMs depletion versus stiffening conundrum
It is now established that the vDOS of QLMs, , follows a universal gapless law Lerner et al. (2016); Gartner and Lerner (2016); Mizuno et al. (2017); Kapteijns et al. (2018); Wang et al. (2019)
| (1) |
where is the upper cutoff of this scaling regime and the prefactor is extensively discussed below. The law has been rationalized by various models Ilyin et al. (1987); Buchenau et al. (1991); Gurevich et al. (2003); Parshin et al. (2007); Benetti et al. (2018); Stanifer et al. (2018); Ikeda (2019); Shimada et al. (2017), and is known to be intimately related to the existence of frustration-induced internal stresses in glasses Lerner and Bouchbinder (2018b), but its theoretical foundations are not yet fully developed. The prefactor in (1) (denoted by in Wang et al. (2019); Ikeda (2019); Ji et al. (2019a)) is a non-universal quantity that encodes information about a particular glassy state, most notably its composition (constituent elements, interaction potential etc.) and its preparation protocol Lerner and Bouchbinder (2017, 2018a); Wang et al. (2019). The ultimate goal of this work is to explore the physical information encapsulated in and its dependence on the glass preparation protocol.
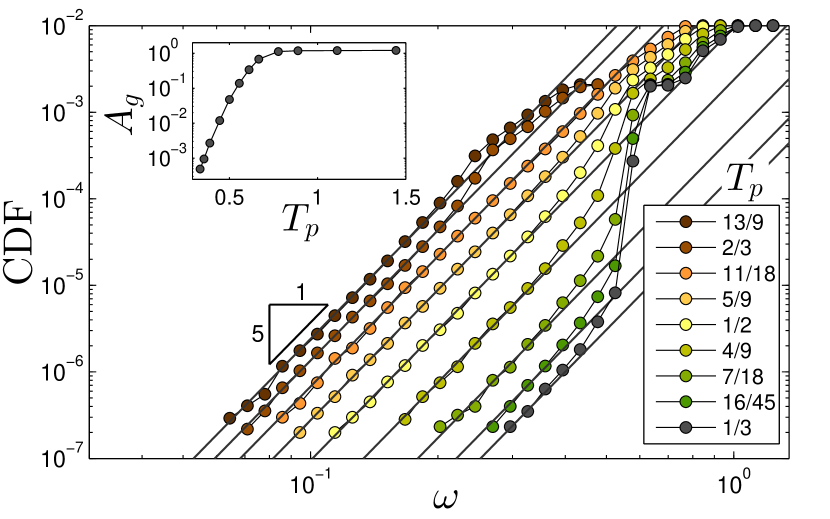 |
In Fig. 2, we plot the cumulative vDOS calculated for glassy samples rapidly quenched from parent equilibrium temperatures (as appears in the figure legend) to zero temperature. The system size is chosen so as to avoid hybridization with phonons at the lowest frequencies, as explained in Lerner et al. (2016). The figure shows, in agreement with Wang et al. (2019), that the scaling persists all the way down to the deepest supercooled states accessible to us, (the units used to report are defined below). The inset shows that the prefactor varies by nearly orders of magnitude in the simulated range. The huge variability of with the preparation protocol, here quantified by the parent equilibrium temperature , indicates dramatic changes in the resulting glassy states, despite the fact that all of them follow the universal law.
What physics is encapsulated in ? To start addressing this question, let us first consider the dimensions of . When is integrated over the frequency range in which (1) is valid, i.e. in the range , one obtains an estimate for the total number of QLMs, . Consequently, has the dimensions of an inverse frequency to the fifth power, where the dimensionless prefactor is proportional to . Since follows a power-law, i.e. it is scale-free in the range , the only possible frequency scale that can appear in it is the upper cutoff . Hence, we expect to have , which implies that (1) should be rewritten as
| (2) |
We would like to note the analogy, and the fundamental difference, between (2) and Debye’s vDOS of (acoustic) phononic excitations in crystalline solids Kittel (2005). The latter takes the form (in three dimensions), with , where is Debye’s frequency and is the number of particles. The integral over in the range equals the number of degrees of freedom in the system, . The analogy between Debye’s vDOS and the glassy vDOS in (2), and between and Debye’s frequency, is evident. Yet, there is a crucial difference between the two cases; in Debye’s theory the number of phononic excitations is a priori known to equal the number of degrees of freedom (in fact, is precisely defined so as to ensure the latter). In the glassy case, however, there is neither an a priori constraint on the number of QLMs , nor on the upper frequency cutoff (the total number of vibrational modes, both glassy and phononic, is of course still determined by the total number of degrees of freedom, but there is no a priori constraint on the fraction of QLMs out of the total number of vibrational modes). Hence, and should be treated as independent quantities that can feature different dependencies on the glass history (preparation protocol).
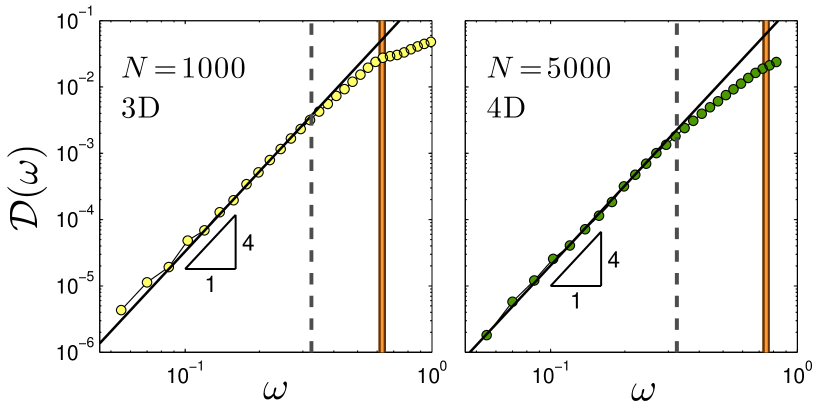 |
In order to disentangle the number of QLMs () and their characteristic frequency () contributions to , one needs to estimate one of them, i.e. either or , independently of . In principle, as the characteristic frequency represents the upper cutoff on the scaling regime (as explained above), one can try to estimate it through the deviation from the universal law. This has been, in fact, demonstrated in Kapteijns et al. (2018) for rapidly quenched glassy samples in a narrow range of system sizes, in three and four dimensions. Some of the data appearing in Fig. 2b-c of Kapteijns et al. (2018) are reproduced here in Fig. 3, where the lowest phononic band is shown in orange in each panel. It is observed that in these examples, the vDOS deviates from the scaling at a frequency smaller than the lowest phonon frequency, which can be identified with (marked by the vertical dashed lines).
In general, though, the lowest phonon frequency is in fact smaller than , which obscures the identification of the latter due to hybridizations Bouchbinder and Lerner (2018). Indeed, in Fig. 2 it is observed that as decreases, the lowest phonon band pushes the vDOS upwards in the middle of the scaling regime, disallowing to extract . Hence, we conclude that the vDOS alone does not allow one to distinguish between changes in the number of QLMs (e.g. a decrease, i.e. depletion) and in their characteristic frequency (e.g. an increase, i.e. stiffening). How to disentangle the and dependence of , and the possible depletion and stiffening of QLMs associated with them, is the question we address next.
III Estimating QLMs frequency scale by pinching a glass
The previous discussion showed that the dependence of cannot be readily used to extract the dependence of and separately. Consequently, one needs additional physical input in order to disentangle the two quantities. Here we follow the suggestion put forward in Lerner and Bouchbinder (2018a) that the characteristic frequency of QLMs can be probed through pinching a glass. Formally, by pinching we mean applying a force dipole to a pair of interacting particles in a glassy sample. The displacement response to , which was shown to closely resemble the spatial pattern of QLMs Lerner and Bouchbinder (2018a), can be associated with a frequency (see additional details in the SI). By averaging over many interacting pairs in a glassy sample, one obtains a characteristic frequency scale, which was proposed to represent . This suggestion was discussed at length and tested, under various circumstances, in Lerner and Bouchbinder (2018a); here we follow it, i.e. assume that the dependence of the dipole response is proportional to . The remainder of the paper is devoted to exploring the implications of this assumption.
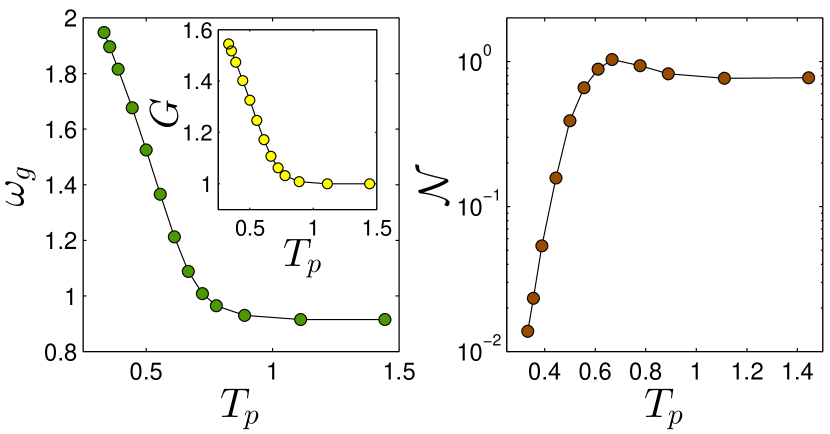 |
In Fig. 4a we plot the characteristic frequency vs. the parent temperature , where is estimated by the pinching procedure just described. It is observed that varies by nearly a factor of at low parent temperatures and reaches a plateau at higher . We further find that the sample-to-sample mean athermal shear modulus, , shown in the inset, also plateaus at the same as does. Consequently, in what follows we conveniently express temperatures in terms of the onset temperature of the high- plateaus of and .
We conclude that, in the range considered here, QLMs appear to stiffen by a factor of approximately 2 with decreasing . Interestingly, in Wang et al. (2019) it was reported that the boson peak frequency varies by approximately a factor of 2 over a similar range of , suggesting that and might be related. In Yan et al. (2016), a similar proposition was put forward in the context of the unjamming transition O’Hern et al. (2003); Liu and Nagel (2010); van Hecke (2010), where it was argued that the renowned ‘unjamming’ frequency scale O’Hern et al. (2003); Wyart (2005) can be extracted by considering the frequencies associated with the responses to a local pinch. However, since and may differ DeGiuli et al. (2014), it is not currently clear which of these frequencies is better represented by .
The stiffening of QLMs by a factor of approximately accounts for an approximate -fold variation of , due to the dependence in (2). The remaining variation is attributed to the number of QLMs, (note that here we use an equality, as the -independent prefactor is of no interest), plotted in Fig. 4b. The result indicates that QLMs are depleted by slightly less than orders of magnitude in the simulated range. The strong depletion of QLMs upon deeper supercooling has dramatic consequences for the properties of the resulting glassy states. For example, brittle failure Popović et al. (2018); Ozawa et al. (2018) and reduced fracture toughness Rycroft and Bouchbinder (2012); Vasoya et al. (2016); Ketkaew et al. (2018) are claimed to be a consequence of this depletion. It is interesting to note that the range of variability observed in Fig. 4b appears to be consistent with a very recent study Khomenko et al. (2019) of the depletion of tunneling two-level systems in stable computer glasses, possibly indicating that a subset of the QLMs is associated with tunneling two-level systems Ilyin et al. (1987); Buchenau et al. (1991); Gartner and Lerner (2016); Ji et al. (2019b).
The results presented in Fig. 4 demonstrate that pinching a glass may offer a procedure to separate the depletion and stiffening processes that take place with progressive supercooling. Next, we aim at exploring the physical implications of disentangling and .
IV A thermodynamic signature of the QLMs
QLMs correspond to compact zones (though they also have long-range elastic manifestations), which are embedded inside a glass, and characterized by particularly soft structures. It is tempting then to think of them as quasiparticles that feature well defined properties (e.g. formation energy). If true, one may hypothesize that QLMs can be created and annihilated by thermodynamic fluctuations and follow an equilibrium distribution at the parent equilibrium temperatures . Moreover, their equilibrium thermodynamic nature might be manifested in non-equilibrium glassy states as they become frozen in during the rapid quench upon glass formation.
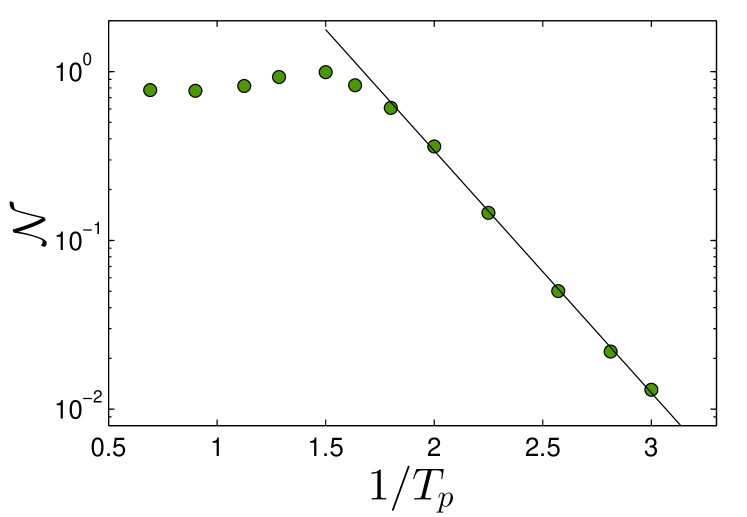 |
As we have now at hand an estimate of the number as a function of (cf. Fig. 4b), we can start testing these ideas. To this aim, we plot in Fig. 5 vs. on a semilogarithmic scale; the outcome reveals a key result: the number of QLMs follows a Boltzmann-like law, with the parent temperature playing the role of the equilibrium temperature, namely
| (3) |
A possibly related Boltzmann-like law, albeit for itself, was observed in Ji et al. (2019a) for reheated stable glasses Kapteijns et al. (2019). A corollary of (3) is that QLMs seem to feature a well-defined formation energy, (in units of ). It is surprising that appears to be independent of , while the characteristic energy scale associated with does appear to depend on it. Future research should shed additional light on this non-trivial observation.
The results in (3) and Fig. 5 indicate that QLMs might indeed correspond to a subset of configurational degrees of freedom that equilibrate at the parent temperature and that carry memory of their equilibrium distribution when the glass goes out-of-equilibrium during a quench to lower temperatures. This physical picture strongly resembles the idea of a fictive/effective/configurational temperature, which was quite extensively used in models of the relaxation, flow and deformation of glasses Tool (1946); Narayanaswamy (1971); Angell et al. (2000); Mauro et al. (2009); Bouchbinder and Langer (2009a, b); Falk and Langer (2011). This connection is further strengthened in light of available evidence indicating that the cores of deformation-coupled QLMs are the loci of irreversible plastic events that occur once a glass is driven by external forces Maloney and Lemaître (2004); Lerner (2016); Schwartzman-Nowik et al. (2019).
The Boltzmann-like relation in (3), when interpreted in terms of STZs, is a cornerstone of the non-equilibrium thermodynamic STZ theory of the glassy deformation Bouchbinder and Langer (2009a, b); Falk and Langer (2011), where is treated as a thermodynamic temperature that characterizes configurational degrees of freedom and that differs from the bath temperature. The strong depletion of STZs with decreasing , as predicted by the Boltzmann-like relation, was shown to give rise to a ductile-to-brittle transition in the fracture toughness of glasses Rycroft and Bouchbinder (2012); Vasoya et al. (2016). This prediction was recently supported by experiments on the toughness of Bulk Metallic Glasses (BMGs), where was carefully controlled and varied Ketkaew et al. (2018).
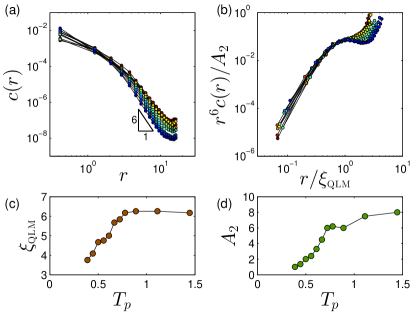
It is natural to define a length scale corresponding to the typical distance between QLMs as , once an estimate of their number is at hand. Such a “site length” was introduced in Lerner et al. (2016), where it was related to the sample-to-sample average minimal QLM frequency according to . The latter implies that the lowest QLM frequency is selected among possible candidates, which is directly related to the extreme value statistics of Lerner et al. (2016). The site length is expected to control finite-size effects in studies of athermal plasticity in stable glasses, as discussed in detail in Lerner et al. (2018). Similar definitions of a site length were proposed in Karmakar et al. (2012); Lerner et al. (2018); an important message here is that the disentangling of the stiffening effect from the prefactor is imperative for the purpose of obtaining a consistent definition of a length scale in such a setting.
V A glassy length scale revealed by pinching a glass
What additional physics can pinching a glass reveal? Up to now we explored the physics of the QLMs number ; we now turn to the other contribution to , i.e. to the frequency scale that characterizes the typical stiffness of QLMs. was shown to undergo stiffening with decreasing (cf. Fig. 4a); is this stiffening related to other properties of QLMs that vary with ? An interesting possibility we explore here is whether it might be related to a glassy length scale that is associated with QLMs.
To that aim, we construct a length scale as
| (4) |
which corresponds to the wavelength of transverse phonons propagating at the shear wave-speed with an angular frequency . This length is similar in spirit to the “boson peak” length Hong et al. (2011). The physical rationale behind our constructed length is that the emerging length scale is expected to mark a crossover in the elastic response of a glass to a local pinch, as discussed below. In Fig. 6 we plot vs. the parent temperature ; we find that decreases upon deeper annealing by approximately 40%, a manifestation of the modest stiffening of the macroscopic shear modulus compared to that of QLMs (recall that is proportional to the square root of the shear modulus). This decreasing length is of unique character amongst the plethora of glassy lengthscales previously put forward in the context of the glass transition, most of which are increasing functions of decreasing temperature or parent temperature Bouchaud and Biroli (2004); Montanari and Semerjian (2006); Biroli et al. (2008); Hocky et al. (2012); Royall and Williams (2015); Karmakar et al. (2014).
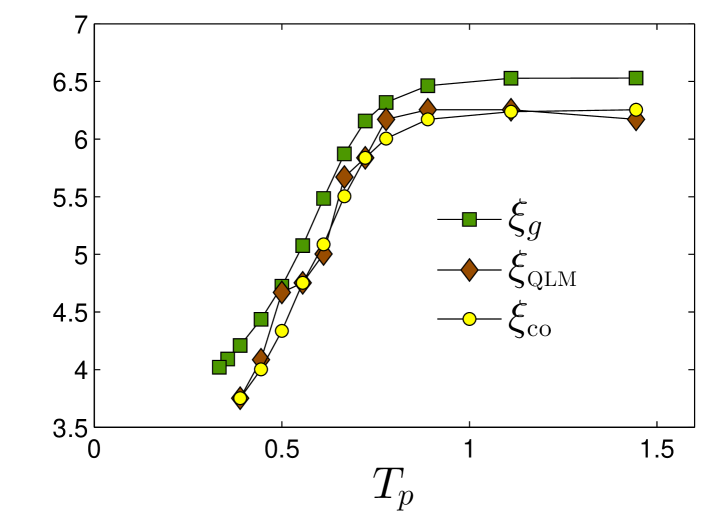 |
In order to shed light on the physical meaning of , we consider also the crossover length as observed in the displacement response to local pinches, between an atomistic-disorder-dominated response at distances from the perturbation, to the expected continuum behavior seen at , and the core size of QLMs, , which is known to decrease upon annealing Lerner and Bouchbinder (2017, 2018b); Wang et al. (2019), as is also illustrated graphically in Fig. 1. In Fig. 6 we directly compare between and our measurements of and (see SI for details). These three lengthscales feature very similar variations with , strongly supporting their equivalence. Consequently, — which was defined through the dipole response frequency (cf. (4)) — seems to provide a measure of the core size of QLMs, and in light of the suggested relation between the latter and STZs, also of the size of STZs.
Additional insight may be gained by invoking the relation — established in Yan et al. (2016) — between and the characteristic frequency that emerges near the unjamming transition O’Hern et al. (2003); Liu and Nagel (2010); van Hecke (2010). Indeed, in the unjamming scenario the length (often denoted ) was shown to diverge upon approaching the unjamming point Lerner et al. (2014), and to mark the crossover between disorder-dominated responses near a local perturbation, and the continuum-like response observed in the far field, away from the perturbation. The same length was shown in Shimada et al. (2018) to characterize the core size of QLMs near the unjamming point of harmonic-sphere packings. In light of the results shown in Fig. 6, we hypothesize that the fundamental crossover length — below which responses to local perturbations are microstructural/disorder-dominated, and above which responses to local perturbations follow the expected continuum-like behavior — is, in fact, , which, in turn, we show to agree well with the size of QLMs.
VI Summary and outlook
In this work we have employed a computer glass model, which can be deeply annealed Ninarello et al. (2017), to quantitatively study the variation of the properties of QLMs (soft spots) with the depth of annealing. Most notably, we calculated the variation of the number, characteristic frequency and core size of QLMs with the parent temperature from which the glass is formed. This has been achieved by assuming that the characteristic frequency scale of QLMs can be estimated through the bulk-average response of a glass to a local pinch. This frequency scale, in turn, allowed us to disentangle the apparently inseparable effects of the depletion and stiffening of QLMs, which are both encoded in the prefactor of the universal vibrational density of states of QLMs.
We found that the number of QLMs follows a Boltzmann-like factor, with the parent temperature — from which equilibrium configurations were vitrified — playing the role of the equilibrium temperature. Consequently, the parent temperature may be regarded as a non-equilibrium temperature that characterizes QLMs deep inside the glassy state. Furthermore, our analysis reveals that both the core size of QLMS, and the mesoscopic length scale that marks the crossover between atomistic-disorder-dominated responses near local perturbations, and continuum like responses far away from local perturbations, can be estimated using the characteristic frequency of QLMs — obtained by pinching the glass —, and the speed of shear waves.
Our results may have important implications for various basic problems in glass physics. We mention a few of them here; first, the Boltzmann-like law of the number of QLMs may play a major role in theories of the relaxation, flow and deformation of glasses, and may support some existing approaches. Second, together with other available observations Yan et al. (2016); Wang et al. (2019); Shimada et al. (2018), our results may suggest that the boson peak frequency could be robustly probed by pinching glassy samples, instead of the more involved analysis required otherwise Marruzzo et al. (2013); Wang et al. (2019). Finally, the variation of the energy scale proportional to with annealing temperature appears to match very well the variation of activation barriers required to rationalize fragility measurements in laboratory glasses (compare Fig. 4a with Fig. 8 of Tarjus et al. (2004)). If valid, our results appear to support elasticity-based theories of the glass transition Dyre et al. (2006); Brito et al. (2018); Wyart and Cates (2017), and indicate that QLMs play important roles in relaxation processes in deeply supercooled liquids Widmer-Cooper et al. (2008). We hope that these interesting investigation directions will be pursued in the near future.
Appendix A Models and methods
We employed a computer glass forming model in three dimensions, simulated using the swap Monte-Carlo method, explained e.g. in Ninarello et al. (2017). The model consists of soft repulsive spheres interacting via a pairwise potential (with denoting the distance between the centers of a pair of particles), enclosed in a fixed-volume box with periodic boundary conditions. The particles’ sizes are drawn from a distribution designed such that crystallization is avoided Ninarello et al. (2017). A comprehensive description of the model, and of all parameter choices, can be found in Lerner (2019), including an important discussion about how we handled large sample-to-sample realization fluctuations of particle sizes that can arise in small system sizes due to the breadth of the employed particle size distribution. Ensembles of 10000, 1000, and 2000 glassy samples were made for systems of and 16000 particles, respectively, by instantaneously-quenching (to zero temperature) independent configurations equilibrated at various parent temperatures . All data except for those shown in Fig. 6 were calculated using the smaller glasses. Lengths are expressed in terms of where is the system’s volume. All particles share the same mass , which we set as our microscopic unit of mass. Frequencies are expressed in terms of , where is the high- shear wave-speed, with denoting the high- sample-to-sample mean athermal shear modulus, and denotes the mass density. is expressed in terms of the crossover temperature , above which the sample-to-sample mean athermal shear modulus saturates to a high-temperature plateau, as shown in the inset of Fig. 4a and in Lerner (2019). In our model we find . Data will be made available upon request from the corresponding author.
Acknowledgements.
We thank David Richard for his help with our graphics. Fruitful discussions with David Richard and Geert Kapteijns are warmly acknowledged. E. B. acknowledges support from the Minerva Foundation with funding from the Federal German Ministry for Education and Research, the Ben May Center for Chemical Theory and Computation, and the Harold Perlman Family. E. L. acknowledges support from the Netherlands Organisation for Scientific Research (NWO) (Vidi grant no. 680-47-554/3259).References
- Ilyin et al. (1987) M. Ilyin, V. Karpov, and D. Parshin, Parameters of soft atomic potentials in glasses, Zh. Eksp. Teor. Fiz. 92, 291 (1987).
- Buchenau et al. (1991) U. Buchenau, Y. M. Galperin, V. L. Gurevich, and H. R. Schober, Anharmonic potentials and vibrational localization in glasses, Phys. Rev. B 43, 5039 (1991).
- Gurevich et al. (2003) V. L. Gurevich, D. A. Parshin, and H. R. Schober, Anharmonicity, vibrational instability, and the boson peak in glasses, Phys. Rev. B 67, 094203 (2003).
- Parshin et al. (2007) D. A. Parshin, H. R. Schober, and V. L. Gurevich, Vibrational instability, two-level systems, and the boson peak in glasses, Phys. Rev. B 76, 064206 (2007).
- Wyart (2005) M. Wyart, On the rigidity of amorphous solids, Ann. Phys. Fr. 30, 1 (2005).
- Wyart (2010) M. Wyart, Scaling of phononic transport with connectivity in amorphous solids, Europhys. Lett. 89, 64001 (2010).
- Schirmacher (2006) W. Schirmacher, Thermal conductivity of glassy materials and the boson peak, Europhys. Lett. 73, 892 (2006).
- Schirmacher et al. (2007) W. Schirmacher, G. Ruocco, and T. Scopigno, Acoustic attenuation in glasses and its relation with the boson peak, Phys. Rev. Lett. 98, 025501 (2007).
- Marruzzo et al. (2013) A. Marruzzo, W. Schirmacher, A. Fratalocchi, and G. Ruocco, Heterogeneous shear elasticity of glasses: the origin of the boson peak, Sci. Rep. 3, 1407 EP (2013), article.
- DeGiuli et al. (2014) E. DeGiuli, A. Laversanne-Finot, G. During, E. Lerner, and M. Wyart, Effects of coordination and pressure on sound attenuation, boson peak and elasticity in amorphous solids, Soft Matter 10, 5628 (2014).
- Franz et al. (2015) S. Franz, G. Parisi, P. Urbani, and F. Zamponi, Universal spectrum of normal modes in low-temperature glasses, Proc. Natl. Acad. Sci. U.S.A. 112, 14539 (2015).
- Beltukov (2015) Y. M. Beltukov, Random matrix theory approach to vibrations near the jamming transition, JETP Letters 101, 345 (2015).
- Lerner et al. (2016) E. Lerner, G. Düring, and E. Bouchbinder, Statistics and properties of low-frequency vibrational modes in structural glasses, Phys. Rev. Lett. 117, 035501 (2016).
- Kapteijns et al. (2018) G. Kapteijns, E. Bouchbinder, and E. Lerner, Universal nonphononic density of states in 2d, 3d, and 4d glasses, Phys. Rev. Lett. 121, 055501 (2018).
- Lerner and Bouchbinder (2018a) E. Lerner and E. Bouchbinder, A characteristic energy scale in glasses, J. Chem. Phys. 148, 214502 (2018a).
- Stanifer et al. (2018) E. Stanifer, P. K. Morse, A. A. Middleton, and M. L. Manning, Simple random matrix model for the vibrational spectrum of structural glasses, Phys. Rev. E 98, 042908 (2018).
- Benetti et al. (2018) F. P. C. Benetti, G. Parisi, F. Pietracaprina, and G. Sicuro, Mean-field model for the density of states of jammed soft spheres, Phys. Rev. E 97, 062157 (2018).
- Ikeda (2019) H. Ikeda, Universal non-mean-field scaling in the density of states of amorphous solids, Phys. Rev. E 99, 050901 (2019).
- Shimada et al. (2017) M. Shimada, H. Mizuno, and A. Ikeda, Vibrational spectrum derived from the local mechanical response in disordered solids, arXiv preprint arXiv:1907.06851 (2017).
- Zeller and Pohl (1971) R. C. Zeller and R. O. Pohl, Thermal conductivity and specific heat of noncrystalline solids, Phys. Rev. B 4, 2029 (1971).
- Anderson et al. (1972) P. W. Anderson, B. I. Halperin, and C. M. Varma, Anomalous low-temperature thermal properties of glasses and spin glasses, Philos. Mag. 25, 1 (1972).
- Phillips (1972) W. Phillips, Tunneling states in amorphous solids, J. Low Temp. Phys. 7, 351 (1972).
- Schuh et al. (2007) C. A. Schuh, T. C. Hufnagel, and U. Ramamurty, Mechanical behavior of amorphous alloys, Acta Materialia 55, 4067 (2007).
- Hufnagel et al. (2016) T. C. Hufnagel, C. A. Schuh, and M. L. Falk, Deformation of metallic glasses: Recent developments in theory, simulations, and experiments, Acta Mater. 109, 375 (2016).
- Gelin et al. (2016) S. Gelin, H. Tanaka, and A. Lemaître, Anomalous phonon scattering and elastic correlations in amorphous solids, Nat. Mater. 15, 1177 (2016).
- Mizuno and Ikeda (2018) H. Mizuno and A. Ikeda, Phonon transport and vibrational excitations in amorphous solids, Phys. Rev. E 98, 062612 (2018).
- Moriel et al. (2019) A. Moriel, G. Kapteijns, C. Rainone, J. Zylberg, E. Lerner, and E. Bouchbinder, Wave attenuation in glasses: Rayleigh and generalized-rayleigh scattering scaling, J. Chem. Phys. 151, 104503 (2019).
- Laird and Schober (1991) B. B. Laird and H. R. Schober, Localized low-frequency vibrational modes in a simple model glass, Phys. Rev. Lett. 66, 636 (1991).
- Schober and Laird (1991) H. R. Schober and B. B. Laird, Localized low-frequency vibrational modes in glasses, Phys. Rev. B 44, 6746 (1991).
- Schober et al. (1993) H. Schober, C. Oligschleger, and B. Laird, Low-frequency vibrations and relaxations in glasses, J. Non-Cryst. Solids 156-158, 965 (1993).
- Widmer-Cooper et al. (2008) A. Widmer-Cooper, H. Perry, P. Harrowell, and D. R. Reichman, Irreversible reorganization in a supercooled liquid originates from localized soft modes, Nature Phys. 4, 711 (2008).
- Tanguy et al. (2010) A. Tanguy, B. Mantisi, and M. Tsamados, Vibrational modes as a predictor for plasticity in a model glass, Europhys. Lett. 90, 16004 (2010).
- Manning and Liu (2011) M. L. Manning and A. J. Liu, Vibrational modes identify soft spots in a sheared disordered packing, Phys. Rev. Lett. 107, 108302 (2011).
- Rottler et al. (2014) J. Rottler, S. S. Schoenholz, and A. J. Liu, Predicting plasticity with soft vibrational modes: From dislocations to glasses, Phys. Rev. E 89, 042304 (2014).
- Baity-Jesi et al. (2015) M. Baity-Jesi, V. Martín-Mayor, G. Parisi, and S. Perez-Gaviro, Soft modes, localization, and two-level systems in spin glasses, Phys. Rev. Lett. 115, 267205 (2015).
- Gartner and Lerner (2016) L. Gartner and E. Lerner, Nonlinear modes disentangle glassy and Goldstone modes in structural glasses, SciPost Phys. 1, 016 (2016).
- Mizuno et al. (2017) H. Mizuno, H. Shiba, and A. Ikeda, Continuum limit of the vibrational properties of amorphous solids, Proc. Natl. Acad. Sci. U.S.A. 114, E9767 (2017).
- Wang et al. (2019) L. Wang, A. Ninarello, P. Guan, L. Berthier, G. Szamel, and E. Flenner, Low-frequency vibrational modes of stable glasses, Nat. Commun. 10, 26 (2019).
- (39) G. Kapteijns, D. Richard, M. Wesseling, and E. Lerner, Nonlinear quasilocalized excitations in glasses. ii. detection of the complete field of low-energy excitations, in preparation.
- Bouchbinder and Lerner (2018) E. Bouchbinder and E. Lerner, Universal disorder-induced broadening of phonon bands: from disordered lattices to glasses, New J. Phys. 20, 073022 (2018).
- Schober and Oligschleger (1996) H. R. Schober and C. Oligschleger, Low-frequency vibrations in a model glass, Phys. Rev. B 53, 11469 (1996).
- Zylberg et al. (2017) J. Zylberg, E. Lerner, Y. Bar-Sinai, and E. Bouchbinder, Local thermal energy as a structural indicator in glasses, Proc. Natl. Acad. Sci. U.S.A. 114, 7289 (2017).
- Wijtmans and Manning (2017) S. Wijtmans and M. L. Manning, Disentangling defects and sound modes in disordered solids, Soft Matter 13, 5649 (2017).
- Lerner and Bouchbinder (2017) E. Lerner and E. Bouchbinder, Effect of instantaneous and continuous quenches on the density of vibrational modes in model glasses, Phys. Rev. E 96, 020104 (2017).
- Lerner and Bouchbinder (2018b) E. Lerner and E. Bouchbinder, Frustration-induced internal stresses are responsible for quasilocalized modes in structural glasses, Phys. Rev. E 97, 032140 (2018b).
- Yan et al. (2016) L. Yan, E. DeGiuli, and M. Wyart, On variational arguments for vibrational modes near jamming, Europhys. Lett. 114, 26003 (2016).
- Bouchbinder and Langer (2009a) E. Bouchbinder and J. S. Langer, Nonequilibrium thermodynamics of driven amorphous materials. ii. effective-temperature theory, Phys. Rev. E 80, 031132 (2009a).
- Bouchbinder and Langer (2009b) E. Bouchbinder and J. S. Langer, Nonequilibrium thermodynamics of driven amorphous materials. iii. shear-transformation-zone plasticity, Phys. Rev. E 80, 031133 (2009b).
- Falk and Langer (2011) M. L. Falk and J. Langer, Deformation and failure of amorphous, solidlike materials, Annu. Rev. Condens. Matter Phys. 2, 353 (2011).
- Falk and Langer (1998) M. L. Falk and J. S. Langer, Dynamics of viscoplastic deformation in amorphous solids, Phys. Rev. E 57, 7192 (1998).
- Lerner et al. (2014) E. Lerner, E. DeGiuli, G. During, and M. Wyart, Breakdown of continuum elasticity in amorphous solids, Soft Matter 10, 5085 (2014).
- Ji et al. (2019a) W. Ji, T. W. de Geus, M. Popović, E. Agoritsas, and M. Wyart, Thermal origin of quasi-localised excitations in glasses, arXiv preprint arXiv:1912.10537 (2019a).
- Kittel (2005) C. Kittel, Introduction to solid state physics (Wiley, 2005).
- O’Hern et al. (2003) C. S. O’Hern, L. E. Silbert, A. J. Liu, and S. R. Nagel, Jamming at zero temperature and zero applied stress: The epitome of disorder, Phys. Rev. E 68, 011306 (2003).
- Liu and Nagel (2010) A. J. Liu and S. R. Nagel, The jamming transition and the marginally jammed solid, Annu. Rev. Condens. Matter Phys. 1, 347 (2010).
- van Hecke (2010) M. van Hecke, Jamming of soft particles: geometry, mechanics, scaling and isostaticity, J. Phys.: Condens. Matter 22, 033101 (2010).
- Popović et al. (2018) M. Popović, T. W. J. de Geus, and M. Wyart, Elastoplastic description of sudden failure in athermal amorphous materials during quasistatic loading, Phys. Rev. E 98, 040901 (2018).
- Ozawa et al. (2018) M. Ozawa, L. Berthier, G. Biroli, A. Rosso, and G. Tarjus, Random critical point separates brittle and ductile yielding transitions in amorphous materials, Proc. Natl. Acad. Sci. U.S.A. 115, 6656 (2018).
- Rycroft and Bouchbinder (2012) C. H. Rycroft and E. Bouchbinder, Fracture toughness of metallic glasses: Annealing-induced embrittlement, Phys. Rev. Lett. 109, 194301 (2012).
- Vasoya et al. (2016) M. Vasoya, C. H. Rycroft, and E. Bouchbinder, Notch fracture toughness of glasses: Dependence on rate, age, and geometry, Phys. Rev. Applied 6, 024008 (2016).
- Ketkaew et al. (2018) J. Ketkaew, W. Chen, H. Wang, A. Datye, M. Fan, G. Pereira, U. D. Schwarz, Z. Liu, R. Yamada, W. Dmowski, M. D. Shattuck, C. S. O’Hern, T. Egami, E. Bouchbinder, and J. Schroers, Mechanical glass transition revealed by the fracture toughness of metallic glasses, Nat. Commun. 9, 3271 (2018).
- Khomenko et al. (2019) D. Khomenko, C. Scalliet, L. Berthier, D. R. Reichman, and F. Zamponi, Depletion of two-level systems in ultrastable computer-generated glasses, arXiv preprint arXiv:1910.11168 (2019).
- Ji et al. (2019b) W. Ji, M. Popović, T. W. J. de Geus, E. Lerner, and M. Wyart, Theory for the density of interacting quasilocalized modes in amorphous solids, Phys. Rev. E 99, 023003 (2019b).
- Kapteijns et al. (2019) G. Kapteijns, W. Ji, C. Brito, M. Wyart, and E. Lerner, Fast generation of ultrastable computer glasses by minimization of an augmented potential energy, Phys. Rev. E 99, 012106 (2019).
- Tool (1946) A. Q. Tool, Relation between inelastic deformability and thermal expansion of glass in its annealing range, J. Am. Ceram. Soc. 29, 240 (1946).
- Narayanaswamy (1971) O. Narayanaswamy, A model of structural relaxation in glass, J. Am. Ceram. Soc. 54, 491 (1971).
- Angell et al. (2000) C. A. Angell, K. L. Ngai, G. B. McKenna, P. F. McMillan, and S. W. Martin, Relaxation in glassforming liquids and amorphous solids, J. Appl. Phys. 88, 3113 (2000).
- Mauro et al. (2009) J. C. Mauro, R. J. Loucks, and P. K. Gupta, Fictive temperature and the glassy state, Journal of the American Ceramic Society 92, 75 (2009).
- Maloney and Lemaître (2004) C. Maloney and A. Lemaître, Universal breakdown of elasticity at the onset of material failure, Phys. Rev. Lett. 93, 195501 (2004).
- Lerner (2016) E. Lerner, Micromechanics of nonlinear plastic modes, Phys. Rev. E 93, 053004 (2016).
- Schwartzman-Nowik et al. (2019) Z. Schwartzman-Nowik, E. Lerner, and E. Bouchbinder, Anisotropic structural predictor in glassy materials, Phys. Rev. E 99, 060601 (2019).
- Lerner et al. (2018) E. Lerner, I. Procaccia, C. Rainone, and M. Singh, Protocol dependence of plasticity in ultrastable amorphous solids, Phys. Rev. E 98, 063001 (2018).
- Karmakar et al. (2012) S. Karmakar, E. Lerner, and I. Procaccia, Direct estimate of the static length-scale accompanying the glass transition, Physica A 391, 1001 (2012).
- Hong et al. (2011) L. Hong, V. N. Novikov, and A. P. Sokolov, Dynamic heterogeneities, boson peak, and activation volume in glass-forming liquids, Phys. Rev. E 83, 061508 (2011).
- Bouchaud and Biroli (2004) J.-P. Bouchaud and G. Biroli, On the adam-gibbs-kirkpatrick-thirumalai-wolynes scenario for the viscosity increase in glasses, J. Chem. Phys. 121, 7347 (2004).
- Montanari and Semerjian (2006) A. Montanari and G. Semerjian, Rigorous inequalities between length and time scales in glassy systems, J. Stat. Phys. 125, 23 (2006).
- Biroli et al. (2008) G. Biroli, J.-P. Bouchaud, A. Cavagna, T. S. Grigera, and P. Verrocchio, Thermodynamic signature of growing amorphous order in glass-forming liquids, Nature Physics 4, 771 EP (2008).
- Hocky et al. (2012) G. M. Hocky, T. E. Markland, and D. R. Reichman, Growing point-to-set length scale correlates with growing relaxation times in model supercooled liquids, Phys. Rev. Lett. 108, 225506 (2012).
- Royall and Williams (2015) C. P. Royall and S. R. Williams, The role of local structure in dynamical arrest, Phys. Rep. 560, 1 (2015).
- Karmakar et al. (2014) S. Karmakar, C. Dasgupta, and S. Sastry, Growing length scales and their relation to timescales in glass-forming liquids, Annu. Rev. Condens. Matter Phys. 5, 255 (2014).
- Shimada et al. (2018) M. Shimada, H. Mizuno, M. Wyart, and A. Ikeda, Spatial structure of quasilocalized vibrations in nearly jammed amorphous solids, Phys. Rev. E 98, 060901 (2018).
- Ninarello et al. (2017) A. Ninarello, L. Berthier, and D. Coslovich, Models and algorithms for the next generation of glass transition studies, Phys. Rev. X 7, 021039 (2017).
- Tarjus et al. (2004) G. Tarjus, D. Kivelson, S. Mossa, and C. Alba-Simionesco, Disentangling density and temperature effects in the viscous slowing down of glassforming liquids, J. Chem. Phys. 120, 6135 (2004).
- Dyre et al. (2006) J. C. Dyre, T. Christensen, and N. B. Olsen, Elastic models for the non-arrhenius viscosity of glass-forming liquids, J. Non-Cryst. Solids 352, 4635 (2006).
- Brito et al. (2018) C. Brito, E. Lerner, and M. Wyart, Theory for swap acceleration near the glass and jamming transitions for continuously polydisperse particles, Phys. Rev. X 8, 031050 (2018).
- Wyart and Cates (2017) M. Wyart and M. E. Cates, Does a growing static length scale control the glass transition?, Phys. Rev. Lett. 119, 195501 (2017).
- Lerner (2019) E. Lerner, Mechanical properties of simple computer glasses, J. Non-Cryst. Solids 522, 119570 (2019).
Supporting Information for: “What can be learnt from pinching a glass?”
In this Supporting Information we provide information about () how the bulk-average frequency of the response to a local pinch of the glass, denoted in the manuscript, was calculated, () how the modes in Fig. 1 of the main text were calculated, and their size estimated, and () how we estimated the crossover length and the QLMs core size , both appearing in Fig. 6 of the main text.
We recall that lengths are expressed in terms of where is the system’s volume, and denotes the number of particles. All particles share the same mass , which we set as our microscopic unit of mass. Frequencies are expressed in terms of , where is the high- shear wave-speed, with denoting the high- plateau of sample-to-sample mean athermal shear modulus of inherent states (see inset of Fig. 3a of main text), and denotes the mass density. Temperatures are expressed in terms of the crossover temperature , above which the sample-to-sample mean athermal shear modulus saturates to a high-temperature plateau, as seen in Fig. 4 of the main text, and in Lerner (2019). In our system we find , with denoting the Boltzmann constant.
S-1 The calculation of
Following Lerner and Bouchbinder (2018), we define a local dipolar force as
| (S1) |
where Roman indices denote particle indices, is the radially-symmetric pairwise potential between the and particles, and denotes the -dimensional coordinate vector of the particle. The linear displacement response to this force dipole reads
| (S2) |
where repeated indices are understood to be summed over, and
| (S3) |
is the Hessian of the potential energy . The frequency associated with the response is given by
| (S4) |
where denotes the microscopic units of mass.
We next define the conditional average
| (S5) |
where is the glass pressure (recall that in our computer glass particles interact via a purely repulsive pairwise interaction), and the triangular brackets denote an average taken over all interacting pairs for which the dimensionless pairwise force .
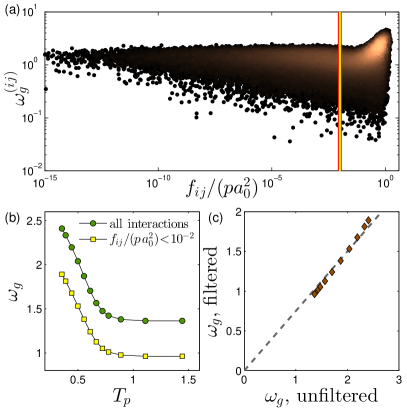
The reason we chose to only consider weak forces in the estimation of can be understood by scatter-plotting vs. , as seen in Fig. S1a. We can clearly see that two families of frequencies are generated by pinching pairs between which strong or weak forces are found. In particular, strongly-interacting pairs tend to generate much stiffer responses (note the logarithmic -axis). Since these responses are supposed to represent soft, quasilocalized modes, we opt for filtering the responses according to the dimensionless forces . Below the chosen threshold , that can be clearly read off the scatter plot Fig. S1 (vertical yellow line), the statistics of appears to saturate.
In Fig. S1b,c we examine the effect of filtering interactions by their force on the dependence of . We see that the relative variation of the two mean frequencies is very similar throughout the sampled parent-temperature range.
S-2 Calculation of soft modes in 2D
In this Section we describe how the modes shown in Fig. 1 of the main text were calculated. A detailed description of this calculation will be presented elsewhere Kapteijns et al. , and see also Kapteijns et al. (2019); here the main points are summarized.
We employed the two-dimensional version of the same computer glass model used for our study; details about the model can be found in Moriel et al. (2019). Ensembles of glassy samples were quenched from equilibrium parent temperatures of (expressed in terms of the onset temperature as described above) and . We followed the framework put forward in Gartner and Lerner (2016); Kapteijns et al. (2019), and calculated solutions to the equation
| (S6) |
where triple and quadruple contractions are denoted as and , respectively, and particle indices were suppressed for simplicity. Solutions to Eq. (S6) were coined ‘quartic modes’ Lerner and Bouchbinder (2018); Kapteijns et al. (2019); they represent soft quasilocalized excitations that resemble low-frequency quasilocalized vibrational modes seen below or in between phonon bands Gartner and Lerner (2016), i.e. in the absence of hybridizations with phonons. Solutions to Eq. (S6) were calculated by employing a standard nonlinear conjugate gradient minimization algorithm to find local minima of the cost function Gartner and Lerner (2016)
| (S7) |
where represents a displacement field in the dimensional configuration space of the glass. It is straightforward to show (see further details in Gartner and Lerner (2016)) that minima of correspond to solutions of Eq. (S6). Initial conditions for the minimization of were obtained by calculating the linear displacement response to a dipolar force, as given by Eq. (S2), for every pair of interacting particles in the glass. In Fig. 1 of the main text, we only show modes for which , where was calculated as described in the previous Section. The area of the disordered core of each of the calculated modes was estimated as , with denoting the participation ratio of the modes, defined for a normalized mode as . The participation ratio is a proxy for the degree of localization of a mode; in particular, for a localized mode one expects , whereas a spatially-extended mode would give . In Fig. 1 of the main text, the area of each blob that represents a soft mode is proportional to , and its color represents its frequency , with dark (bright) colors representing softer (stiffer) modes.
S-3 Estimation of the crossover length
In this Section we describe how we measured the crossover length between disorder-dominated responses near a local perturbation, to continuum, Eshelby-like algebraic decays away from a local perturbation. The crossover lengths extracted from the following analysis are shown in Fig. 6 of the main text.
In order to estimate the crossover length, we follow the measurement scheme of Lerner et al. (2014); this amounts to calculating the response to local dipoles via Eq. (S2), still following the dimensionless-force filtering scheme discussed above. The fields are then normalized, namely for every pair considered, we calculate . Then, for each interaction , we compute the square of the projection of the normalized response onto the normalized dipole vector , i.e. we calculate
| (S8) |
generally depends on the distance between the interactions and , and on their relative orientation.
For each normalized response field , we bin — calculated for all pairs — over the distances , and calculate the median of over all pairs located at similar distances away from the excited dipole ; the average over the excited dipole , and over glassy samples, denoted below by , defines the decay function , namely
| (S9) |
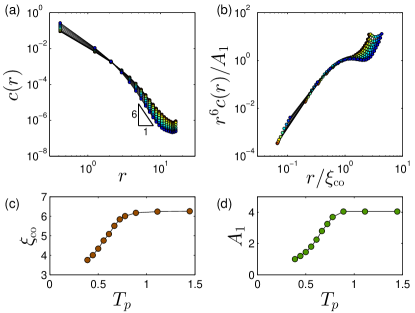
The decay functions are plotted in Fig. S2a. Continuum elasticity would predict that Lerner et al. (2014). We therefore plot in Fig. S2b the rescaled decay functions against the rescaled distance with denoting the parent-temperature dependent crossover lengths, chosen to collapse the data, as are the constants reported in Fig. S2d. The crossover lengths are plotted against the parent temperature in Fig. S2c.
S-4 Estimation of QLMs core length
In stable glasses, it becomes difficult to sample many QLMs using a harmonic analysis due to their stiffening and depletion, discussed in length the main text. As a result of these processes, characteristic frequencies of the softest QLMs tend to overlap with the lowest phonon frequencies, leading to hybridizations of phonons and QLMs, and obscuring a clear picture of QLMs properties and statistics, as demonstrated in Fig. S3.
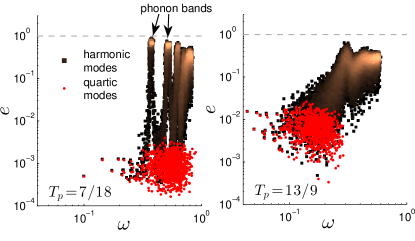
In order to reveal the properties of QLMs for glasses quenched from all parent temperatures, including in stable glasses, we opt for calculating ‘quartic modes’ as representatives of QLMs, since the former are known to be indifferent to the presence of phonons with comparable frequencies (they show no hybridizations with phonons, as shown in Gartner and Lerner (2016) and in the left panel of Fig. S3). At the same time, quartic modes feature frequencies that are in excellent agreement with QLMs’ frequencies in the absence of hybridizations Gartner and Lerner (2016), as can also be seen in Fig. S3.
We first generated, for each of our glassy samples of particles, a quartic mode as discussed in length in Sect. S-2. In this case, however, the initial conditions for finding quartic modes were chosen to be the linear displacement responses to the forces that arise due to imposing simple and pure shear Maloney and Lemaître (2006) in all possible Cartesian planes (i.e. ). Each such linear response is then used as the initial condition for the minimization of the cost function , c.f. Eq. (S7). An ensemble of QLMs is constructed by only keeping and considering the QLM with the smallest frequency amongst all those calculated for each individual sample, leaving us with 1000 soft QLMs per parent temperature .
In order to demonstrate the utility of quartic modes for the assessment of the core size of QLMs, we scatter-plot in Fig. S3 the participation ratio of both harmonic modes (obtained by a partial diagonalization of the Hessian of the potential energy), and quartic modes (obtained as described above). We show that, at the very lowest frequencies, each harmonic mode overlaps with a quartic mode that our calculation produces, demonstrating that our calculation captures well the QLM away from regimes of strong hybridizations with phonons. These data show that harmonic and quartic mode share very similar localization properties and frequencies, as also discussed in length in Gartner and Lerner (2016), which motivates employing quartic modes as faithful representitives of QLM.
In order to estimate the linear size of the cores of QLM, each calculated QLM as described above was normalized ; we then identified the pair of interacting particles that maximizes the difference squared , and consider this pair as the center of the QLM’s core. We calculated the spatial decay of QLMs similarly to the procedure explained in the previous Section for analyzing the spatial decay of the response to a local pinch, with the only differences being that here that represents the distance from the aformentioned pair ,
| (S10) |
and
| (S11) |
where the average is taken over all calculated QLMs.
References
- Lerner (2019) E. Lerner, Mechanical properties of simple computer glasses, J. Non-Cryst. Solids 522, 119570 (2019).
- Lerner and Bouchbinder (2018) E. Lerner and E. Bouchbinder, A characteristic energy scale in glasses, J. Chem. Phys. 148, 214502 (2018).
- (3) G. Kapteijns, D. Richard, M. Wesseling, and E. Lerner, Nonlinear quasilocalized excitations in glasses. ii. detection of the complete field of low-energy excitations, in preparation.
- Kapteijns et al. (2019) G. Kapteijns, D. Richard, and E. Lerner, Nonlinear quasilocalized excitations in glasses. i. true representatives of soft spots, arXiv preprint arXiv:1912.10930 (2019).
- Moriel et al. (2019) A. Moriel, G. Kapteijns, C. Rainone, J. Zylberg, E. Lerner, and E. Bouchbinder, Wave attenuation in glasses: Rayleigh and generalized-rayleigh scattering scaling, J. Chem. Phys. 151, 104503 (2019).
- Gartner and Lerner (2016) L. Gartner and E. Lerner, Nonlinear modes disentangle glassy and Goldstone modes in structural glasses, SciPost Phys. 1, 016 (2016).
- Lerner et al. (2014) E. Lerner, E. DeGiuli, G. During, and M. Wyart, Breakdown of continuum elasticity in amorphous solids, Soft Matter 10, 5085 (2014).
- Maloney and Lemaître (2006) C. E. Maloney and A. Lemaître, Amorphous systems in athermal, quasistatic shear, Phys. Rev. E 74, 016118 (2006).