MKT J170456.2482100: the first transient discovered by MeerKAT
Abstract
We report the discovery of the first transient with MeerKAT, MKT J170456.2482100, discovered in ThunderKAT images of the low mass X-ray binary GX3394. MKT J170456.2482100 is variable in the radio, reaching a maximum flux density of on 2019 Oct 12, and is undetected in 15 out of 48 ThunderKAT epochs. MKT J170456.2482100 is coincident with the chromospherically active K-type sub-giant TYC 8332-2529-1, and of archival optical photometry of the star shows that it varies with a period of . The shape and phase of the optical light curve changes over time, and we detect both X-ray and UV emission at the position of MKT J170456.2482100, which may indicate that TYC 8332-2529-1 has large star spots. Spectroscopic analysis shows that TYC 8332-2529-1 is in a binary, and has a line-of-sight radial velocity amplitude of . We also observe a spectral feature in anti-phase with the K-type sub-giant, with a line-of-sight radial velocity amplitude of , whose origins cannot currently be explained. Further observations and investigation are required to determine the nature of the MKT J170456.2482100 system.
keywords:
radio continuum: transients – stars: flare – stars: peculiar – stars: activity – stars: binaries: spectroscopic1 Introduction
The radio sky contains many variable and transient sources, often found in follow-up observations of transients detected at at other wavelengths such as optical, gamma-ray and X-ray (e.g. Sood & Campbell-Wilson, 1994; Zauderer et al., 2011; Chandra & Frail, 2012; Horesh et al., 2013; Fong et al., 2015; Marsh et al., 2016; Hallinan et al., 2017; Bright et al., 2019). Blind searches for radio transients using interferometers present many challenges, particularly modest field of view (FoV) and limited observing cadence (e.g. Murphy et al., 2013; Mooley et al., 2016, 2018). With current wide FoV () instruments such as MeerKAT (Camilo et al., 2018), the Australian Square Kilometer Array Pathfinder (ASKAP; Johnston et al., 2008; Schinckel et al., 2012), APERTIF (Maan & van Leeuwen, 2017), the LOw Frequency Array (LOFAR; van Haarlem et al., 2013), and the Murchison Wide Field Array (MWA; Tingay et al., 2012), surveying large areas of sky with various cadences and improved sensitivity is now possible. These new instruments could result in the discovery of tens to hundreds of transients (e.g. O’Brien et al., 2015).
Radio transients are commonly divided into two categories: coherent and incoherent (e.g. Pietka et al., 2015); and both types of transient are investigated in the time domain with high-time resolution (milliseconds or less), and in image plane observations with a range of integration timescales. In this publication we will focus on image plane searches. Current image plane transient searches include the Amsterdam-ASTRON Radio Transients Facility and Analysis Centre (AARTFAAC; Prasad et al., 2016; Kuiack et al., 2019), and the ASKAP Survey for Variables and Slow Transients (VAST; Murphy et al., 2013). Large surveys such as the Very Large Array (VLA) Sky Survey (VLASS; Lacy et al., 2019) are also being used to search for transients (Hallinan et al., 2013). It was originally theorised that image plane, low-frequency transient searches would detect many transient radio sources, but to date only one transient each has been found with LOFAR (Carbone et al., 2016; Stewart et al., 2016), the Long Wavelength Array (LWA, Varghese et al., 2019) and the MWA (Murphy et al., 2017), and no transients have been found with the VLA Low Band Ionospheric and Transient Experiment (VLITE; Polisensky et al., 2016). The rate of low-frequency Galactic transients may be higher, as inferred from the Galactic Center Radio Transients detected by VLA and Giant Metrewave Radio Telescope (GMRT, e.g. Hyman et al., 2005, 2009; Roy et al., 2010). At higher frequencies, a VLA search for transients at 5 GHz only found a single transient candidate (Ofek et al., 2011), while the Caltech-NRAO Stripe 82 Survey Pilot (CNSS; Mooley et al., 2016) at detected two transients, and several transients have been found in the full CNSS survey (Mooley et al. 2019, in preparation). Bower et al. (2007) searched 944 epochs over 22 years of VLA 5 and 8 GHz observations and found 10 new transients; however, more than half of these were found to be artefacts by Frail et al. (2012). More recently, 9 potential variable sources were detected using ASKAP (Bhandari et al., 2018). This means that only a few radio transients have been discovered in blind image plane transient surveys, despite expectations for many new discoveries. These results111A comprehensive list of blind radio transient searches can be found at http://www.tauceti.caltech.edu/kunal/radio-transient-surveys/index.html. have highlighted the importance of wide-field, sensitive searches, at suitable frequencies, for maximising the yield of radio transients (see also Thyagarajan et al., 2011; Bannister et al., 2011).
One type of radio transient expected to be found in image plane transient searches is flares from stars and stellar systems (see e.g. Osten, 2008, for a summary). Radio flare stars are usually M-type dwarf stars that emit coherent radio bursts on times scales of minutes to hours. Recently, Villadsen & Hallinan (2019) detected 22 coherent radio bursts from M dwarfs using the VLA at 300 MHz and 1-6 GHz, and Zic et al. (2019) detected several pulses from the M-dwarf UV Ceti with ASKAP. As well as flare stars, binary systems such as RS Canum Venaticorum (RS CVn), Cataclysmic Variables (CVs) and symbiotic binaries are known to flare in the radio. RS CVn are binary systems consisting of a late-type giant or sub-giant star with a late-type main sequence star companion (e.g. Hall, 1976; Craig et al., 1997; García-Sánchez et al., 2003). RS CVn are chromospherically active and the giant or sub-giant rotates quasi-synchoronously with the orbital period. Periods for RS CVn are typically 1-20 days, and radio flares on RS CVn systems have been observed to last up to a few days (e.g. Walter et al., 1987; Trigilio et al., 1993). RS CVn emit in both the radio and X-ray while in quiescence (e.g. Gunn, 1996). CVs are binary systems with a white dwarf primary accreting matter from Roche lobe overflow of the secondary star, usually a main-sequence star (e.g. Coppejans et al., 2016). Dwarf novae from magnetic CVs have been observed to exhibit radio outbursts that can last for weeks, with rapid radio flaring on timescales less than an hour (Mooley et al., 2017). Symbiotic binaries also have a white dwarf primary, but the companion is a red giant star and the orbit is wide. In these systems, mass is accreted on to the white dwarf via stellar winds (O’Brien et al., 2015). Radio variability over timescales of a few hours have been detected on symbiotic binaries, for example RX Puppis (Seaquist, 1977). AR Scorpii is another stellar binary that is observed in the radio, it consists of a white dwarf primary and an M-dwarf companion. AR Scorpii has an orbital period of 3.56 hours, is observed to pulsate in the optical, radio and X-ray with a period of 1.97 minutes (Marsh et al., 2016; Takata et al., 2018), and is highly polarised (e.g. Buckley et al., 2017). Radio flaring stellar systems vary on a variety of time scales, making it difficult to detect when these systems are in outburst (e.g. Osten & Bastian, 2008). This means that wide-field monitoring is an important method for discovering and investigating these sources in the radio.
MeerKAT is the (more) Karoo Array Telescope (Camilo et al., 2018) consisting of 64, 13.96 m dishes in South Africa. MeerKAT has a FoV of over a square degree at 1.4 GHz, which makes it an excellent instrument for searching for radio transients, such as stellar flares. ThunderKAT is the MeerKAT Large Survey Project (LSP) investigating and searching for transients in the image plane (Fender et al., 2017). ThunderKAT is directly observing transient sources such as X-ray binaries, CVs, and gamma-ray bursts, and is commensally searching for radio transients. ThunderKAT has committed to observing the low mass X-ray binary GX3394 every week for five years. With a FoV of over a square degree, weekly observations, and hundreds of sources in the field, this is an excellent opportunity to search for transient and variable radio sources that vary on many different timescales. In this paper we will present the serendipitous discovery of MKT J170456.2482100, the first radio transient discovered commensally with MeerKAT, in the GX3394 field. In Section 2 we will present the radio observations of the source and the method of detection. In Section 3 we will identify the optical counterpart to MKT J170456.2482100. In Sections 4, 5, 6, 7 and 8 we will present the optical photometry, optical spectroscopy, radio pulsation searches, UV photometry, and X-ray photometry of the source respectively. In Sections 9 and 10 we will discuss our findings and conclude.
2 MeerKAT radio observations
ThunderKAT (Fender et al., 2017) first observed the GX3394 (Tremou et al. in prep) field with 16 dishes on 2017 November 11 during commissioning. It then observed the field with all 64 dishes for the first time on 2018 April 14, and it began weekly monitoring in September 2018. We present data from 48 epochs, 46 epochs from weekly monitoring plus the 2017 November 11 and 2018 April 14 epochs. The GX3394 field is observed using the L-band (-) receiver in full polarisation mode, which has a bandwidth of , a central frequency of , and 4096 frequency channels. The observations are typically 10-15 minutes in duration, with a minimum integration time of 8 seconds. The phase calibrator (1722554) is observed for minutes before or after observing the field, and the band-pass and flux calibrator (1934638) is observed for 5 minutes at the beginning of the observing block.
Each observation is first flagged using AOFlagger222https://sourceforge.net/projects/aoflagger/ (Offringa, 2010) and calibrated by following standard procedures (a priori phase correction, antenna delays and band-pass corrections) using the Common Astronomy Software Application333https://casa.nrao.edu/ (CASA; McMullin et al., 2007). As the data volume is large, the data are binned to reduce the number of channels from 4096 to 512. The full ThunderKAT pipeline will be presented in a future publication.
The data are imaged using the new wide-band, wide-field imager, DDFacet (Tasse et al., 2018). DDFacet is based on a co-planar faceting scheme, and it takes generic direction dependent effects into account. This is important as MeerKAT has a very wide ( square degree) FoV. The imaging was performed by deconvolving over 4 frequency subbands using the SSDclean deconvolution algorithm and a Briggs weighting scheme (robust=0.7). To correct for considerable artefacts from bright sources, self-calibration was performed using the KillMS444https://github.com/saopicc/killMS software that accompanies DDFacet. The image quality was optimised by using the Complex Half-Jacobian Optimisation for N-directional EStimation (CohJones; Smirnov & Tasse, 2015) algorithm to correct for direction-dependent effects. The CohJones algorithm solves for scalar Jones matrices in a user-defined number of directions; three directions were used for the GX3394 field. For the final images of the field the median synthesised beam in L-band is 5′′ 4′′. The images typically have an overall root-mean-square (RMS) noise of . We have found that there is a flux-dependent underlying systematic flux density fluctuation of up to the per cent in the light curves of sources in this field, likely caused by flux density variation in the secondary calibrator source. This does not affect the results of the analysis in this work; however, any small-scale variability visible in the MeerKAT light curves presented here should not be over-interpreted.
2.1 Transient detection pipeline
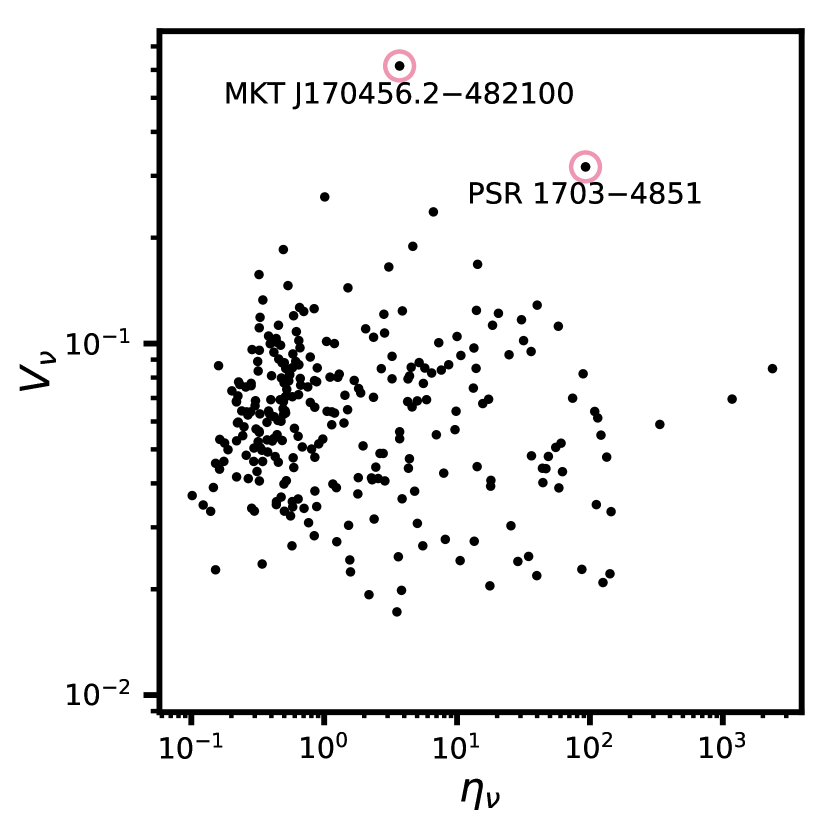
In December 2018 the images from the regular monitoring of GX3394 were used to trial the LOFAR Transient Pipeline (TraP, Release 4.0; Swinbank et al., 2015) for detecting variable and transient sources in MeerKAT observations. TraP automatically processes a time series of images by finding sources, determining source associations, and constructing light curves. The light curves are then used to calculate two variability parameters: and . The parameter is the reduced value for a fit to a stable source, higher values show increased variation from a constant flux density while lower values indicate that the flux density is stable. The parameter is the co-efficient of variability or the modulation parameter, which is defined as the ratio between the standard deviation in the flux density and the mean flux density value. A higher value indicates larger fractional variation in flux density values. For further information on the processing steps and the calculation of the variability parameters refer to Swinbank et al. (2015).
The default TraP settings were used to analyse the GX3394 field555For further details about the TraP capabilities, refer to the TraPdocumentation at https://tkp.readthedocs.io/en/latest/ (TraP contributors, 2014). A source detection threshold of was used, and the source finder was forced to use a Gaussian shape consistent with the synthesised beam of the images to search for sources. This was done to prevent the source finder from detecting extended emission, as variable sources are typically expected to be point sources. The first trial use of TraP on the GX3394 field was highly successful, the distributions of the variability parameters and are shown in Figure 1. An outlier in both and was found to coincide with the known pulsar PSR J17034851, labelled in Figure 1, at Right Ascension and Declination of 17h03m54.53(2)s and 48d52m01.0(5)s respectively (J2000; Jankowski et al., 2019). This is a known mode-changing pulsar (Wang et al., 2007), and this mode changing causes the flux density integrated over to vary from epoch to epoch. An interesting source, MKT J170456.2482100, was also identified as an outlier to the distribution of the variability parameter. It was confirmed as a variable source by visual inspection of the light curve and images. At the time of discovery the variability parameters for MKT J170456.2482100 were and , while the point sources near MKT J170456.2482100 are consistent with stable sources with and . We note that there are other outliers in Figure 1, these will be investigated and presented in a future publication.
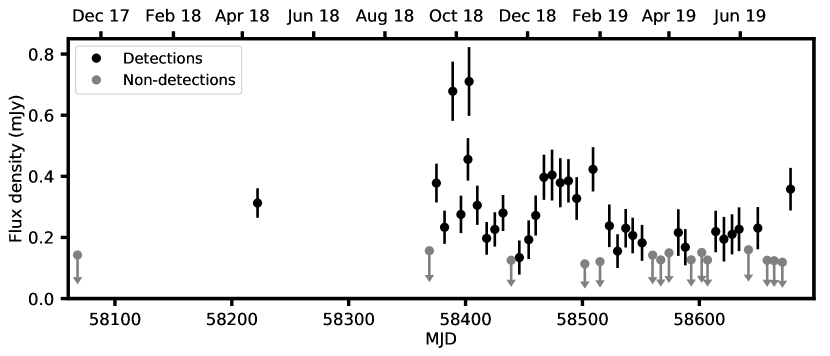
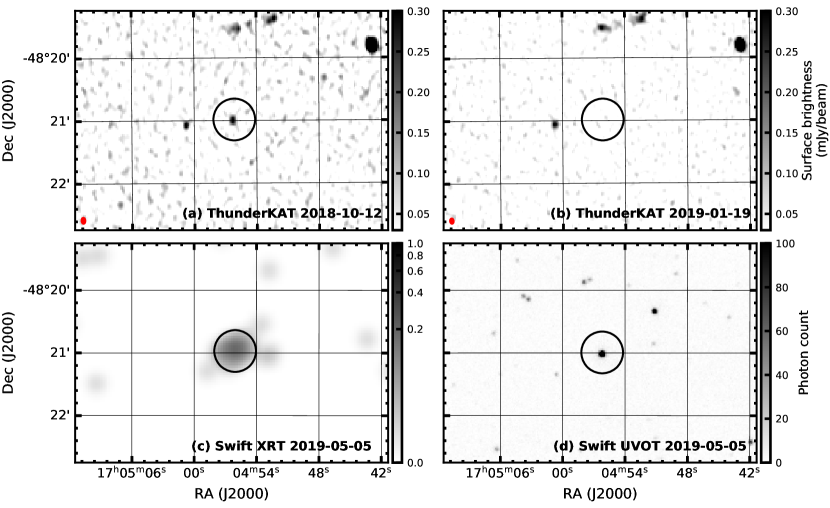
Following the successful identification of MKT J170456.2482100 using TraP, the source was monitored in each weekly image of the GX3394 field. The light curve of MKT J170456.2482100, extracted using the TraP default parameters, for all 48 epochs is shown in Figure 2. Examples of MeerKAT images of the source are shown in Figure 3. To produce this light curve we forced TraP to take measurements at the position of MKT J170456.2482100 in every epoch, which means that TraP measured values even when the source was not detected, using a detection threshold of above the noise in the image local to the source. In Figure 2 we plot these non-detections (which were confirmed by eye) as upper-limits where is the RMS of the noise close to MKT J170456.2482100. The uncertainties on the flux density are the uncertainties calculated by TraP. The position of MKT J170456.2482100 places it at approximately the half power point of the MeerKAT primary beam when GX3394 is at the phase centre. On 2019 May 18 we observed GX3394 as usual, and also took an observation with MKT J170456.2482100 at the phase centre. Both observations were processed and calibrated in the same way. We then measured the flux density of the closest constant source to MKT J170456.2482100 in both images, for ease we will call this nearby source 170500482103. We determined that the flux density of 170500482103 when MKT J170456.2482100 is at the phase centre of the observation is times the flux density of 170500482103 when GX3394 is at the phase centre. This indicates that 170500482103 and MKT J170456.2482100 are at approximately the 50 per cent point of the primary beam. Therefore, the flux density of MKT J170456.2482100 in this manuscript is the measured flux density multiplied by to correct for the primary beam effect. Table 7 in Appendix A includes the flux density measurements of the peak flux density of the source as measured by TraP, as well as the RMS noise measured near MKT J170456.2482100.
We investigated shorter timescale variability by dividing each epoch of observations into images and running these shorter integration images through TraP. There is no variability in the 160 second integration images above one standard deviation from the mean of the light curve.
3 Identification of the optical counterpart to MKT J170456.2482100
The Python Blob Detector and Source Finder (pyBDSF; Mohan & Rafferty, 2015) was used for improved astrometry to determine the position of MKT J170456.2482100 in the epochs that it is detected. The position of the source was taken to be the mean of the J2000 positions: 17h04m56.2s 48d21m0.45s () with standard deviations of 1.2′′ and 0.68′′ for the Right Ascension and Declination respectively. We then searched for sources nearby to this position and found the star TYC 8332-2529-1, which has a Gaia data release 2 (Gaia Collaboration et al., 2016; Bailer-Jones et al., 2018; Gaia Collaboration et al., 2018) ICRS J2015.5 position of 17h04m56.25s 48d21m00.67s with uncertainties of and respectively, a proper motion of and in Right Ascension and Declination respectively, and a distance of (68 per cent confidence interval 541–568 pc). Taking proper motion into account, this position is from the position of MKT J170456.2482100, which means that we identify TYC 8332-2529-1 as the optical counterpart to MKT J170456.2482100.
TYC 8332-2529-1 has been observed by numerous sky-surveys at various wavelengths. These include the original Hipparcos Tycho-2 catalogue (Høg et al., 2000), the Gunn photometry from the Deep Near-Infrared Survey of the southern sky (DENIS; Fouqué et al., 2000), the Two-Micron All-Sky Survey (2MASS; Cutri et al., 2003), and the final Wide-Field Infrared Survey Explorer catalogue (AllWISE Cutri et al., 2013). TYC 8332-2529-1 was classified as a main-sequence K-dwarf (K7V) by Pickles & Depagne (2010), and it was classified by the All-sky Automated Survey (ASAS; Pojmanski, 1997) Catalogue of Variable Stars (ACVS; Pojmanski, 2002) as a first overtone delta Cepheid (DCEPFO) or eclipsing binary with a period of . Richards et al. (2012) found, with a probability of per cent, that the star is a type A Small Amplitude Red Giant (SARG; Wray et al., 2004) with a period of .
4 Optical photometry
TYC 8332-2529-1 has been observed times in total over the last 18 years by ASAS (Pojmanski, 1997), the Kilodegree Extremely Little Telescope (KELT; Pepper et al., 2007), and the All-Sky Automated Survey for Supernovae (ASAS-SN; Shappee et al., 2014; Kochanek et al., 2017). The details of the photometric observations of TYC 8332-2529-1 made by these surveys are shown in Table 1.
| Survey | Optical band | Date of first observation | Date of last observation | Number of observations | Number of semesters |
|---|---|---|---|---|---|
| ASAS | V | 2001 Jan 01 | 2009 Oct 12 | 534 | 9 |
| KELT | V | 2013 May 15 | 2015 Oct 13 | 3037 | 3 |
| ASAS-SN | V | 2016 Mar 10 | 2018 Sep 22 | 762 | 5 |
| ASAS-SN | g | 2018 Feb 26 | Ongoing | 645 | 3 |
Once TYC 8332-2529-1 was identified as the source of MKT J170456.2482100, we observed the star with the HIPPO Photopolarimeter (Potter et al., 2010) on the 1.9-m telescope at the South African Astronomical Observatory (SAAO), Sutherland, South Africa. HIPPO uses photomuliplier detectors, so is a photon counting instrument, obtaining measurements simultaneously in two channels. Dual counter-rotating waveplates (1/2 and 1/4) modulate the signal at 10 Hz and allow simultaneous determination of all four Stokes parameters. The intrinsic time resolution is 1 ms for total intensity measurements (I) and 100 ms for the three other Stokes parameters (Q, U & V). In practice data are accumulated over many 100 ms cycles, typically several 100 s, until a sufficient S/N is obtained. A log of these photopolarimetric observations is presented in Table 2.
| Telescope | Instrument | Wavelength range/Filter (Å) | Resolving Power | Date | UT Start (hh:mm) | Exposure times | Radial velocity (, km s-1) |
|---|---|---|---|---|---|---|---|
| SAAO 1.9-m | HIPPO | 34009000; no filter | 2019-03-12 | 02:19 | 467s | ||
| B | 02:46 | 2020s | |||||
| V | 02:48 | 2073s | |||||
| R | 02:50 | 2065s | |||||
| I | 02:51 | 1987s | |||||
| SALT | HRS | 38008800 | 15000 | 2019-02-25 | 02:42 | 1200s | 53 3 |
| 2019-03-24 | 00:16 | 1500s | 0 3 | ||||
| 2019-04-17 | 22:45 | 1500s | –30 3 | ||||
| 2019-04-18 | 22:38 | 1500s | –32 3 | ||||
| 2019-06-08 | 19:18 | 1500s | 38 3 | ||||
| 2019-06-10 | 19:30 | 1500s | 52 3 | ||||
| SALT | RSS | 61376953 | 4350 | 2019-03-01 | 01:55 | 600 5s | 20 18 |
| Cerro Tololo LCO | NRES | 38008600 | 53000 | 2019-06-15 | 19:04 | 1200s | 24 7 |
| Sutherland LCO | NRES | 38008600 | 53000 | 2019-06-01 | 01:20 | 1200s | –35 7 |
| 2019-06-04 | 03:05 | 1200s | –21 7 | ||||
| 2019-06-06 | 02:08 | 1200s | 3 7 | ||||
| 2019-06-09 | 03:34 | 1200s | 37 7 | ||||
| 2019-06-14 | 03:06 | 1200s | 43 7 | ||||
| 2019-06-19 | 07:20 | 1200s | –16 7 | ||||
| 2019-07-04 | 03:33 | 1200 | 49 7 | ||||
| 2019-07-05 | 23:08 | 1200 | 43 7 |
4.1 Photometric variability
The automated ASAS pipeline classified TYC 8332-2529-1 as a 0.955043 day variable. However, we performed a Lomb-Scargle (Lomb, 1976; Scargle, 1982; Perera et al., 2018) analysis of the data and found that the 0.955043 day periodicity is due to the underlying periodicity of the observing cadence, instead of the intrinsic periodicity of the star. We found the highest precision period of the star to be by performing a Lomb-Scargle analysis on the combined V-band data for the full 18 years of observations. This is consistent with the period of found by Richards et al. (2012) using machine learning techniques on the ASAS observations.

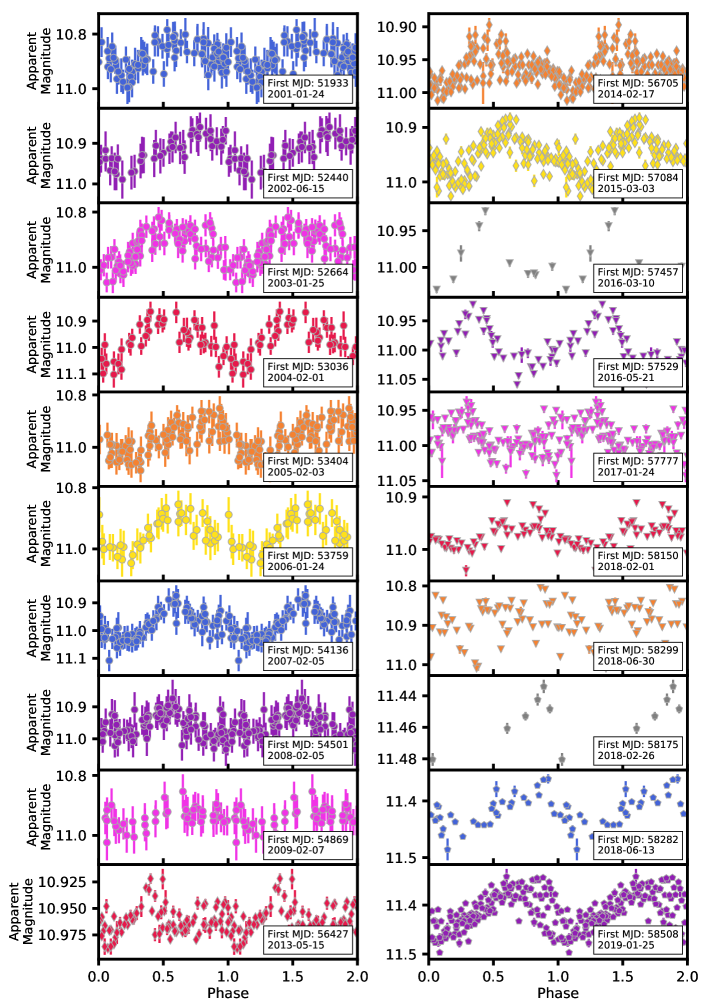
We further investigated the period of TYC 8332-2529-1 by performing a Lomb-Scargle analysis on each semester666We define a semester as the period in each year when the source is a night time source. of observations from ASAS, KELT, and ASAS-SN. We found that the period for each semester is consistent with , as shown in Figure 4. While the period over remains stable, Figure 5 shows that the shape of the folded light curve and the phase of the peak varies over time. In some semesters the folded light curves show little or no variability and the period is less distinct. In the first semester of KELT observations (start MJD=56427, 2013-03-15) the Lomb-Scargle analysis results in more power at half of the period. Figure 5 shows that this is due to a second peak in the folded light curve of this semester.
4.2 Spectral energy distribution
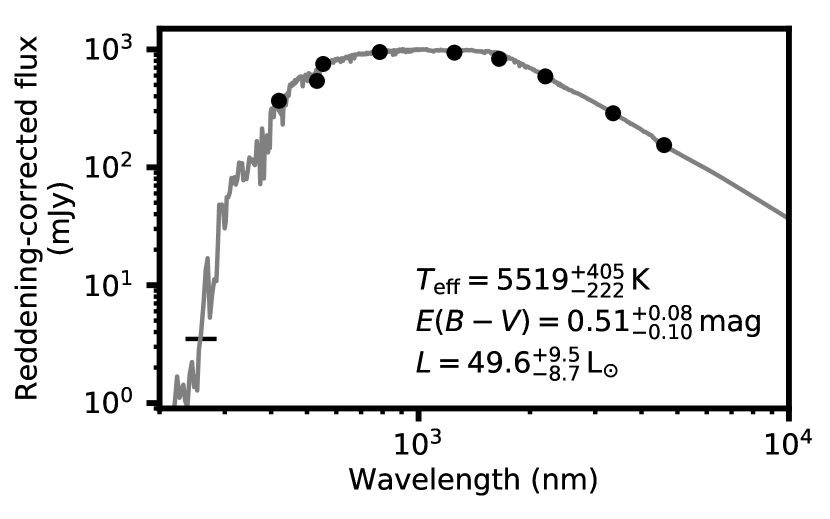
To obtain fundamental stellar parameters, the optical and infrared spectral energy distribution (SED) of TYC 8332-2529-1 was modelled. The SED was constructed from optical - and -band fluxes, obtained from the original Hipparcos Tycho-2 catalogue (Høg et al., 2000); the mean ASAS -band magnitude (Pojmanski, 1997); Gunn photometry from DENIS (Fouqué et al., 2000); , and magnitudes from 2MASS (Cutri et al., 2003); and the [3.4] and [4.6] magnitudes from AllWISE (Cutri et al., 2013). The [11.3] and [22] magnitudes from AllWISE were not used, as TYC 8332-2529-1 lies 59′′ from IRAS 17011-4817, an optically obscured star that reaches second magnitude in these bands and provides considerable contaminating flux.
The software described in McDonald et al. (2012); McDonald et al. (2017) was used to fit bt-settl model atmospheres to the star. The scattering law of Draine (2003), assuming , was used to correct the observed photometry for the effects of interstellar reddening, with as a free parameter. The Gaia Data Release 2 distance of 555 pc from Bailer-Jones et al. (2018) was adopted to scale the luminosity. A mass of 2.5 M⊙ was assumed to set the model surface gravity (log()), but this has relatively little impact on the results.
Assuming a single stellar light source, a best fit was found for a temperature of K and mag, giving a luminosity scaling of L⊙. Unaccounted-for uncertainties include any intrinsic variability, contamination from other sources such as unresolved companions, or other departures from a simple model atmosphere, and a degree of correlation exists among the three parameters. The reduced per degree of freedom is 0.93, hence the expected impact of these uncertainties is small.
To determine physical parameters from these values, stellar isochrones were generated using the Padova stellar evolution code777http://stev.oapd.inaf.it/cgi-bin/cmd_3.2 (Marigo et al., 2017). The default settings were used, including the assumption of solar metallicity (). The star was identified as most likely being a sub-giant, completing its transition across the Hertzsprung gap to the base of the red giant branch. This period is characterised by a rapid inflation of the star towards the Hayashi limit as it becomes convective, following exhaustion of core hydrogen. Without a detailed metallicity derivation, a precise age and mass is impossible to ascertain. However, the age of the star is consistent with solar-metallicity isochrones in the age range Myr, corresponding to a stellar mass of M⊙ and dex. These values assume that the flux from any possible companion is negligible over the optical and near-IR SED, and that the star has taken an evolutionary path through the H–R diagram comparable to a single star with similar initial parameters.
4.3 Photopolarimetry
TYC 8332-2529-1 was observed using HIPPO on 2019 March 12. The results show that TYC 8332-2529-1 was not varying significantly photometrically over the 2 h observation period and furthermore show no evidence for higher frequency variability over timescales of 1 1000 s. An initial filterless observation was performed followed by five repeat BVRI filter sequences. There was no evidence of variations in the polarization between different filter sequences and the average polarization parameters for the BVRI filters are presented in Table 3. The level of linear polarization measured is consistent with the values expected for the ISM at the Galactic coordinates for TYC 8332-2529-1.
| Filter | Linear () | (∘) | Circular () |
|---|---|---|---|
| B | 2.56 0.32 | 39.72 4.44 | 0.24 0.22 |
| V | 2.87 0.18 | 36.78 2.93 | 0.00 0.43 |
| R | 2.61 0.08 | 39.21 2.30 | 0.04 0.09 |
| I | 2.33 0.16 | 41.11 1.59 | 0.01 0.12 |
5 Optical spectroscopy
The variable nature of the optical light curve of TYC 8332-2529-1 is suggestive of an active flare star or binary companion. We therefore undertook a spectroscopic campaign to further understand the nature of the variability. We observed TYC 8332-2529-1 with the Southern African Large Telescope (SALT; Buckley et al., 2006) situated at the SAAO using the High Resolution Spectrograph (HRS; Bramall et al., 2012; Crause et al., 2014) and the Robert Stobie Spectrograph (RSS; Burgh et al., 2003). HRS is a fibre-fed, dual-beam, white pupil, vacuum-stabilised high resolution (R = 15,00080,000, depending on mode and wavelength) spectrograph, while RSS is a prime focus low to medium resolution (R = 3506500, depending on grating/angle/slit choice) slit spectrograph. TYC 8332-2529-1 was also observed by the Las Cumbres Observatory (LCO; Brown et al., 2013) Network of Robotic Spectrographs (NRES). The NRES network uses high-resolution (R53000) optical echelle spectrographs on two, telescopes simultaneously with a ThAr calibration source. The details of the spectroscopic observations are summarised in Table 2.
5.1 High-resolution spectroscopy
Spectra of TYC 8332-2529-1 were taken with the SALT HRS in the Low Resolution (LR) mode on six occasions, shown in Table 2, in clear conditions with seeing. Both blue (38005550Å) and red (54509000Å) spectra were obtained and reduced using the weekly set of HRS calibrations, including ThAr arc spectra and QTH lamp flat-fields.
The primary reduction was conducted using the SALT science pipeline, PySALT (Crawford et al., 2016), correcting for overscan, bias and gain correction. The spectral reductions were then undertaken using a MIDAS-based echelle reductions package (see details in Kniazev et al., 2016). For the blue spectra, the average S/N had a minimum of 10 for the bluest orders (39804000Å), which increased linearly to 120 at 4600Å, and reached a maximum of 140 at 5400Å. For the red spectra, the S/N increased linearly from 80 at 5550Å to 180 at 7000Å, peaking at 200 by 8000Å and then declining slightly to 160 by 8800Å. This behaviour is consistent with the late spectral type (K4-5) attributed to TYC 8332-2529-1.
5.2 Fast time resolved spectroscopy
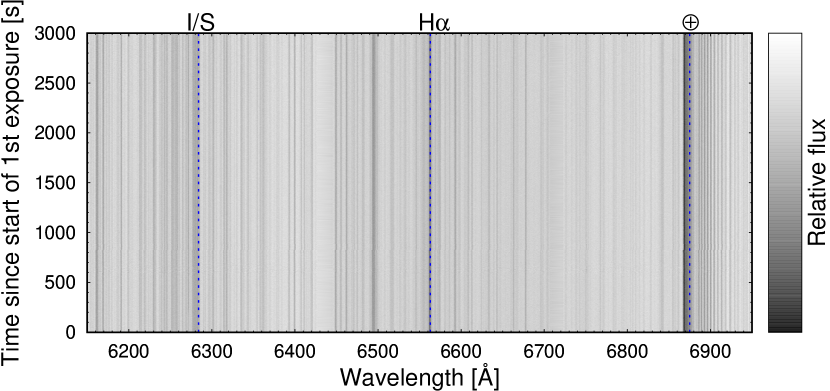
High time resolution spectroscopy of TYC 8332-2529-1 was obtained on 1 March 2019 using the RSS in frame transfer mode in clear conditions with seeing. The PG2300 grating was used at a grating angle of 49.25∘, which gave a wavelength coverage of 61376953Å at a mean resolution, with a slit, of 1.5Å. A set of 600 continuous 5 second exposures were obtained, with no dead time between frames because of the frame transfer mode. The data were reduced using the PySALT package (Crawford et al., 2016) to make the usual corrections for overscan, bias, gain and crosstalk. A 2 s neon arc lamp exposure, taken after the observations, was used to wavelength calibrate the spectra. The IRAF package was then used to perform the spectral reductions, using the tasks in twodspec. In Figure 7 we show a 2D spectral image comprising of all 600 spectra, extending from 61376953Å and stacked sequentially in time, increasing upwards.
Little variation is seen in the spectra, in terms of line strength or position, and certainly no evidence of H variability.
5.3 Interpretation
5.3.1 Radial velocity curve
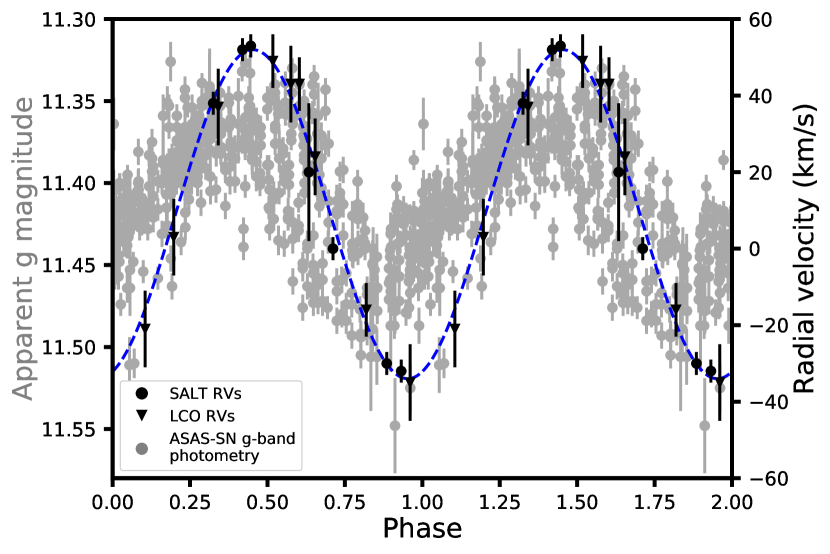
The wavelength calibration of the first SALT/HRS spectrum was initially checked against a telluric-feature spectrum in the regions around 6000 and 6800 Å, and a good match was found. The radial velocity amplitude of the target star was then derived by cross-correlating the spectrum with a bt-settl model atmosphere (, solar metallicity; Allard et al., 2003) in the region 6100–6240 Å, chosen to be largely free of telluric absorption or emission features. Radial velocities for subsequent spectra were checked in a similar manner, then cross-correlated against this first spectrum, to ensure a more accurate relative velocity. Radial velocities for the LCO spectra were corrected from the pipeline-reduced version by –88 km s-1. Observed radial velocities were corrected to the Local Standard of Rest using the starlink tool rv (Currie et al., 2014). The resulting radial velocities are listed in Table 2 and shown in Figure 8. Formal errors are dominated by the accuracy of the wavelength calibration, and approximate uncertainties have been assigned on this basis. Since these cross-instrument velocity uncertainties dominate the radial velocity amplitude, and since the photometric period is well known, we do not perform a formal fit to the radial velocity data.
5.3.2 Spectral characterisation
The spectrum of TYC 8332-2529-1 appears consistent with the K giant determined from the SED modelling in Section 4.2. The CaII H and K lines are in emission reaching the continuum level and there is infilling of the infrared triplet, which indicates that the star is chromospherically active (the Ca 8662 line is shown in Figure 9).
There are no emission lines in the optical spectrum other than the chromospheric emission of the H and K lines and the infilling of the infrared triplet. This indicates a general lack of hot material in the vicinity of the unseen companion, as emission lines are generally seen even in relatively faint accretion discs (e.g. RW Sextantis; Hernandez et al., 2017).
5.3.3 Spectral variation
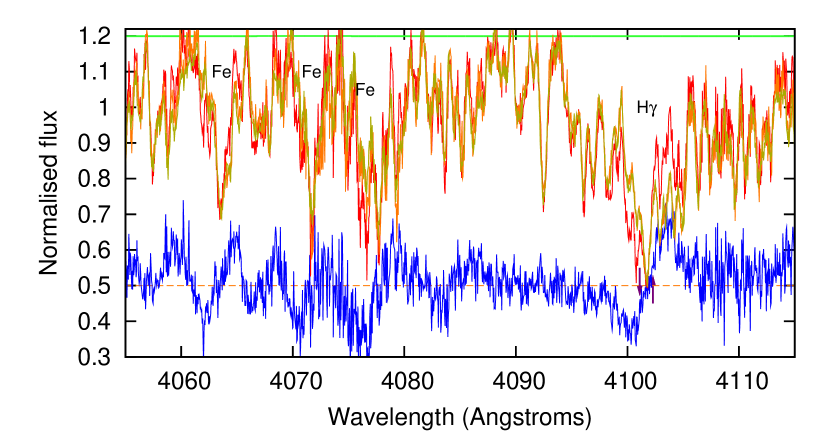
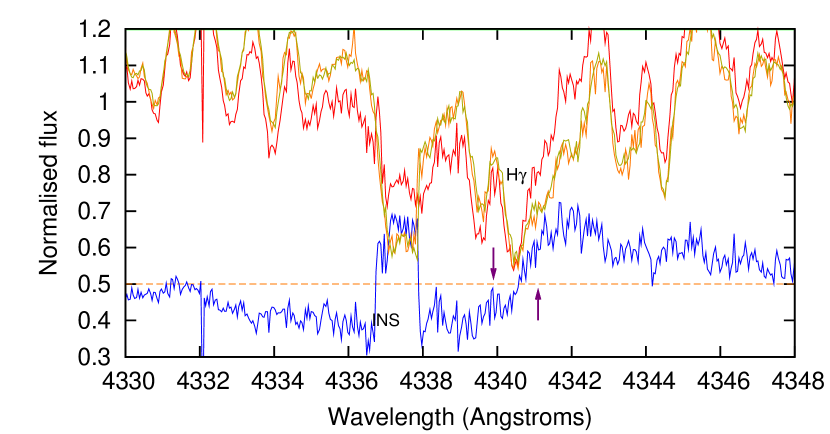
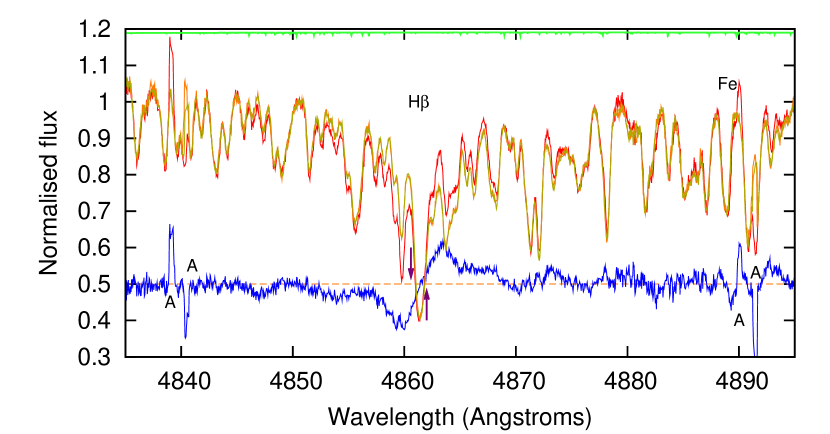
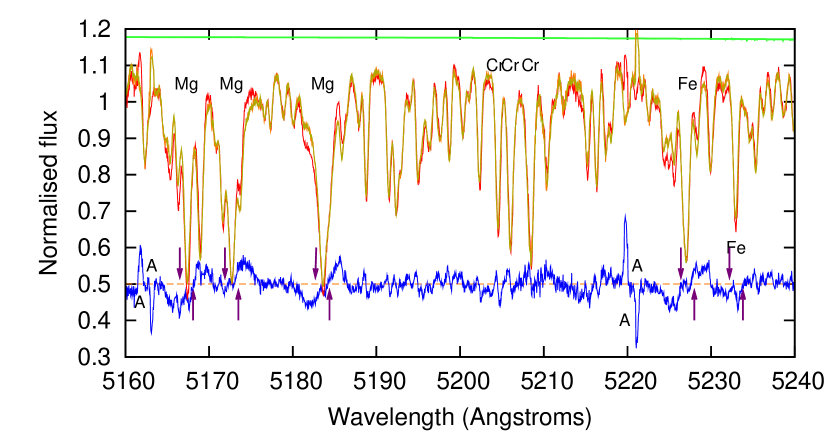
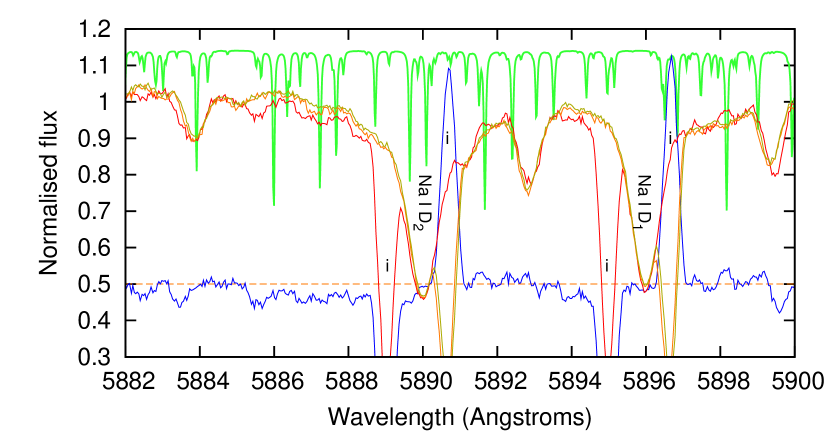
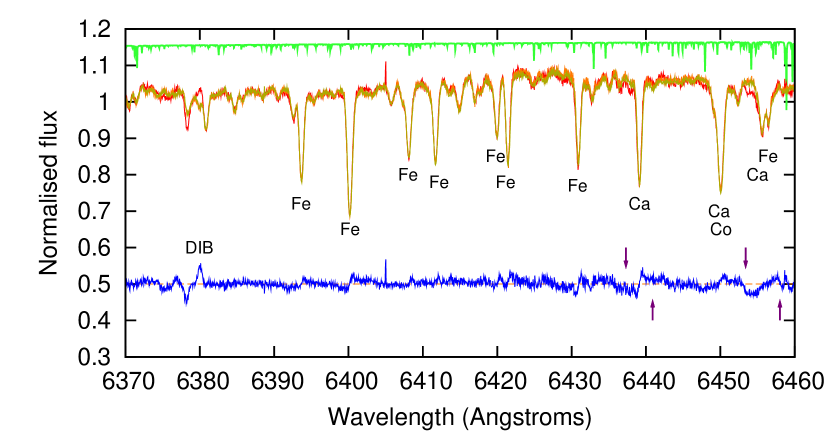
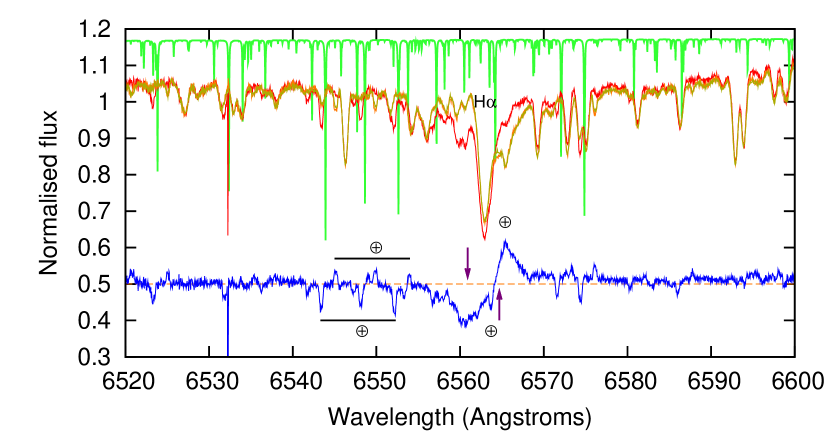
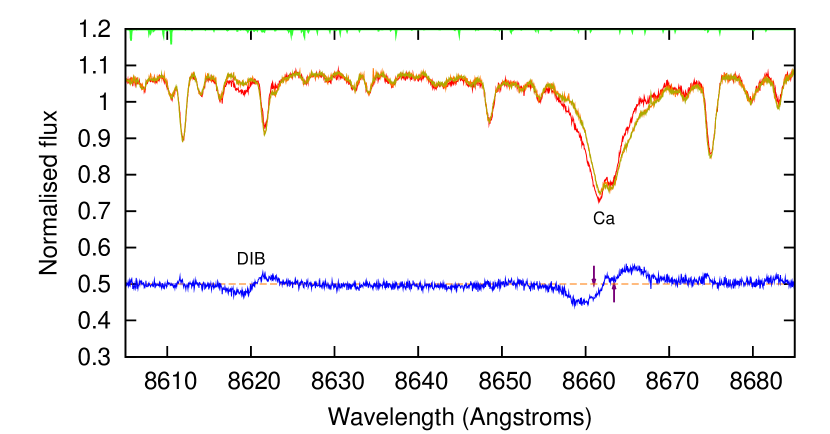
Despite showing considerable radial velocity variations, the shape of the red portion of the TYC 8332-2529-1’s spectrum remains mostly constant, generally to within 1 per cent (Figure 9). Most variations appear to be caused by telluric features, interstellar gas lines and diffuse interstellar bands (DIBs). Subtle, percentage-level variations in the immediate vicinity of strong atomic lines can be traced to variation in line widths, likely due to very small variations in the recorded spectrum caused by either seeing or telescope focus.
However, variations in the line wings of bright lines exist. In the difference spectrum, this results in negative and positive features offset from the stellar velocity. The systemic rest velocity (43 km s-1) is marked with purple arrows in Figure 9. In stronger and bluer lines, extra absorption is seen beyond the systemic rest velocity, indicating the absorbing material is on the opposite side of the system’s barycentre and hotter than the giant star. Modelling these components as one would a companion star gives a reflex velocity amplitude of km s-1. The relative line depths suggest a spectral temperature of order 7000 K, but this is very approximate as the K-giant star’s spectrum cannot be accurately subtracted with our current data.
6 Radio pulsation searches
As MKT J170456.2482100 is coincident with a star in a spectroscopic binary, it is possible that the companion star may be a pulsar or pulsating white dwarf, similar to AR Scorpii (Marsh et al., 2016). To investigate this possibility, we performed high-time resolution observations to search for pulsations over a range of periods spanning milliseconds to minutes. We observed the position of MKT J170456.2482100 on UTC 2019 January 30 with the ultra-wide-bandwidth (UWL) receiver deployed on the 64-m Parkes radio telescope in Australia. The output of the receiver is processed by the Medusa Graphics Processing Unit (GPU) cluster which produces 8-bit, full-Stokes filter banks with spectral and temporal resolutions of 1 MHz and 128 s respectively over the band from - . The data were recorded in psrfits format and processed using PSRCHIVE tools (Hotan et al., 2004). Since our data were strongly affected by radio frequency interference (RFI) we used the clfd888https://github.com/v-morello/clfd package described in (Morello et al., 2019) to perform more sophisticated RFI mitigation. Since radio waves are dispersed by free electrons in the interstellar medium along the line-of-sight, the data need to be corrected for this dispersion delay before any analyses can be made. This dispersion delay can be quantified by the dispersion measure (DM), which is the integrated free electron column density along the line-of-sight. We dedispersed the data over a range of trial DMs, pc cm-3 in steps of 1 pc cm-3 to account for the uncertainty in the distance to TYC 8332-2529-1. The DM range was estimated using various distances to the source (Bailer-Jones et al., 2018), and the NE2001 model (Cordes & Lazio, 2002). For each trial DM, the resulting dedispersed time series was searched for long and short period pulsations using both a Fast Folding Algorithm (FFA) and a Fast Fourier Transform (FFT) respectively.
An FFT was performed using the PRESTO suite of pulsar search and analysis software (Ransom et al., 2002). For each trial DM time series resulting from the dedispersion mentioned above, we performed an FFT using the realfft routine. We then used the accelsearch routine which sums 16 harmonics incoherently for each frequency bin to improve the signal-to-noise (S/N), and every detection above a S/N of 5 was saved for further inspection. We folded the time series for each candidate period using the prepfold routine and the folded time series was visually inspected to check whether it resembled a true astrophysical source. No significant periodic pulsations were detected above the threshold S/N.
While FFTs are a standard technique used for searching pulsars and short period sources (e.g. Rajwade et al., 2018), they become less sensitive when searching for longer periods as red noise becomes a dominant factor. Therefore, we used the RIPTIDE999https://bitbucket.org/vmorello/riptide/src/master/ FFA algorthm developed by Morello et al. (in prep) to search for periods ranging from 1 second to 10 minutes. Similar to the FFT, we dedispersed and folded each time series and vetted the candidates for significant pulse profiles above a S/N of 8. We did not detect any significant periodic pulsations above the S/N threshold.
In addition to the periodicity searches described above, we also performed offline single pulse searches on the data using the GPU based heimdall101010https://sourceforge.net/projects/heimdall-astro/ single pulse search software. The heimdall code reads in a subset of the data at a time, and processes it over the DM-width parameter space in search of single pulses. We expect any single pulse to be detected over a range of DMs close to the true value. A clustering algorithm merges these events into one before returning the DM that yields the maximum S/N. This reduces the number of candidates considerably as thousands of events can be identified prior to merging, which will then eventually result in a much lesser number of unique candidates. The data were searched for bursts in DM and width space by dedispersing over trial DMs in the range pc cm-3 and convolving with a series of sliding boxcar filters (square pulse) of width time samples respectively. No significant bursts were detected above a S/N threshold of 10.
7 UV observations
We were granted two target of opportunity observations of MKT J170456.2482100 on 2019 April 18 and 2019 May 05 with the Swift UVOT (Mason et al., 2000) and XRT (Hill et al., 2005) instruments. For the Swift UVOT observations we used the UVW1 filter (centre wavelength Å). Two exposures of 393.9 s and 1012.5 s were taken on 2019 April 18 and three exposures of 500.25 s, 221.68 s and 306.54 s were taken on 2019 May 05. The magnitudes of the source are shown in Table 4, and the UV is plotted on the SED of TYC 8332-2529-1 in Figure 6. As can be seen in Table 4, there is no evidence of variability greater than 0.02 magnitudes in the UV from these observations on timescales of a few hours and 27 days.
| Date | Time (UTC) | Exposure (s) | AB Magnitude |
|---|---|---|---|
| 2019-04-18 | 20:45:17 | 393.93 | |
| 22:18:47 | 1012.48 | ||
| 2019-05-05 | 03:30:48 | 500.25 | |
| 05:11:06 | 221.68 | ||
| 09:41:44 | 306.54 |
8 X-ray observations
The simultaneous Swift XRT (Hill et al., 2005) observations on the two days were 1.4 ks and 1.0 ks respectively. We used the XRT photon counting mode in the 0.3–12 keV band. During the first observing session we detected 18 events from the source. The probability that these counts are from the background is . In the second session, 19 events were detected from the source with a probability of that the photons are from the background. Based on these observations we claim a faint X-ray detection of MKT J170456.2482100. Most events detected from the source were in the soft part of the band, 0.3–3 keV. Due to the low photon count we were unable to fit a spectrum to the individual observations, but we were able to fit a power-law to the combined spectrum from both epochs to obtain a flux density of . The parameters for this fit are shown in Table 5 and one of the X-ray images is shown in Figure 3.
| Parameter | Value |
|---|---|
| 2.4 (+0.8, -0.7) | |
| NH (cm-2) | 4.0(+4.0, -3.0) 1021 |
| FXabs (ergs cm-2 s-1) | 7.3(+3, -2) 10-13 |
| 2.3 |
9 Discussion
MKT J170456.2482100 is a transient radio source coincident with a spectroscopic binary where one of the objects is the chromospherically active K-type giant TYC 8332-2529-1 (spectral type K4-5). In the radio we see a bright event occur in October 2018, followed by decreasing radio brightness with some underlying variability. We do not find any radio pulsations. MKT J170456.2482100 was detected in both the UV and the X-ray.
The approximately 18 years of optical photometry shows that TYC 8332-2529-1 varies with a period of , but that the shape and amplitude of the light curve changes over time. The optical spectra show that MKT J170456.2482100 is a spectroscopic binary with a period matching the photometric period. The line-of-sight radial velocity amplitude of TYC 8332-2529-1 is . There are no emission lines in the spectra, as would be expected for an accretion flow or accreting compact companion. The overall spectrum of the star is highly stable, but strong lines show small-scale variation consistent with an absorption component in orbital anti-phase with the K-giant. Blue lines are preferentially affected, and the combination is consistent with a fainter, broader-lined object on the other side of the barycentre, with a line-of-sight radial velocity amplitude of and a temperature of 7000 K. While the variations are clear, we are not able to extract this signal with sufficient clarity to state whether we have detected the signature of a spectroscopic binary companion, or some other physical effect within the system. Further spectral monitoring at high signal-to-noise will be necessary to obtain better phase coverage.
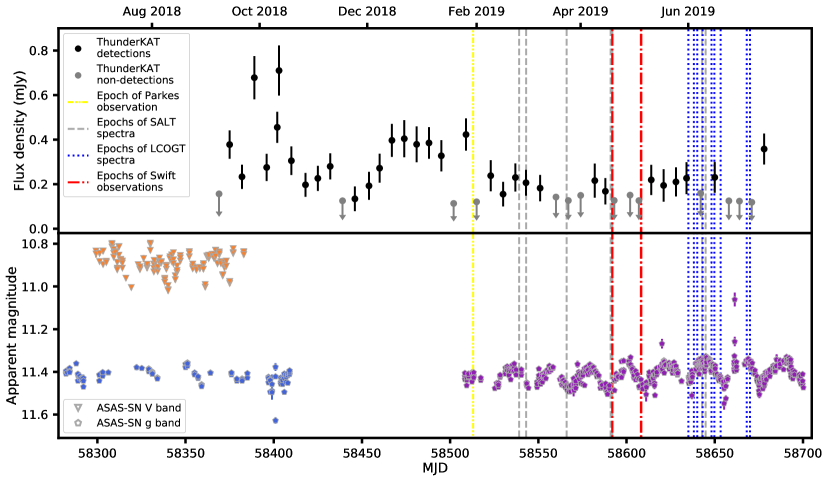
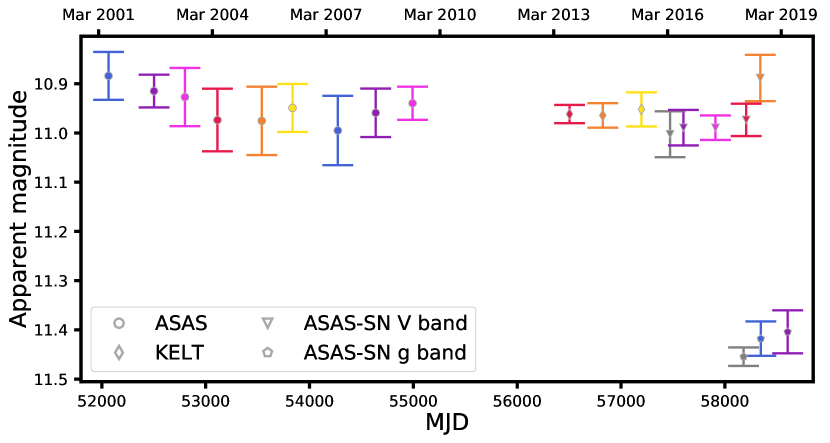
In Figure 10 we plot the ASAS-SN semesters beginning on 2018 June 13 (MJD: 58282), 2018 June 30 (MJD: 58299) and 2019 January 25 (MJD: 58508) as well as the radio light curve from the MeerKAT observations. There is no clear periodicity in the 2018 June 30 semester of ASAS-SN V-band observations, which coincides with the bright radio event that occurred in October 2018. However, in the 2019 January 25 semester of ASAS-SN g-band observations the periodicity has returned, with increasing amplitude over time. This is coincident with the decreasing radio flux over time. This could indicate that the cause of the optical photometric period was disrupted by the same event that caused the radio flaring in October 2018. In Figure 5 we can also see that the light curve is less defined in the 2013 May 15 (MJD: 56427) and 2014 Feb 17 (MJD: 56705) semester, but that the periodicity returns in the 2015 Mar 03 (MJD: 57084) semester. This could imply that a similar outburst to the October 2018 event occurred before or during the 2013 May 15 semester. A search of archival radio data has not revealed any data at these times to see whether there was a corresponding radio outburst. We also see, in Figure 11, that the optical brightness of the star and the amplitude of the variability varies over time. Particularly that the 2018 June 30 semester of ASAS-SN V-band observations, that ended in October 2018 during the radio flare, are significantly brighter than previous semesters of optical photometry. We also note that there appears to be a flare in the ASAS-SN g-band observations in June 2019; however, this is an instrumental issue as the stars nearby to TYC 8332-2529-1 show a similar “flare” in the same epoch in their light curves.
The variable shape of the photometric light curve could indicate the presence of large star spots on the surface of the K star (e.g. Frasca et al., 2005; Biazzo et al., 2006). For example, the shape of the V-band light curve in the latest semester of ASAS-SN g-band observations could be caused by the presence of two large star spots, similar to IM Peg (Biazzo et al., 2006). The variability in the shape and phase of the light curve over time could indicate that the spots change in size, number, and position on the star’s surface. Assuming that the variability is caused by star spots, we can calculate the covering fraction, i.e. the fraction of the star covered by star spots using (Morris et al., 2018):
| (1) |
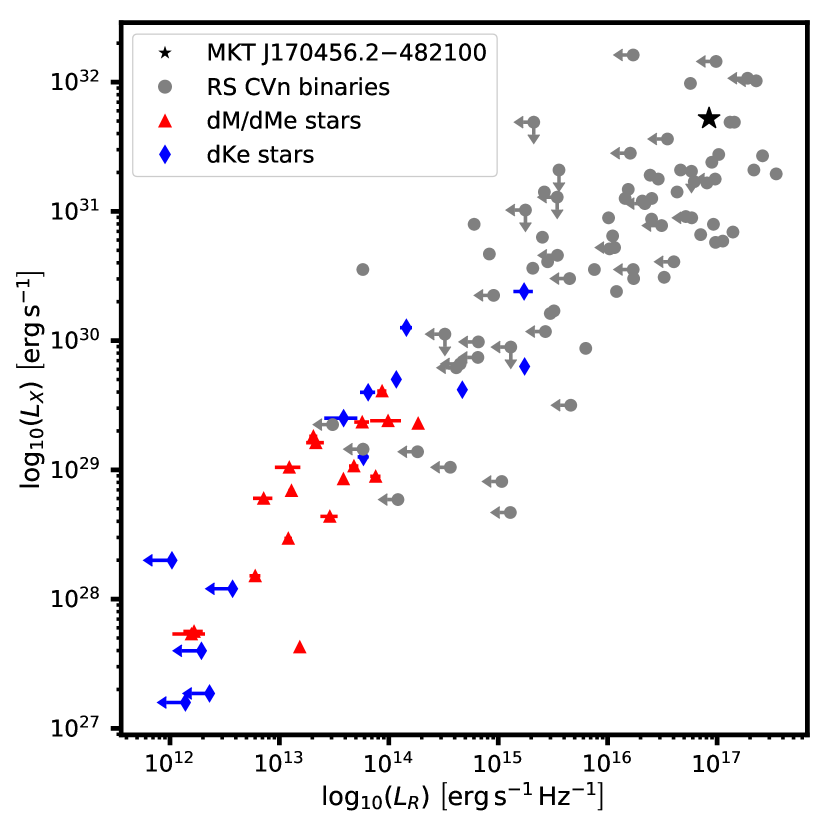
where is the flux of the star divided by the mean flux and is the spot contrast. A spot with the same intensity as the photosphere of the star would have , while a completely dark spot would have (Morris et al., 2018). Sunspots have a contrast value of . The covering fractions for the ASAS-SN V- and g-band semesters are shown in Table 6, suggesting that 10 per cent of the stellar disc is spotted as a temporal average. If TYC 8332-2529-1 is spotted, the radio activity and X-ray observations could also be from the star, similar to an RS CVn system. Guedel & Benz (1993) showed that there is a correlation between the average soft X-ray luminosity and radio luminosity for active stars. If we place the average radio luminosity and X-ray luminosity of MKT J170456.2482100 on the Benz-Güdel plot in Figure 12, then it fits well with the known values for RS CVn systems.
| Band | Semester start date | ||||
|---|---|---|---|---|---|
| V | 2016-03-10 | 0.12 | 0.17 | 0.24 | 1.21 |
| V | 2016-05-21 | 0.07 | 0.09 | 0.13 | 0.66 |
| V | 2017-01-24 | 0.18 | 0.27 | 0.37 | 1.87 |
| V | 2018-02-01 | 0.14 | 0.20 | 0.27 | 1.37 |
| g | 2018-02-26 | 0.05 | 0.08 | 0.11 | 0.54 |
| g | 2018-06-13 | 0.17 | 0.24 | 0.34 | 1.70 |
| V | 2018-06-30 | 0.11 | 0.16 | 0.23 | 1.14 |
| g | 2019-01-25 | 0.15 | 0.22 | 0.31 | 1.55 |
The minimum mass for a star to have evolved into a sub-giant in is (e.g. Marigo et al., 2017; Tang et al., 2014; Chen et al., 2015, 2014). TYC 8332-2529-1 is not significantly metal-poor, but to take into account possible metallicity effects (McDonald & Zijlstra, 2015) we use a conservative minimum mass for the star of . We know from the spectra that the velocity amplitude of TYC 8332-2529-1 is , and if we assume, from the sinusoidal shape of the radial velocity curve shown in Figure 8, that the orbit is circular we can then use the mass function to calculate the mass of the companion ():
| (2) |
where and are the mass and radial velocity amplitude of TYC 8332-2529-1 respectively, is the inclination of the binary system, and is the orbital period. Assuming an inclination of , a period of from the optical photometry, and a K-star mass of gives a minimum companion mass of and a semi-major axis of . If the mass of TYC 8332-2529-1 is between and (Section 4.2), then an inclination of gives a minimum companion mass of . These values show that the companion may be a white dwarf.
However, if we interpret the spectral variations we see as absorption lines from a companion star on the opposite side of the barycentre to TYC 8332-2529-1, its low radial velocity amplitude (; see Sec. 5.3.3) requires some explanation. The binary companion to TYC 8332-2529-1 does not significantly affect the shape of the SED (Section 4.2; Figure 6). The blue and UV photometry in particular mean that it is intrinsically much fainter and/or has a temperature less than . If the companion is a main-sequence star, this combination restricts its mass to .
Still assuming that the is from a companion to TYC 8332-2529-1, we can take the ratio of the velocities to find a mass ratio. We then find that the mass of the companion is between and . Taking our conservative minimum mass of TYC 8332-2529-1, , provides a companion mass between and , which corresponds to a semi-major axis, for a circular orbit, of and respectively. Our modelled mass of TYC 8332-2529-1 , would mean a companion mass between and , which corresponds to a semi-major axis of and respectively. These masses are not compatible with a white dwarf, or with a star with a temperature less than , and would lead to significant tidal distortion of TYC 8332-2529-1, which would be visible in the optical lightcurve.
One possible explanation is that MKT J170456.2482100 is a triple-system, where the companion to TYC 8332-2529-1 is actually two objects orbiting each other, with the semi-major axis () of the inner orbit much smaller than the semi-major axis () of the outer orbit. If we assume that the inner orbit is circular with an inclination of , and is comprised of two objects of equal mass (and hence equal radial velocity), we can calculate the minimum radial velocity amplitude of those objects. If we assume the minimum masses from above (, , ), and a semi-major axis of per cent of the outer orbit (), then the velocity amplitude of one object in the inner orbit is . This is inconsistent with a radial velocity amplitude of , and the spectral variations we see would reflect these higher velocity amplitudes.
Further investigation into this system is required to determine the nature of the companion to TYC 8332-2529-1, as well as to confirm the origin of the X-ray, radio, and UV flux. As TYC 8332-2529-1 is chromospherically active, the X-ray, radio and UV emission may be from this star. A UV spectrum would confirm the nature of the UV emission. This MeerKAT field is being observed weekly by ThunderKAT until September 2023, and ASAS-SN continues to observe this field. This will help to determine whether the radio and optical variability is related, which will help determine whether the radio activity is from flaring activity on TYC 8332-2529-1. We are also observing MKT J170456.2482100 weekly in the X-ray for 9 weeks with Swift. This will help determine whether the source is variable in the X-ray. TESS observations of the source will be released later in 2019, which may reveal shorter timescale optical variability.
10 Conclusions
We report the discovery of MKT J170456.2482100, the first transient discovered with MeerKAT. MKT J170456.2482100 coincides with the K4-5V type sub-giant star TYC 8332-2529-1. Using of optical photometry from ASAS, KELT, and ASAS-SN we find that TYC 8332-2529-1 has a photometric period of . A model of the light curve which attributes the variability to the presence of stars spots explains the light curve shape, changing phase, and results in a reasonable covering fraction. Using spectra from SALT and LCO we find that the star is in a spectroscopic binary, with a velocity amplitude of . The X-ray and UV flux that we detect from the position of MKT J170456.2482100 indicates that this flux and the radio variability may be because the system is an RS CVn type system. There are absorption lines indicating spectral variation within the system, in anti-phase to the K-giant spectrum, at a radial velocity amplitude of . However, we lack sufficient data to identify this with a causative mechanism, as binary companions at this radial velocity do not make physical sense.
Acknowledgements
LND, MC, KMR, and BWS acknowledge support from the European Research Council (ERC) under the European Union’s Horizon 2020 research and innovation programme (grant agreement No 694745). This work was partly funded by the United Kingdom’s Science and Technologies Facilities Council (STFC) grant ST/P000649/1. DAHB acknowledges research support from the South African National Research Foundation. ET acknowledges financial support from the UnivEarthS Labex program of Sorbonne Paris Cité (ANR-10-LABX-0023 and ANR-11-IDEX-0005-02). PAW acknowledges support from the National Research Foundation (NRF) and the University of Cape Town (UCT). This research was supported by a Grant from the GIF, the German-Israeli Foundation for Scientific Research and Development. A.H. Acknowledges support from GIF. JCAM-J is the recipient of an Australian Research Council Future Fellowship (FT140404082), funded by the Australian Government. We acknowledge use of the Inter-University Institute for Data Intensive Astronomy (IDIA) data intensive research cloud for data processing. IDIA is a South African university partnership involving the University of Cape Town, the University of Pretoria and the University of the Western Cape. The MeerKAT telescope is operated by the South African Radio Astronomy Observatory (SARAO), which is a facility of the National Research Foundation, an agency of the Department of Science and Technology. We would like to thank the operators, SARAO staff and ThunderKAT Large Survey Project team. The Parkes radio telescope is part of the Australia Telescope National Facility which is funded by the Commonwealth of Australia for operation as a National Facility managed by CSIRO. Some of these observations were obtained with the Southern African Large Telescope under the Large Science Programme on transients, 2018-2-LSP-001 (PI: DAHB). This work makes use of observations from the LCO network. KELT data are made available to the community through the Exoplanet Archive on behalf of the KELT project team, kindly provided by Rudi Kuhn. This work has made use of data from the European Space Agency (ESA) mission Gaia.111111https://www.cosmos.esa.int/gaia, processed by the Gaia Data Processing and Analysis Consortium (DPAC, https://www.cosmos.esa.int/web/gaia/dpac/consortium) Funding for the DPAC has been provided by national institutions, in particular the institutions participating in the Gaia Multilateral Agreement. This research made use of Astropy,121212http://www.astropy.org a community-developed core Python package for Astronomy (Astropy Collaboration et al., 2013; Price-Whelan et al., 2018). This research made use of APLpy, an open-source plotting package for Python (Robitaille & Bressert, 2012). LND would like to thank Colin Clark, Mark Kennedy and Daniel Mata for useful and interesting discussions. We would like to thank the referee for their constructive comments on the manuscript.
References
- Allard et al. (2003) Allard F., Guillot T., Ludwig H.-G., Hauschildt P. H., Schweitzer A., Alexander D. R., Ferguson J. W., 2003, in E. Martín ed., IAU Symposium Vol. 211, Brown Dwarfs. p. 325
- Astropy Collaboration et al. (2013) Astropy Collaboration et al., 2013, A&A, 558, A33
- Bailer-Jones et al. (2018) Bailer-Jones C. A. L., Rybizki J., Fouesneau M., Mantelet G., Andrae R., 2018, AJ, 156, 58
- Bannister et al. (2011) Bannister K. W., Murphy T., Gaensler B. M., Hunstead R. W., Chatterjee S., 2011, MNRAS, 412, 634
- Benz & Guedel (1994) Benz A. O., Guedel M., 1994, A&A, 285, 621
- Bhandari et al. (2018) Bhandari S., et al., 2018, MNRAS, 478, 1784
- Biazzo et al. (2006) Biazzo K., Frasca A., Catalano S., Marilli E., 2006, A&A, 446, 1129
- Bower et al. (2007) Bower G. C., Saul D., Bloom J. S., Bolatto A., Filippenko A. V., Foley R. J., Perley D., 2007, ApJ, 666, 346
- Bramall et al. (2012) Bramall D. G., et al., 2012, in Ground-based and Airborne Instrumentation for Astronomy IV. p. 84460A, doi:10.1117/12.925935
- Bright et al. (2019) Bright J. S., et al., 2019, MNRAS, 486, 2721
- Brown et al. (2013) Brown T. M., et al., 2013, PASP, 125, 1031
- Buckley et al. (2006) Buckley D. A. H., Swart G. P., Meiring J. G., 2006, in Society of Photo-Optical Instrumentation Engineers (SPIE) Conference Series. p. 62670Z, doi:10.1117/12.673750
- Buckley et al. (2017) Buckley D. A. H., Meintjes P. J., Potter S. B., Marsh T. R., Gänsicke B. T., 2017, Nature Astronomy, 1, 0029
- Burgh et al. (2003) Burgh E. B., Nordsieck K. H., Kobulnicky H. A., Williams T. B., O’Donoghue D., Smith M. P., Percival J. W., 2003, in Iye M., Moorwood A. F. M., eds, Society of Photo-Optical Instrumentation Engineers (SPIE) Conference Series Vol. 4841, Instrument Design and Performance for Optical/Infrared Ground-based Telescopes. pp 1463–1471, doi:10.1117/12.460312
- Camilo et al. (2018) Camilo F., et al., 2018, ApJ, 856, 180
- Carbone et al. (2016) Carbone D., et al., 2016, MNRAS, 459, 3161
- Chandra & Frail (2012) Chandra P., Frail D. A., 2012, ApJ, 746, 156
- Chen et al. (2014) Chen Y., Girardi L., Bressan A., Marigo P., Barbieri M., Kong X., 2014, MNRAS, 444, 2525
- Chen et al. (2015) Chen Y., Bressan A., Girardi L., Marigo P., Kong X., Lanza A., 2015, MNRAS, 452, 1068
- Coppejans et al. (2016) Coppejans D. L., et al., 2016, MNRAS, 463, 2229
- Cordes & Lazio (2002) Cordes J. M., Lazio T. J. W., 2002, arXiv e-prints, pp astro–ph/0207156
- Craig et al. (1997) Craig N., et al., 1997, ApJS, 113, 131
- Crause et al. (2014) Crause L. A., et al., 2014, in Ground-based and Airborne Instrumentation for Astronomy V. p. 91476T, doi:10.1117/12.2055635
- Crawford et al. (2016) Crawford S. M., et al., 2016, in Ground-based and Airborne Instrumentation for Astronomy VI. p. 99082L, doi:10.1117/12.2232653
- Currie et al. (2014) Currie M. J., Berry D. S., Jenness T., Gibb A. G., Bell G. S., Draper P. W., 2014, in Manset N., Forshay P., eds, Astronomical Society of the Pacific Conference Series Vol. 485, Astronomical Data Analysis Software and Systems XXIII. p. 391
- Cutri et al. (2003) Cutri R. M., et al., 2003, 2MASS All Sky Catalog of point sources.. The IRSA 2MASS All-Sky Point Source Catalog, NASA/IPAC Infrared Science Archive.
- Cutri et al. (2013) Cutri R. M., et al., 2013, Technical report, Explanatory Supplement to the AllWISE Data Release Products
- Draine (2003) Draine B. T., 2003, ApJ, 598, 1017
- Fender et al. (2017) Fender R., et al., 2017, arXiv e-prints, p. arXiv:1711.04132
- Fong et al. (2015) Fong W., Berger E., Margutti R., Zauderer B. A., 2015, ApJ, 815, 102
- Fouqué et al. (2000) Fouqué P., et al., 2000, Astronomy and Astrophysics Supplement Series, 141, 313
- Frail et al. (2012) Frail D. A., Kulkarni S. R., Ofek E. O., Bower G. C., Nakar E., 2012, ApJ, 747, 70
- Frasca et al. (2005) Frasca A., Biazzo K., Catalano S., Marilli E., Messina S., Rodonò M., 2005, A&A, 432, 647
- Gaia Collaboration et al. (2016) Gaia Collaboration et al., 2016, A&A, 595, A1
- Gaia Collaboration et al. (2018) Gaia Collaboration et al., 2018, A&A, 616, A1
- García-Sánchez et al. (2003) García-Sánchez J., Paredes J. M., Ribó M., 2003, A&A, 403, 613
- Guedel & Benz (1993) Guedel M., Benz A. O., 1993, ApJ, 405, L63
- Gunn (1996) Gunn A. G., 1996, Irish Astronomical Journal, 23, 137
- Hall (1976) Hall D. S., 1976, in Fitch W. S., ed., Astrophysics and Space Science Library Vol. 60, IAU Colloq. 29: Multiple Periodic Variable Stars. p. 287, doi:10.1007/978-94-010-1175-4_15
- Hallinan et al. (2013) Hallinan G., Mooley K., Kulkarniet S., et al., 2013, VLASS White Paper
- Hallinan et al. (2017) Hallinan G., et al., 2017, Science, 358, 1579
- Hernandez et al. (2017) Hernandez M. S., Zharikov S., Neustroev V., Tovmassian G., 2017, MNRAS, 470, 1960
- Hill et al. (2005) Hill J. E., et al., 2005, in Siegmund O. H. W., ed., Society of Photo-Optical Instrumentation Engineers (SPIE) Conference Series Vol. 5898, UV, X-Ray, and Gamma-Ray Space Instrumentation for Astronomy XIV. pp 325–340, doi:10.1117/12.618026
- Høg et al. (2000) Høg E., et al., 2000, A&A, 355, L27
- Horesh et al. (2013) Horesh A., et al., 2013, ApJ, 778, 63
- Hotan et al. (2004) Hotan A. W., van Straten W., Manchester R. N., 2004, Publ. Astron. Soc. Australia, 21, 302
- Hyman et al. (2005) Hyman S. D., Lazio T. J. W., Kassim N. E., Ray P. S., Markwardt C. B., Yusef-Zadeh F., 2005, Nature, 434, 50
- Hyman et al. (2009) Hyman S. D., Wijnands R., Lazio T. J. W., Pal S., Starling R., Kassim N. E., Ray P. S., 2009, ApJ, 696, 280
- Jankowski et al. (2019) Jankowski F., et al., 2019, MNRAS, 484, 3691
- Johnston et al. (2008) Johnston S., et al., 2008, Experimental Astronomy, 22, 151
- Kniazev et al. (2016) Kniazev A. Y., Gvaramadze V. V., Berdnikov L. N., 2016, MNRAS, 459, 3068
- Kochanek et al. (2017) Kochanek C. S., et al., 2017, PASP, 129, 104502
- Kuiack et al. (2019) Kuiack M., Huizinga F., Molenaar G., Prasad P., Rowlinson A., Wijers R. A. M. J., 2019, MNRAS, 482, 2502
- Lacy et al. (2019) Lacy M., et al., 2019, arXiv e-prints, p. arXiv:1907.01981
- Lomb (1976) Lomb N. R., 1976, Ap&SS, 39, 447
- Maan & van Leeuwen (2017) Maan Y., van Leeuwen J., 2017, arXiv e-prints,
- Marigo et al. (2017) Marigo P., et al., 2017, ApJ, 835, 77
- Marsh et al. (2016) Marsh T. R., et al., 2016, Nature, 537, 374
- Mason et al. (2000) Mason K. O., Cropper M. S., Kennedy T. E., Nousek J., Roming P., McLelland M., 2000, in AAS/High Energy Astrophysics Division #5. p. 34.11
- McDonald & Zijlstra (2015) McDonald I., Zijlstra A. A., 2015, MNRAS, 448, 502
- McDonald et al. (2012) McDonald I., Zijlstra A. A., Boyer M. L., 2012, MNRAS, 427, 343
- McDonald et al. (2017) McDonald I., Zijlstra A. A., Watson R. A., 2017, MNRAS, 471, 770
- McMullin et al. (2007) McMullin J. P., Waters B., Schiebel D., Young W., Golap K., 2007, in Shaw R. A., Hill F., Bell D. J., eds, Astronomical Society of the Pacific Conference Series Vol. 376, Astronomical Data Analysis Software and Systems XVI. p. 127
- Mohan & Rafferty (2015) Mohan N., Rafferty D., 2015, PyBDSF: Python Blob Detection and Source Finder, Astrophysics Source Code Library (ascl:1502.007)
- Mooley et al. (2016) Mooley K. P., et al., 2016, ApJ, 818, 105
- Mooley et al. (2017) Mooley K. P., et al., 2017, MNRAS, 467, L31
- Mooley et al. (2018) Mooley K. P., et al., 2018, ApJ, 857, 143
- Morello et al. (2019) Morello V., et al., 2019, MNRAS, 483, 3673
- Morris et al. (2018) Morris B. M., Curtis J. L., Douglas S. T., Hawley S. L., Agüeros M. A., Bobra M. G., Agol E., 2018, AJ, 156, 203
- Murphy et al. (2013) Murphy T., et al., 2013, Publ. Astron. Soc. Australia, 30, e006
- Murphy et al. (2017) Murphy T., et al., 2017, MNRAS, 466, 1944
- O’Brien et al. (2015) O’Brien T., Rupen M., Chomiuk L., Ribeiro V., Bode M., Sokoloski J., Woudt P. A., 2015, in Advancing Astrophysics with the Square Kilometre Array (AASKA14). p. 62 (arXiv:1502.04927)
- Ofek et al. (2011) Ofek E. O., Frail D. A., Breslauer B., Kulkarni S. R., Chandra P., Gal-Yam A., Kasliwal M. M., Gehrels N., 2011, ApJ, 740, 65
- Offringa (2010) Offringa A. R., 2010, AOFlagger: RFI Software (ascl:1010.017)
- Osten (2008) Osten R. A., 2008, arXiv e-prints, p. arXiv:0801.2573
- Osten & Bastian (2008) Osten R. A., Bastian T. S., 2008, ApJ, 674, 1078
- Pepper et al. (2007) Pepper J., et al., 2007, Publications of the Astronomical Society of the Pacific, 119, 923
- Perera et al. (2018) Perera B. B. P., et al., 2018, MNRAS, 478, 218
- Pickles & Depagne (2010) Pickles A., Depagne É., 2010, PASP, 122, 1437
- Pietka et al. (2015) Pietka M., Fender R. P., Keane E. F., 2015, MNRAS, 446, 3687
- Pojmanski (1997) Pojmanski G., 1997, Acta Astron., 47, 467
- Pojmanski (2002) Pojmanski G., 2002, Acta Astron., 52, 397
- Polisensky et al. (2016) Polisensky E., et al., 2016, ApJ, 832, 60
- Potter et al. (2010) Potter S. B., et al., 2010, MNRAS, 402, 1161
- Prasad et al. (2016) Prasad P., et al., 2016, Journal of Astronomical Instrumentation, 5, 1641008
- Price-Whelan et al. (2018) Price-Whelan A. M., et al., 2018, AJ, 156, 123
- Rajwade et al. (2018) Rajwade K., Chennamangalam J., Lorimer D., Karastergiou A., 2018, MNRAS, 479, 3094
- Ransom et al. (2002) Ransom S. M., Eikenberry S. S., Middleditch J., 2002, AJ, 124, 1788
- Richards et al. (2012) Richards J. W., Starr D. L., Miller A. A., Bloom J. S., Butler N. R., Brink H., Crellin-Quick A., 2012, The Astrophysical Journal Supplement Series, 203, 32
- Robitaille & Bressert (2012) Robitaille T., Bressert E., 2012, APLpy: Astronomical Plotting Library in Python, Astrophysics Source Code Library (ascl:1208.017)
- Roy et al. (2010) Roy S., Hyman S. D., Pal S., Lazio T. J. W., Ray P. S., Kassim N. E., 2010, ApJ, 712, L5
- Scargle (1982) Scargle J. D., 1982, ApJ, 263, 835
- Schinckel et al. (2012) Schinckel A. E., Bunton J. D., Cornwell T. J., Feain I., Hay S. G., 2012, in Ground-based and Airborne Telescopes IV. p. 84442A, doi:10.1117/12.926959
- Seaquist (1977) Seaquist E. R., 1977, ApJ, 211, 547
- Shappee et al. (2014) Shappee B. J., et al., 2014, ApJ, 788, 48
- Smirnov & Tasse (2015) Smirnov O. M., Tasse C., 2015, MNRAS, 449, 2668
- Sood & Campbell-Wilson (1994) Sood R., Campbell-Wilson D., 1994, International Astronomical Union Circular, 6006, 1
- Stewart et al. (2016) Stewart A. J., et al., 2016, MNRAS, 456, 2321
- Swinbank et al. (2015) Swinbank J. D., et al., 2015, Astronomy and Computing, 11, 25
- Takata et al. (2018) Takata J., Hu C. P., Lin L. C. C., Tam P. H. T., Pal P. S., Hui C. Y., Kong A. K. H., Cheng K. S., 2018, ApJ, 853, 106
- Tang et al. (2014) Tang J., Bressan A., Rosenfield P., Slemer A., Marigo P., Girardi L., Bianchi L., 2014, MNRAS, 445, 4287
- Tasse et al. (2018) Tasse C., et al., 2018, A&A, 611
- Thyagarajan et al. (2011) Thyagarajan N., Helfand D. J., White R. L., Becker R. H., 2011, ApJ, 742, 49
- Tingay et al. (2012) Tingay S., et al., 2012, in Resolving The Sky - Radio Interferometry: Past, Present and Future. p. 36 (arXiv:1212.1327)
- TraP contributors (2014) TraP contributors 2014, TraP: Transients discovery pipeline for image-plane surveys, Astrophysics Source Code Library (ascl:1412.011)
- Trigilio et al. (1993) Trigilio C., Umana G., Migenes V., 1993, MNRAS, 260, 903
- Varghese et al. (2019) Varghese S. S., Obenberger K. S., Dowell J., Taylor G. B., 2019, ApJ, 874, 151
- Villadsen & Hallinan (2019) Villadsen J., Hallinan G., 2019, ApJ, 871, 214
- Walter et al. (1987) Walter F. M., Neff J. E., Gibson D. M., Linsky J. L., Rodono M., Gary D. E., Butler C. J., 1987, A&A, 186, 241
- Wang et al. (2007) Wang N., Manchester R. N., Johnston S., 2007, MNRAS, 377, 1383
- Wray et al. (2004) Wray J. J., Eyer L., Paczyński B., 2004, MNRAS, 349, 1059
- Zauderer et al. (2011) Zauderer B. A., et al., 2011, Nature, 476, 425
- Zic et al. (2019) Zic A., et al., 2019, arXiv e-prints, p. arXiv:1906.06570
- van Haarlem et al. (2013) van Haarlem M. P., et al., 2013, A&A, 556, A2
Appendix A MKT J170456.2482100 MeerKAT flux density measurements
| Epoch (MJD) | Epoch (date) | Flux density (mJy) | Uncertainty (mJy) | Local RMS noise (mJy) |
|---|---|---|---|---|
| 58068 | 2017-11-11 | 0.048* | 0.026 | 0.036 |
| 58222 | 2018-04-14 | 0.156 | 0.018 | 0.018 |
| 58369 | 2018-09-08 | 0.043* | 0.026 | 0.039 |
| 58375 | 2018-09-14 | 0.189 | 0.025 | 0.026 |
| 58382 | 2018-09-21 | 0.116 | 0.024 | 0.026 |
| 58389 | 2018-09-28 | 0.339 | 0.034 | 0.035 |
| 58396 | 2018-10-05 | 0.137 | 0.027 | 0.028 |
| 58402 | 2018-10-11 | 0.227 | 0.026 | 0.027 |
| 58403 | 2018-10-12 | 0.355 | 0.043 | 0.044 |
| 58410 | 2018-10-19 | 0.152 | 0.028 | 0.028 |
| 58418 | 2018-10-27 | 0.098 | 0.025 | 0.026 |
| 58425 | 2018-11-03 | 0.113 | 0.026 | 0.027 |
| 58432 | 2018-11-10 | 0.140 | 0.026 | 0.027 |
| 58439 | 2018-11-17 | -0.027* | 0.040 | 0.031 |
| 58446 | 2018-11-24 | 0.067 | 0.027 | 0.033 |
| 58454 | 2018-12-02 | 0.096 | 0.030 | 0.031 |
| 58460 | 2018-12-08 | 0.136 | 0.029 | 0.031 |
| 58467 | 2018-12-15 | 0.198 | 0.031 | 0.031 |
| 58474 | 2018-12-22 | 0.202 | 0.036 | 0.036 |
| 58481 | 2018-12-29 | 0.189 | 0.035 | 0.036 |
| 58488 | 2019-01-05 | 0.192 | 0.030 | 0.030 |
| 58495 | 2019-01-12 | 0.164 | 0.031 | 0.032 |
| 58502 | 2019-01-19 | -0.005* | 0.006 | 0.028 |
| 58509 | 2019-01-26 | 0.211 | 0.029 | 0.029 |
| 58515 | 2019-02-01 | 0.025* | 0.017 | 0.030 |
| 58523 | 2019-02-09 | 0.119 | 0.033 | 0.035 |
| 58530 | 2019-02-16 | 0.077 | 0.026 | 0.029 |
| 58537 | 2019-02-23 | 0.115 | 0.029 | 0.031 |
| 58543 | 2019-03-01 | 0.103 | 0.027 | 0.028 |
| 58551 | 2019-03-09 | 0.091 | 0.028 | 0.031 |
| 58560 | 2019-03-18 | 0.038* | 0.023 | 0.035 |
| 58567 | 2019-03-25 | -0.112* | 0.408 | 0.032 |
| 58574 | 2019-04-01 | -0.116* | 0.373 | 0.037 |
| 58582 | 2019-04-09 | 0.108 | 0.036 | 0.041 |
| 58588 | 2019-04-15 | 0.084 | 0.028 | 0.031 |
| 58593 | 2019-04-20 | 0.032* | 0.020 | 0.032 |
| 58602 | 2019-04-29 | 0.059* | 0.029 | 0.038 |
| 58607 | 2019-05-04 | 0.033* | 0.020 | 0.031 |
| 58614 | 2019-05-11 | 0.109 | 0.032 | 0.034 |
| 58621 | 2019-05-18 | 0.097 | 0.035 | 0.039 |
| 58628 | 2019-05-25 | 0.105 | 0.031 | 0.033 |
| 58634 | 2019-05-31 | 0.113 | 0.034 | 0.036 |
| 58642 | 2019-06-08 | 0.015* | 0.012 | 0.040 |
| 58650 | 2019-06-16 | 0.115 | 0.032 | 0.035 |
| 58658 | 2019-06-24 | 0.051* | 0.024 | 0.031 |
| 58664 | 2019-06-30 | 2.122* | 150.234 | 0.031 |
| 58671 | 2019-07-07 | -0.002* | 0.002 | 0.030 |
| 58678 | 2019-07-14 | 0.179 | 0.030 | 0.030 |