Dipole-dipole correlations and the Debye process in the dielectric response of non-associating glass forming liquids
Abstract
The non-exponential shape of the -process observed in supercooled liquids is considered as one of the hallmarks of glassy dynamics and has thus been under study for decades, but is still poorly understood. For a polar van der Waals liquid, we show here – in line with a recent theory – that dipole-dipole correlations give rise to an additional process in the dielectric spectrum slightly slower than the -relaxation, which renders the resulting combined peak narrower than observed by other experimental techniques. This is reminiscent of the Debye process found in monohydroxy alcohols. The additional peak can be suppressed by weakening the dipole-dipole interaction via dilution with a nonpolar solvent.
The hallmarks of glassy dynamics are sometimes characterized by the so-called “three nons”,Dyre (2006) which refer to the non-Arrhenius temperature dependence of characteristic time constants, the non-exponential time dependence of the structural relaxation and the non-linear behavior in response to small temperature changes.Giordano, Leporini, and Tosi (1996); Wang et al. (2008); Angell et al. (2000); Cavagna (2009); Donth (2013) Despite decades of research and various proposed theories, no consensus about the origin of these features has been reached up to now. Concerning the spectral shape of the -relaxation, which is the focus of the present paper, previous studies have tried to point out scaling relations Dixon et al. (1990); Dendzik et al. (1997); Paluch, Dendzik, and Gburski (1998) or otherwise common features of the line shape.Blochowicz et al. (2003) In some works a connection of secondary relaxations with the spectral shape of the -process is highlighted,Ngai (2011) while others point out that the line shape may be universal altogether Nielsen et al. (2009) or at least similar for a subclass of particularly “simple” liquids. Niss and Hecksher (2018)
In any case, the structural relaxation is found to be non-exponential, which is most often described by the empirical Kohlrausch-Williams-Watts (KWW) equation in the time domain:Williams and Watts (1970) , with the correlation time and a stretching parameter . Although initially it was believed that a single-exponential relaxation () or, equivalently, a Debye peak in the dielectric loss reflects the structural relaxation in certain alcohols,Debye (1929) it later became clear that the structural -relaxation is non-exponential in all supercooled liquids and that monohydroxy alcohols are just exceptional in the sense that an additional Debye-like process is visible in dielectric measurements usually seen at longer times or lower frequencies.Böhmer, Gainaru, and Richert (2014) The occurrence of such an additional Debye process is usually ascribed to the relaxation of an average end-to-end dipole moment of transient chains formed by hydrogen bonding in monohydroxy alcohols.Gainaru et al. (2010)
However, based on the work of Dean, Dean (1996) KawasakiKawasaki (1994) and Cugliandolo et al. Cugliandolo et al. (2015), Déjardin et al.Déjardin, Titov, and Cornaton (2019) recently showed that an additional process should arise in the dielectric loss spectrum, whenever the Kirkwood correlation factor , which describes static correlations between interacting dipoles,Böttcher et al. (1978) exceeds unity, without explicitly referring to the existence of H-bonded structures. At first glance this may be surprising, as, e.g., in polar van der Waals liquids no additional slow relaxation was reported so far and the notion that dynamic cross-correlations may in general be negligible is fairly wide spread.Böttcher et al. (1978); Williams, Cook, and Hains (1972); Kivelson and Madden (1975) Remarkably, however, a correlation between stretching parameter and relaxation strength was reported recently for a set of 88 glass formers,Paluch et al. (2016) indicating a more narrow relaxation peak in highly dipolar liquids. Thus, in principle an additional collective and possibly narrow or Debye-like process could be present in polar liquids, albeit its strong overlap with the structural -relaxation might prevent a clear distinction of both processes. In fact, quite the same holds true in several monohydroxy alcohols, where previously a combination of depolarized dynamic light scattering (DDLS) measurements with broadband dielectric data allowed to disentangle both processes. It was demonstrated that indeed BDS and DDLS spectra are identical except for the Debye contribution in many alcoholsBöhmer et al. (2019); Gabriel, Pabst, and Blochowicz (2017); Gabriel et al. (2018a).
Therefore, in the following we address the question, if such an additional slow collective process can indeed be distinguished in a polar van der Waals liquid, namely tributyl phosphate (TBP), where no H-bonds are present and which exhibits at low temperatures.kir An indication that this could be the case is already given by the reported discrepancy between the non-exponential parameter obtained by BDS and by calorimetry.Wu et al. (2017) To achieve this goal, BDS and DDLS data are combined in a broad frequency and temperature range and the same method of analysis is applied as previously used for monohydroxy alcohols.Gabriel, Pabst, and Blochowicz (2017); Gabriel et al. (2018a, b) In addition, dilution experiments are performed on the polar liquid and it is demonstrated that intermolecular dipole correlations can indeed be suppressed.
Tributyl phosphate (Aldrich, 99%) was filtered into the light scattering sample cell by using 200 nm syringe filters, the dielectric samples were prepared without further purification. Depolarized dynamic light scattering was performed with a photon correlation setup described elsewhere in detail.Gabriel et al. (2018b) The obtained intensity autocorrelation function was transformed into the electric field correlation function via the Siegert relation for partially heterodyne signalsPabst et al. (2017) and afterwards Fourier transformed using the Filon integration rule to allow for a direct comparison between the generalized light scattering susceptibility and the dielectric loss.Gabriel et al. (2018b) BDS measurements were performed with a Novocontrol Alpha-N Analyzer in combination with a home-built time domain setup.Gabriel et al. (2018b) Special care was taken to calibrate temperature in the different setups in order to achieve an overall accuracy of 0.5 K.
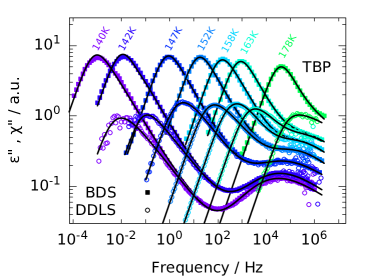
Figure 1 shows BDS and DDLS loss spectra of neat TBP in susceptibility representation. Since the absolute height of the DDLS data is not experimentally accessible in a straight forward manner, the DDLS data are shifted vertically so that they overlap with the BDS data in the high frequency region beyond the -relaxation peak at each respective temperature.
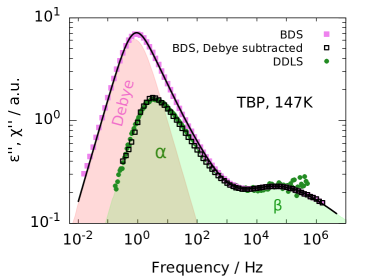
It can be seen that in the high frequency region, where a pronounced secondary relaxation is visible, both data sets have exactly the same shape. Deviations occur at low frequencies in the region of the main peak, which is located at lower frequencies and is more intense in BDS than in DDLS. As mentioned before this phenomenon is reminiscent of the situation found in monohydroxy alcohols, where a slow Debye process is found in BDS in addition to the -relaxation, the latter being identical in shape and position in both methods, whereas the Debye process is either notGabriel, Pabst, and Blochowicz (2017) or only very weaklyGabriel et al. (2018a) visible in DDLS and rheology.Gainaru et al. (2014) In order to quantitatively check, if such a picture of an additional Debye process in the BDS spectra is in accordance with the TBP data, first, the DDLS data are fitted with a model containing an - and a -process, which is described elsewhere in detail.Gabriel et al. (2018a) Then – in order to describe the BDS data at the same temperature – only a Debye process is added to the resulting DDLS fit function. As can be seen in Fig. 2, this approach is able to describe the BDS data perfectly.
In this figure the BDS data are also shown with the slow Debye process subtracted to visualize the agreement of the dielectric - and -relaxation with the DDLS data. This fitting procedure works at all investigated temperatures, as can be seen in Fig. 1. The implication is that on top of the -process, which is present in BDS and DDLS data alike, an intense Debye process is visible only in BDS, like it is the case in monohydroxy alcohols. As mentioned before, the occurrence of the Debye process in monohydroxy alcohols is usually ascribed to the formation of H-bonded supramolecular structures. However, since no H-bonds are present in TBP, this reasoning is not applicable here.
The theory of Dejardin et al.,Déjardin, Titov, and Cornaton (2019) however, predicts an additional process in the dynamic susceptibility of dipolar assemblies in the more general case, whenever the Kirkwood correlation factor exceeds unity, that means when the dipoles tend to align parallel. In cases where , i.e., with a preferentially antiparallel alignment of the dipoles, no additional process appears. Although the approximations made while deriving the Déjardin formula prevent a quantitative comparison of theory and experiment, qualitatively, an additional slow process in the dielectric spectra would be expected also for TBP, since at low temperatures.kir Therefore we tentatively attribute the Debye process only visible in the BDS data to arising from intermolecular dipolar interactions in TBP and we will further test this notion in the following.
The strength of the dipolar interactions should decrease when TBP is diluted with a non-polar solvent through a separation of the TBP molecules, thus leading to a vanishing of the additional Debye process upon dilution. If this is true, then, below a certain low concentration of TBP in the non-polar solvent, the shape of the main peak in the BDS data of the mixture should resemble the shape of the DDLS data. To test this hypothesis, we chose n-pentane (Arcos, 99+%) as the non-polar solvent, because of its full miscibility with TBP over the whole concentration range, its low melting point of approximately 140 K and its approximated glass transition temperature of around 105 K.Tg_ The latter is important, because it is known that in binary mixtures with too large a difference in of the components, concentration fluctuations may increase the width of the -process of the mixture upon addition of one component, while it decreases again on further increasing the concentration beyond an equimolar composition of the components.Shears and Williams (1973) Because the difference in of 35 K in the TBP/n-pentane mixture is quite small and we did not observe such a concentration dependent shape variation, we rule out concentration fluctuations to be the reason for broadening of the main process of the mixture. Instead, the results of the BDS measurements on the mixtures with molar ratios down to 11 mol % TBP are shown for the temperature of 147 K in figure 3. We note that no loss peak could be detected for neat n-pentane down to the instrumental resolution.
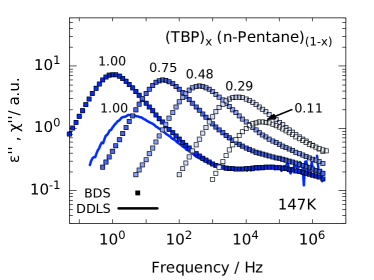
It can be seen in this figure that with increasing concentration of n-pentane the main peak shifts to higher frequencies and decreases in intensity. Both effects are, however, expected since on the one hand n-pentane has a lower glass transition temperature than TBP and acts thus as a “plasticizer” in the mixture, accelerating the TBP dynamics, and on the other hand the mixture is getting less polar with increasing n-pentane concentration, thus decreasing the dielectric strength. However, an other effect is clearly visible by eye from Fig. 3: As the concentration of TBP decreases, the width of the main peak increases. Provided this broadening is due to the vanishing of the additional interaction induced Debye process, there should be a concentration of TBP at which this process is no longer detectable and thus for even lower TBP concentrations, no further broadening should occur. Furthermore, the remaining -process should have the same spectral shape as detected by DDLS, since the DDLS spectrum resembles the BDS spectrum without the Debye peak, as shown in Fig. 2. This notion is tested in Fig. 4, where the data of neat TBP measured by BDS and DDLS and mixtures of TBP and n-pentane with 29 and 11 mol-% TBP are shown, scaled in such way that the peak heights and the low frequency flank of each data set coincides. Temperatures are chosen in such way that the main peak is located at around 1 Hz at this respective temperatures.
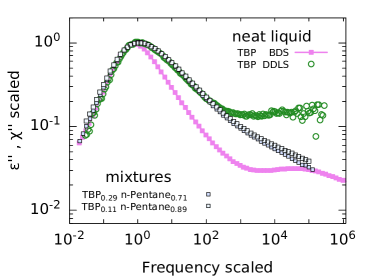
It can be seen from Fig. 4 that for the TBP/n-pentane mixtures with 29 and 11 mol % TBP the spectral shapes are the same, indicating indeed a limiting concentration of TBP, below which no further broadening occurs. In addition, the peak widths resemble the one of the DDLS data of neat TBP, whereat the BDS spectrum of neat TBP is markedly narrower. We note, that it was already observed by Wu et al.Wu et al. (2017) that the spectral width of BDS data of TBP is markedly narrower than the one obtained by differential scanning calorimetry (DSC). More precisely, they found the spectral width of the BDS peak in terms of the parameter to be 0.73 and for the DSC spectrum = 0.48. To compare the spectral shape of our DDLS data or the low concentration TBP mixtures, respectively, with the one from DSC measurements, we used the same procedure as done by Wu et al. for comparing BDS with DSC: We fit our data with Havriliak-Negami equation (HN):Havriliak and Negami (1967)
| (1) |
and transform the HN paramters a,b into via . In doing so we obtain a of 0.49, which is in very good agreement with 0.48 found by DSC. All in all, these findings indicate that in the BDS spectrum of neat TBP an additional Debye process is present, which can be suppressed by diluting TBP in order to minimize the interaction between TBP molecules. The resulting spectral shape in the dilute regime is identical with the spectral shape found for neat TBP with DDLS and DSC, thus exhibiting the real shape of the -process.
These findings can be put in a more general context, if one considers the recent finding by Paluch et al.Paluch et al. (2016) that for a large number of van der Waals molecular glass formers the stretching parameter of the -relaxation is correlated with the dielectric strength near the glass transition temperature . This means that the stronger the dielectric loss of the molecule is, the narrower is its dielectric -peak. The authors explained this finding with the dipole-dipole interaction contribution to the attractive intermolecular potential, which enhances its harmonicity and thus making the -loss peak narrower and the parameter larger, respectively. How different experimental techniques reflect these differences in intermolecular potential, however, remains unclear.
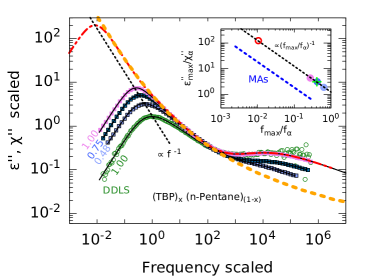
Even more recently, GainaruGainaru (2019) showed that the above correlation can be represented by a scaling relation, where the dielectric spectra of different polar molecules scale onto a universal ”envelope” curve. Evaluating each point of this envelope with respect to its slope, from which is deduced, and its amplitude, he could reproduce the correlation of and found by Paluch et al.. That means that, in absence of a secondary relaxation, all molecular glass formers should share a common high frequency dielectric slope and just the main relaxation peak is located at different points on the envelope depending on the polarity of the molecule. In the light of the presented findings it is interesting to figure out, if this envelope is consistent with the idea of an additional Debye process being present due to interacting dipoles. Thus, we test this picture for TBP and its mixtures with n-pentane in Fig. 5.
In this figure the envelope is taken from Ref. 37 (orange dashed line) and the spectra of neat and mixed TBP are scaled horizontally and vertically in such way that a good overlap with the envelope is achieved. Due to the pronounced secondary relaxation, the overlap could be obtained in a small frequency window only, but since the slope of the envelope changes smoothly over the whole frequency range until it reaches at very low frequencies, the superposition is unambiguous. Solid black lines are fits, which are obtained for the BDS data – after superposition on the envelope – by adding a Debye process to the DDLS fit. The red dashed line is obtained by adding an arbitrary Debye process to the DDLS with the restriction on and such that the resulting spectra resembles the envelope. This procedure shows on the one hand that the data for neat and diluted TBP is in accordance with the Gainaru envelope and thus with the Paluch correlation, and on the other hand that the proposed picture of - plus additional Debye process can reproduce the envelope for TBP, its mixtures and also a hypothetical, even stronger Debye processes.
The non-trivial point about this representation is, that only certain combinations of and with respect to a given and can reproduce the envelope. The dashed black line in Fig. 5 is proportional to and placed in such way that it passes through all the peak maxima. In accordance, the inset shows the peak height from BDS divided by the one from DDLS as a function of the peak position from BDS divided by the one from DDLS. The black dashed line represents a power law , which fits the data of pure and diluted TBP. The green cross is obtained from BDS and DDLS data of glycerolGainaru (2019) in the same way as for TBP. It coincides perfectly with the black dashed line, indicating the same behavior for glycerol, a hydrogen bonding liquid, and TBP. The correlation found for the Debye- and -process of a homologous series of monohydroxy alcohols (MAs) and their mixturesBierwirth, Gainaru, and Böhmer (2018) is also shown as a blue dashed line with the same slope but different intercept. Thus, at the same peak height, the Debye process is more separated from the -process in MAs than in other liquids, but holds in both cases.
The fact that the separation of the Debye- and -process increases with increasing can be understood qualitatively by combining the static and dynamic part of the Déjardin theory.Déjardin et al. (2018); Déjardin, Titov, and Cornaton (2019) Both parts incorporate the interaction parameter , where is the number density, the dipole moment and T the temperature. In the static part of the theory, the Kirkwood correlation factor increases with increasing , leading to a higher through the Kirkwood-Fröhlich equation.Böttcher et al. (1978) In the dynamic part, the peak appearing for shifts to lower frequencies for increasing , which renders the combined peak of - and Debye process narrower, as seen in figure 5. Together, the experimental observed correlation between the dielectric strength and the dielectric loss peak shape parameter is qualitatively rationalized by this theory.
In conclusion, we have shown that in the dielectric spectrum of the van der Waals liquid TBP, in addition to the -process probed by depolarized dynamic light scattering, a Debye process is present, which arises due to dipole-dipole interactions, in line with a recent theory by Déjardin et al.. By dilution with the apolar solvent n-pentane, the dipole-dipole interactions could be reduced and the Debye process vanished. We showed that phenomenologically this picture is able to rationalize correlations between the dielectric strength and the shape parameter , which were found recently for a large number of glass forming liquids.
We are indebted to Pierre-Michel Déjardin, University of Perpignan, and Yann Cornaton, University of Strasbourg, for fruitful discussions. We are also grateful to Ernst Rössler, Bayreuth, for making the dielectric time domain setup available to us. Financial support by the Deutsche Forschungsgemeinschaft under grant No. BL 1192/3 is gratefully acknowledged.
References
- Dyre (2006) J. C. Dyre, “Colloquium: The glass transition and elastic models of glass-forming liquids,” Rev. Mod. Phys. 78, 953 (2006).
- Giordano, Leporini, and Tosi (1996) M. Giordano, D. Leporini, and M. P. Tosi, Non-Equilibrium Phenomena in Supercooled Fluids, Glasses and Amorphous Materials (World Scientific, 1996).
- Wang et al. (2008) L.-M. Wang, Y. Tian, R. Liu, and R. Richert, “Calorimetric versus kinetic glass transitions in viscous monohydroxy alcohols,” J. Chem. Phys. 128, 084503 (2008).
- Angell et al. (2000) C. A. Angell, K. L. Ngai, G. B. McKenna, P. F. McMillan, and S. W. Martin, “Relaxation in glassforming liquids and amorphous solids,” J. Appl. Phys. 88, 3113–3157 (2000).
- Cavagna (2009) A. Cavagna, “Supercooled liquids for pedestrians,” Phys. Rep. 476, 51–124 (2009).
- Donth (2013) E. Donth, The glass transition: relaxation dynamics in liquids and disordered materials, Vol. 48 (Springer Science & Business Media, 2013).
- Dixon et al. (1990) P. K. Dixon, L. Wu, S. R. Nagel, B. D. Williams, and J. P. Carini, “Scaling in the relaxation of supercooled liquids,” Phys. Rev. Lett. 65, 1108 (1990).
- Dendzik et al. (1997) Z. Dendzik, M. Paluch, Z. Gburski, and J. Ziolo, “On the universal scaling of the dielectric relaxation in dense media,” J. Phys. Condens. Matter 9, L339 (1997).
- Paluch, Dendzik, and Gburski (1998) M. Paluch, Z. Dendzik, and Z. Gburski, “On the parameters of the dixon–nagel scaling procedure,” J. Non-Cryst. Solids 232, 390–395 (1998).
- Blochowicz et al. (2003) T. Blochowicz, C. Tschirwitz, S. Benkhof, and E. Rössler, “Susceptibility functions for slow relaxation processes in supercooled liquids and the search for universal relaxation patterns,” J. Chem. Phys. 118, 7544–7555 (2003).
- Ngai (2011) K. Ngai, Relaxation and diffusion in complex systems (Springer Science & Business Media, 2011).
- Nielsen et al. (2009) A. I. Nielsen, T. Christensen, B. Jakobsen, K. Niss, N. B. Olsen, R. Richert, and J. C. Dyre, “Prevalence of approximate t relaxation for the dielectric process in viscous organic liquids,” J. Chem. Phys. 130, 154508 (2009).
- Niss and Hecksher (2018) K. Niss and T. Hecksher, “Perspective: Searching for simplicity rather than universality in glass-forming liquids,” J. Chem. Phys. 149, 230901 (2018).
- Williams and Watts (1970) G. Williams and D. C. Watts, “Non-symmetrical dielectric relaxation behaviour arising from a simple empirical decay function,” Trans.Faraday Soc. 66, 80–85 (1970).
- Debye (1929) P. J. W. Debye, Polar molecules (Chemical Catalog Company, Incorporated, 1929).
- Böhmer, Gainaru, and Richert (2014) R. Böhmer, C. Gainaru, and R. Richert, “Structure and dynamics of monohydroxy alcohols—milestones towards their microscopic understanding, 100 years after debye,” Physics Reports 545, 125–195 (2014).
- Gainaru et al. (2010) C. Gainaru, R. Meier, S. Schildmann, C. Lederle, W. Hiller, E. Rössler, and R. Böhmer, “Nuclear-magnetic-resonance measurements reveal the origin of the debye process in monohydroxy alcohols,” Phys. Rev. Lett. 105, 258303 (2010).
- Dean (1996) D. S. Dean, “Langevin equation for the density of a system of interacting langevin processes,” J.Phys. A 29, L613 (1996).
- Kawasaki (1994) K. Kawasaki, “Stochastic model of slow dynamics in supercooled liquids and dense colloidal suspensions,” Physica A 208, 35–64 (1994).
- Cugliandolo et al. (2015) L. F. Cugliandolo, P.-M. Déjardin, G. S. Lozano, and F. Van Wijland, “Stochastic dynamics of collective modes for brownian dipoles,” Physical Review E 91, 032139 (2015).
- Déjardin, Titov, and Cornaton (2019) P.-M. Déjardin, S. V. Titov, and Y. Cornaton, “Linear complex susceptibility of long-range interacting dipoles with thermal agitation and weak external ac fields,” Phys. Rev. B 99, 024304 (2019).
- Böttcher et al. (1978) C. Böttcher, O. van Belle, P. Bordewijk, and A. Rip, Theory of electric polarization, Vol. 1 (Elsevier Scientific Pub. Co., 1978).
- Williams, Cook, and Hains (1972) G. Williams, M. Cook, and P. Hains, “Molecular motion in amorphous polymers. consideration of the mechanism for , and () dielectric relaxations,” J. Chem. Soc. Faraday Trans. 68, 1045–1050 (1972).
- Kivelson and Madden (1975) D. Kivelson and P. Madden, “Theory of dielectric relaxation,” Mol. Phys. 30, 1749–1780 (1975).
- Paluch et al. (2016) M. Paluch, J. Knapik, Z. Wojnarowska, A. Grzybowski, and K. Ngai, “Universal behavior of dielectric responses of glass formers: role of dipole-dipole interactions,” Phys. Rev. Lett. 116, 025702 (2016).
- Böhmer et al. (2019) T. Böhmer, J. Gabriel, T. Richter, F. Pabst, and T. Blochowicz, “The influence of molecular architecture on the dynamics of h-bonded supramolecular structures in phenyl-propanols,” (2019), arXiv:1909.00646 [cond-mat.soft] .
- Gabriel, Pabst, and Blochowicz (2017) J. Gabriel, F. Pabst, and T. Blochowicz, “Debye process and -relaxation in 1-propanol probed by dielectric spectroscopy and depolarized dynamic light scattering,” J. Phys. Chem. B 121, 8847–8853 (2017).
- Gabriel et al. (2018a) J. Gabriel, F. Pabst, A. Helbling, T. Böhmer, and T. Blochowicz, “Nature of the debye-process in monohydroxy alcohols: 5-methyl-2-hexanol investigated by depolarized light scattering and dielectric spectroscopy,” Phys. Rev. Lett. 121, 035501 (2018a).
- (29) We calculated the Kirkwood factor employing the well known Kirkwood-Froehlich equation, using linear extrapolated densities from Ref. 40 and , where the refactive index was measured between 283 K and 323 K using an Abbe-Refractometer and extrapolated linearly. The dipole moment of 2.6 D from dilution measurements was usedPetkovic, Kezele, and Rajic (1973) as well as the molar mass of 266.32mol/g. We obtain at 147 K. We note that this is at odds with the Kirkwood factor reported in Ref. 30. This is mostly due to the fact that in this work is used, because the strong relaxation was negelected, which is not justified.
- Wu et al. (2017) T. Wu, X. Jin, M. K. Saini, Y. D. Liu, K. Ngai, and L.-M. Wang, “Presence of global and local -relaxations in an alkyl phosphate glass former,” J. Chem. Phys. 147, 134501 (2017).
- Gabriel et al. (2018b) J. Gabriel, F. Pabst, A. Helbling, T. Böhmer, and T. Blochowicz, “Depolarized dynamic light scattering and dielectric spectroscopy: Two perspectives on molecular reorientation in supercooled liquids,” in The Scaling of Relaxation Processes (Springer, 2018) pp. 203–245.
- Pabst et al. (2017) F. Pabst, J. Gabriel, P. Weigl, and T. Blochowicz, “Molecular dynamics of supercooled ionic liquids studied by light scattering and dielectric spectroscopy,” Chem. Phys. 494, 103–110 (2017).
- Gainaru et al. (2014) C. Gainaru, R. Figuli, T. Hecksher, B. Jakobsen, J. Dyre, M. Wilhelm, and R. Böhmer, “Shear-modulus investigations of monohydroxy alcohols: Evidence for a short-chain-polymer rheological response,” Phys. Rev. Lett. 112, 098301 (2014).
- (34) The glass transition temperature of n-Pentane is approximated by extrapolation the s of the mixtures (taken as the temperature at which =100s) to neat n-Pentane by assuming ideal mixing.
- Shears and Williams (1973) M. F. Shears and G. Williams, “Molecular dynamics of the supercooled liquid state. a dielectric study of the low frequency motions of fluorenone in o-terphenyl and mixed solvents and of di-n-butyl phthalate in o-terphenyl,” J. Chem. Soc. 69, 608–621 (1973).
- Havriliak and Negami (1967) S. Havriliak and S. Negami, “A complex plane representation of dielectric and mechanical relaxation processes in some polymers,” Polymer 8, 161–210 (1967).
- Gainaru (2019) C. Gainaru, “Spectral shape simplicity of viscous materials,” Phys.Rev. E 100, 020601 (2019).
- Bierwirth, Gainaru, and Böhmer (2018) S. Bierwirth, C. Gainaru, and R. Böhmer, “Communication: Correlation of terminal relaxation rate and viscosity enhancement in supramolecular small-molecule liquids,” J. Chem. Phys. 148, 221102 (2018).
- Déjardin et al. (2018) P. Déjardin, Y. Cornaton, P. Ghesquière, C. Caliot, and R. Brouzet, “Calculation of the orientational linear and nonlinear correlation factors of polar liquids from the rotational dean-kawasaki equation,” J. Chem. Phys. 148, 044504 (2018).
- Tian and Liu (2007) Q. Tian and H. Liu, “Densities and viscosities of binary mixtures of tributyl phosphate with hexane and dodecane from (298.15 to 328.15) k,” J. Chem. Eng. Data 52, 892–897 (2007).
- Petkovic, Kezele, and Rajic (1973) D. M. Petkovic, B. Kezele, and D. Rajic, “Dipole moments of some neutral organic phosphates,” J. Phys. Chem. 77, 922–924 (1973).