A Molecular-MNIST Dataset for Machine Learning Study on Diffraction Imaging and Microscopy
Yan Zhang1, Steve Farrell1, Michael Crowley2, Lee Makowski3, Jack Deslippe1
1NERSC, Lawrence Berkeley National Laboratory, Berkeley, CA
2Bioscience Division, National Renewable Energy Laboratory, Golden, CO
3Department of Bioengineering, Northeastern University, Boston, MA
yanzhang@lbl.gov
Abstract
An image dataset of 10 different size molecules, where each molecule has 2,000 structural variants, is generated from the 2D cross-sectional projection of Molecular Dynamics trajectories. The purpose of this dataset is to provide a benchmark dataset for the increasing need of machine learning, deep learning and image processing on the study of scattering, imaging and microscopy.
OCIS codes: 150.0150, 100.0100, 180.0180, 300.0300, 290.0290.
1 Introduction
Many imaging techniques require phase retrieval, such as coherent diffraction imaging, electron microscopy and etc. These iterative optimization algorithms are computational expensive and difficult to converge. Unlike iterative optimization methods, supervised machine learning using two stage training-testing becomes a great advantage for fast real-time inference since the most expensive computations are performed during training. Deep Learning plays a very important role tackling these type of problems but requires large dataset to train the multi-layer model parameters of the network [1]. Here, we are interested in creating a molecular image dataset including shape images from real space and diffraction patterns from reciprocal space for machine learning practices. We call this dataset Molecular-MNIST because it consists 10 different size of molecules where each molecule has 2,000 structural variants - in an analogy of the famous 10-digit hand-written dataset MNIST [2].
2 Molecular-MNIST Dataset
2.1 3D Molecular Structures
The molecular structures were simulated using Charmm generating 200 long crystalline structure of various shape and size. It consists molecules of diamond shape of 2 2, 3 3, 4 4, 5 5, 6 6, 7 7, 8 8, 9 9 -chains, and hexagonal shape of 24 and 36 -chains. All of the molecules were simulated under structural dynamics in water buffer until equilibrium.
2.2 2D Cross-sectional Shape Images and Diffraction Patterns
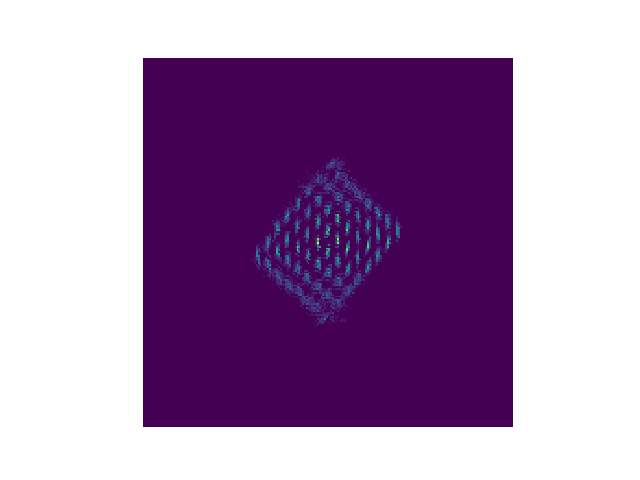
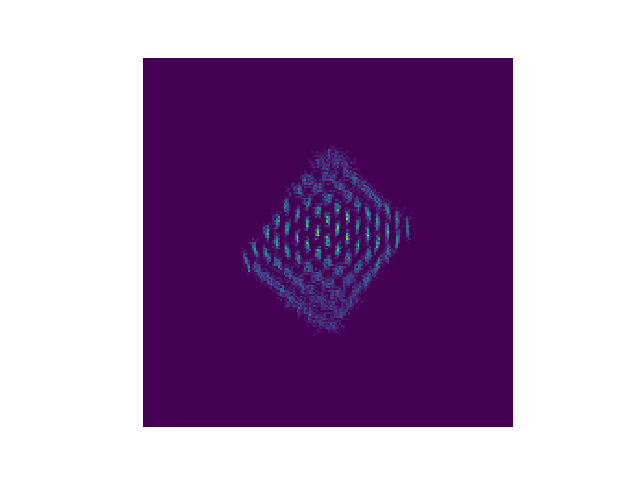
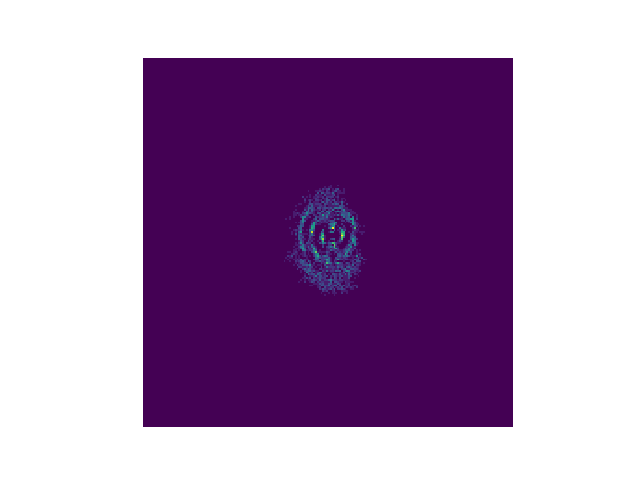
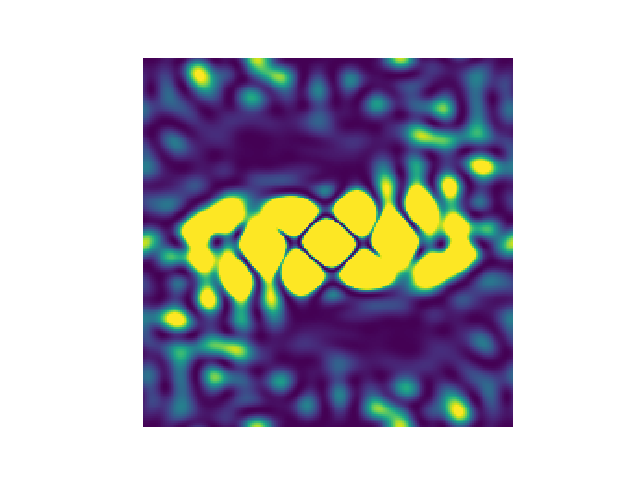
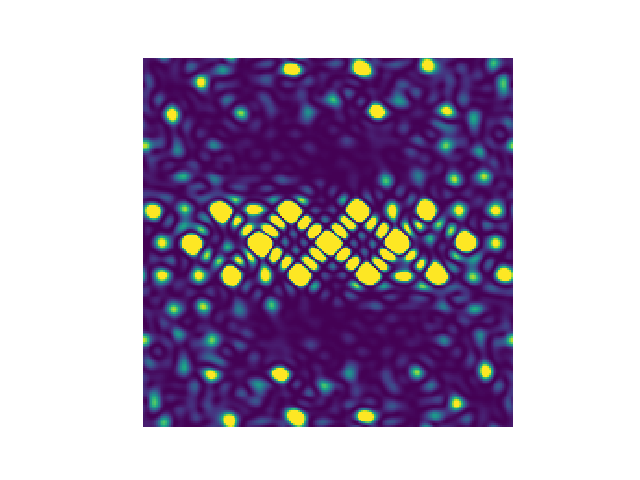
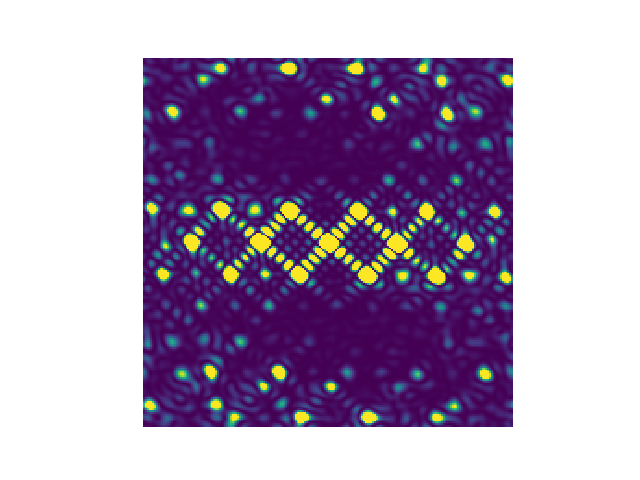
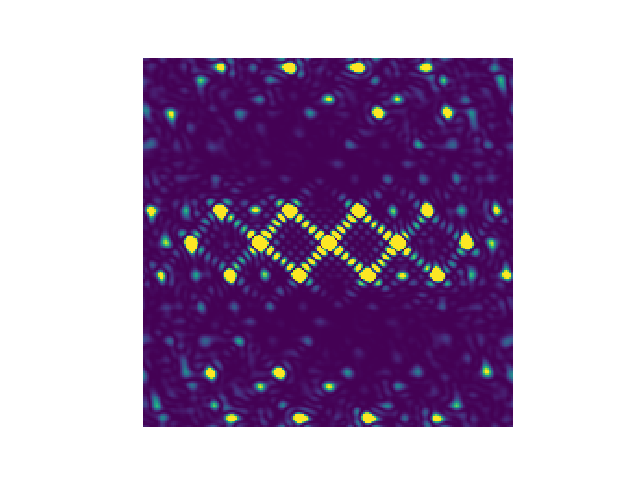
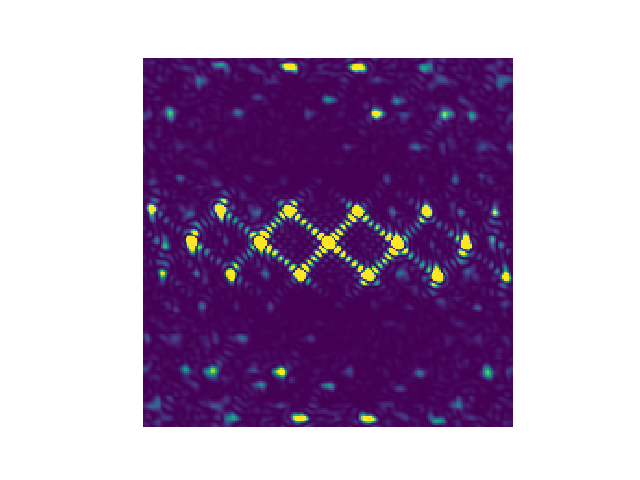
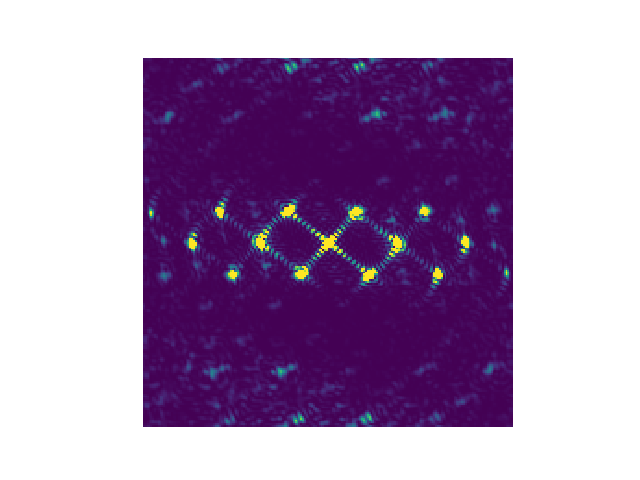
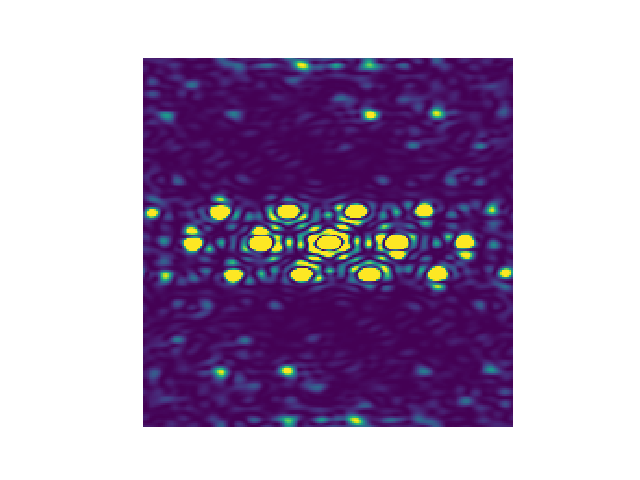
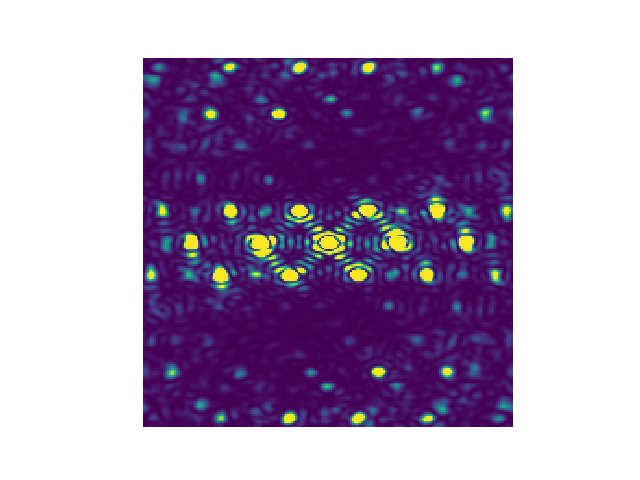
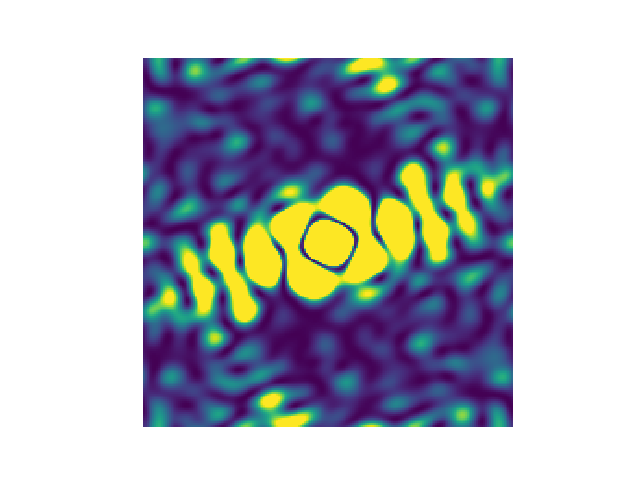
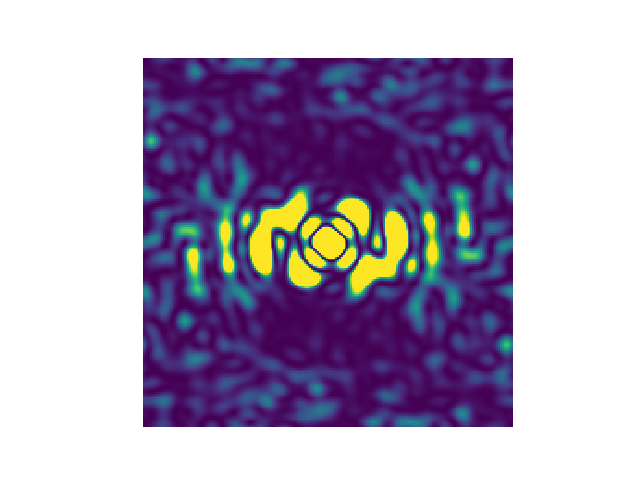
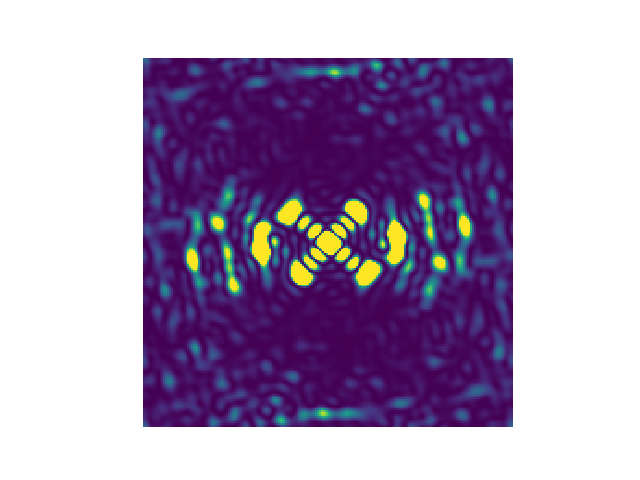
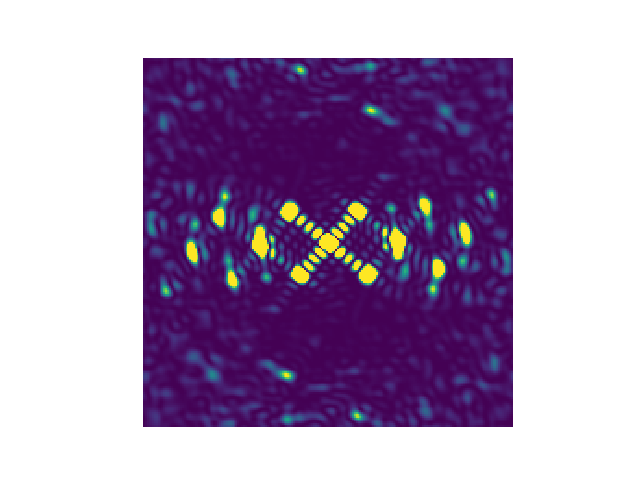
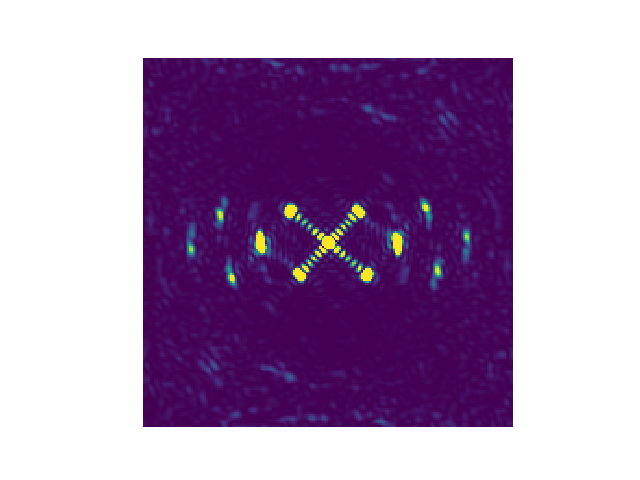
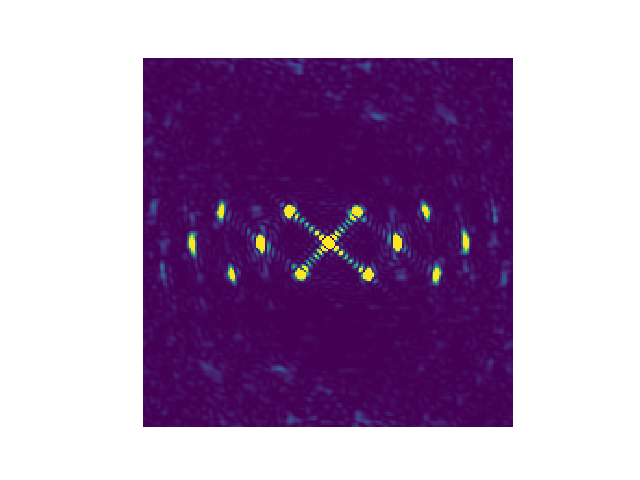
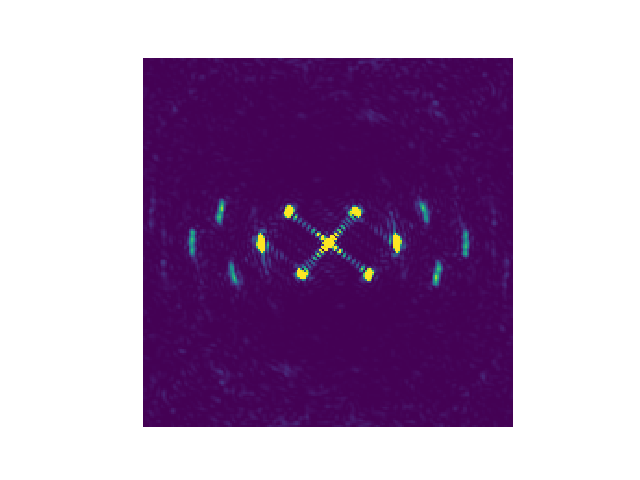
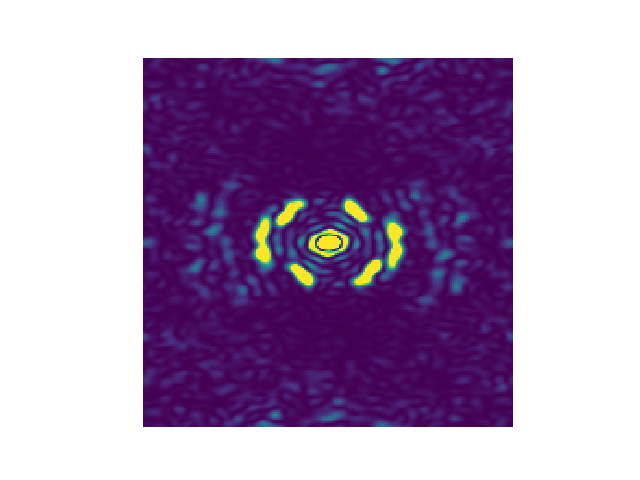
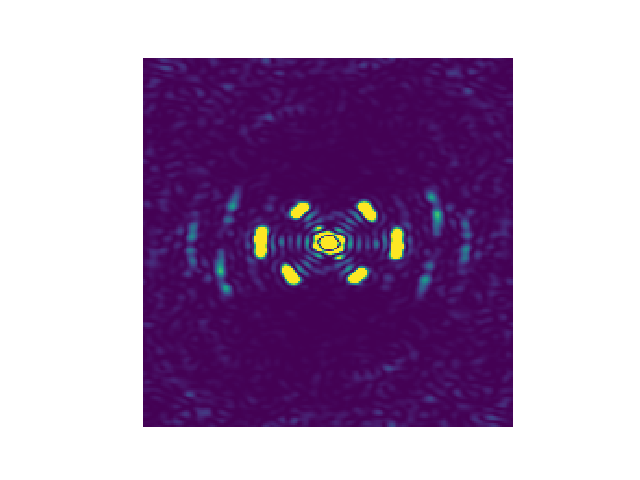
We projected the 3D atomic distribution of these molecular structures onto a 2D cross-sectional plane to create 2D shape images as shown in Fig.1. The positions of all the atoms in the 3D coordinates were projected onto a 2D grid using functions multiplied by their electron densities [3]. The image resolution was scaled to which is also changeable for higher resolution if necessary. We took the 2D Fourier Transform of the cross-sectional shape images and the diffraction patterns were the square of amplitude of the FFT results as shown in Fig.2.
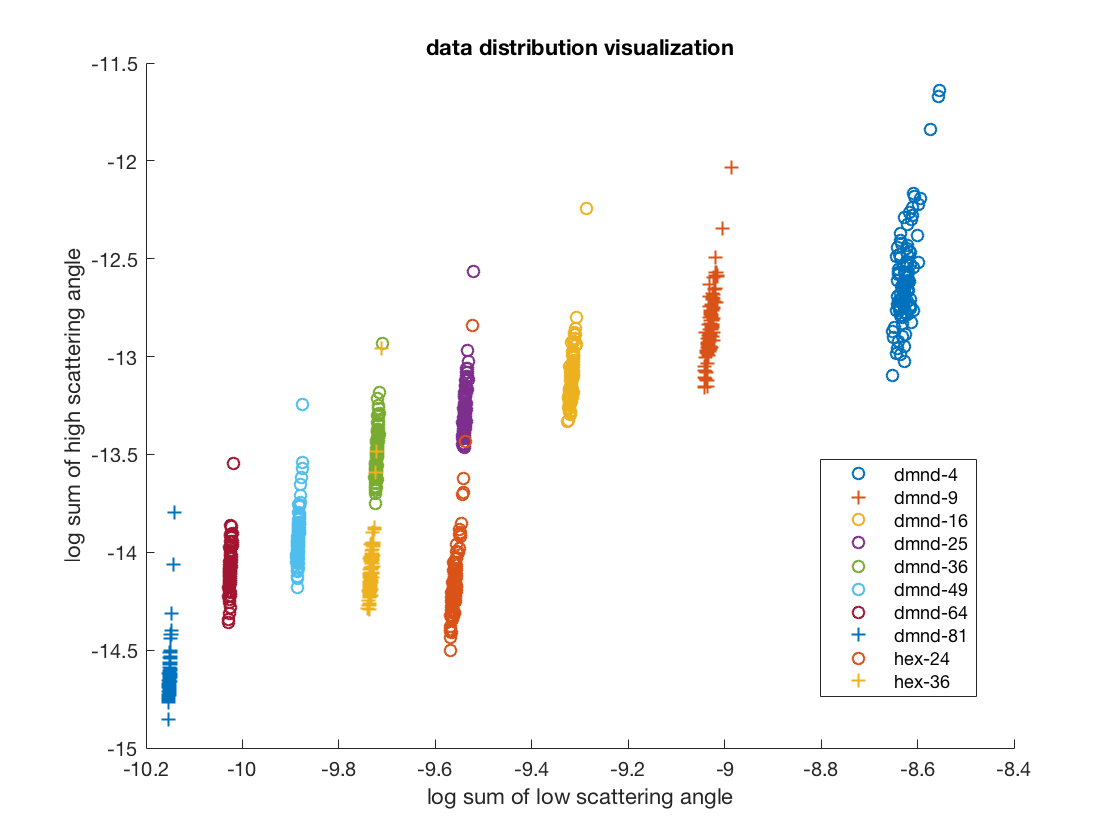
2.3 Data Distribution
In order to visualize the data distribution, we computed and scattered the log-sum of low frequency intensities versus the log-sum of high frequency intensities in a 2D-plot as shown in Fig 3 left.
3 Use cases and Conclusion
Here, we used a convolutional encoder-decoder network for diffraction inversion as shown in Fig.3 right. The encoder and decoder have symmetric architectures with each other and use only 3 3 kernels, similar with VGG-Net [4]. The encoder has 4 convolutional layers each with 8, 16, 32 and 64 kernels, followed by batch-normalization and ReLU activation. The decoder, or a deconvolutional network, takes the 64 features from the output of the encoder and passes it to its reversed architecture of the encoder. After fully trained, this network was capable to inference molecular shape without phase retrieval. We believe this Molecular-MNIST dataset has a huge potential by serving as a benchmark dataset for many deep learning studies. Download Molecular-MNIST at: https://www.dropbox.com/sh/t8unmhfm6epemlq/AAA6TSFNNSRe-e6JWlOZH5xra?dl=0


4 Acknowledgement
This research used resources of the National Energy Research Scientific Computing Center (NERSC), a U.S. Department of Energy Office of Science User Facility operated under Contract No. DE-AC02-05CH11231.
References
- [1] A. Krizhevsky, I. Sutskever and G. E. Hinton “Imagenet classification with deep convolutional neural networks,” in Advances in neural information processing systems, pp. 1097-1105 (2012).
- [2] Y. LeCun, “The MNIST database of handwritten digits,” http://yann. lecun. com/exdb/mnist/ (1998).
- [3] Y. Zhang, “Diffraction pattern simulation of cellulose fibrils using distributed and quantized pair distances,” in J. Appl. Crystallgr. 49(6): 2244-2248 (2016).
- [4] K. Simonyan, and A. Zisserman, “Very deep convolutional networks for large-scale image recognition,” arXiv preprint arXiv:1409.1556 (2014).