System size dependent avalanche statistics in the limit of high disorder
Abstract
We investigate the effect of the amount of disorder on the statistics of breaking bursts during the quasi-static fracture of heterogeneous materials. We consider a fiber bundle model where the strength of single fibers is sampled from a power law distribution over a finite range, so that the amount of materials’ disorder can be controlled by varying the power law exponent and the upper cutoff of fibers’ strength. Analytical calculations and computer simulations, performed in the limit of equal load sharing, revealed that depending on the disorder parameters the mechanical response of the bundle is either perfectly brittle where the first fiber breaking triggers a catastrophic avalanche, or it is quasi-brittle where macroscopic failure is preceded by a sequence of bursts. In the quasi-brittle phase, the statistics of avalanche sizes is found to show a high degree of complexity. In particular, we demonstrate that the functional form of the size distribution of bursts depends on the system size: for large upper cutoffs of fibers’ strength, in small systems the sequence of bursts has a high degree of stationarity characterized by a power law size distribution with a universal exponent. However, for sufficiently large bundles the breaking process accelerates towards the critical point of failure which gives rise to a crossover between two power laws. The transition between the two regimes occurs at a characteristic system size which depends on the disorder parameters.
I Introduction
The disorder of materials plays a crucial role in fracture phenomena when subject to mechanical loads. Experiments and theoretical calculations revealed that under constant or slowly varying external loads the fracture of heterogeneous materials proceeds in bursts of local breakings Petri et al. (1994); Maes et al. (1998); Deschanel et al. (2009); Castillo-Villa et al. (2013); Xu et al. (2019a); Baró et al. (2016). Such crackling events can be recorded in the form of acoustic signals providing insight into the microscopic dynamics of the fracture process Diodati et al. (1991); Lockner (1993); Meinders and Vliet (2008); Niccolini et al. (2011). Cracking bursts can be considered as precursors of the ultimate failure of the system, so that they can be exploited to forecast the impending catastrophic event Vasseur et al. (2015); Jiang et al. (2017); Koivisto et al. (2016); Pradhan et al. (2005); Davidsen et al. (2007); Sornette (2002); Niccolini et al. (2011); Voight (1988); Bell et al. (2013).
The intensity of the crackling activity has been found to depend on the degree of materials’ disorder Rosti et al. (2009); Vasseur et al. (2015); Xu et al. (2019b): in the limiting case of zero disorder, the ultimate failure occurs in an abrupt way with hardly any precursory activity Zapperi et al. (1997); Picallo et al. (2010). However, the presence of disorder gives rise to a gradual cracking process where macroscopic failure occurs as a result of the intermittent steps of damage accumulation Guarino et al. (1998); Ramos et al. (2013); Santucci et al. (2004). Recently, experiments have been performed on the compressive failure of porous glass samples where the degree of heterogeneity could be well controlled during the sample preparation Vasseur et al. (2015). These experiments have shown that increasing disorder gives rise to a more intensive bursting activity with a higher number of cracking events whose size spans a broader range. As a consequence, the precision of failure forecast methods was found to improve with increasing disorder Vasseur et al. (2015).
Motivated by these recent findings, here our goal is to investigate the statistics of crackling noise in the limiting case of extremely high disorder. The fiber bundle model (FBM) provides an adequate framework de Arcangelis et al. (1989); Andersen et al. (1997); Hansen et al. (2015); Kloster et al. (1997); Kun et al. (2006); Hidalgo et al. (2008, 2009) to study the statistics of breaking avalanches allowing for a simple way to control the degree of disorder Roy et al. (2017); Roy and Ray (2015); Hidalgo et al. (2008); Kovács et al. (2013); Karpas and Kun (2011); Hao et al. (2017). In FBMs the sample is discretized in terms of parallel fibers where controlling the mechanical response, strength and interaction of fibers various types of materials’ behaviours can be captured. Disorder can be represented by the random strength of fibers while their Young modulus is kept constant. In our study, high disorder is realized by a power law distribution of fibers’ strength over a finite range where the amount of disorder can be controlled by the exponent and by the upper cutoff of the strength values.
Assuming equal load sharing after fiber breakings, we demonstrate that the fat tailed microscale disorder has a substantial effect on the statistics of breaking bursts of fibers. In particular, we show that the functional form of the burst size distribution depends on the size of the bundle: when the upper cutoff of fibers’ strength is infinite the burst size distribution is a power law with a universal exponent. However, in the case of finite upper cutoff strength, for small system sizes the size distribution is identical with the one of the infinite cutoff strength. Deviations start at a characteristic system size beyond which a crossover occurs to another functional form. We give an explanation of the system size dependent avalanche statistics in terms of the extreme order statistics of breaking thresholds.
II Fiber bundle model with fat-tailed disorder
We consider a bundle of parallel fibers, which are assumed to have a perfectly brittle behavior with a Young’s modulus and breaking threshold . The Young’s modulus is assumed to be constant so that materials’ disorder is captured by the randomness of the breaking threshold . The strength of individual fibers , is sampled from a probability density . The amount of disorder in the system can be controlled by varying the range of strength values and by the functional form of . FBMs with moderate amount of disorder have been widely studied in the literature considering uniform, Weibull, and Gaussian distributions making the avalanche statistics of this universality class well understood Hidalgo et al. (2009); Hansen et al. (2015).
To realize the limiting case of extremely high disorder, a fat tailed disorder distribution is considered, i.e. we implement a power law distribution of breaking thresholds over the range with the probability density
| (4) |
In our calculations, the lower bound of thresholds is fixed to , while the amount of disorder is controlled by varying the power law exponent and the upper bound of thresholds. The value of covers the range , while the disorder exponent is varied in the interval . For this choice of , in the limiting case of an infinite upper bound the thresholds do not have a finite average, hence, varying the two parameters and the amount of disorder can be tunned in the bundle between the extrems of zero and infinity. Of course, at finite cutoffs , the average fiber strength is always finite, however, the specific values of and have a very strong effect on the behavior of the system both on the macro- and micro-scales. The cumulative distribution can be obtained from the normalized density as
| (5) |

After fiber failure, we assume that the excess load of broken fibers is equally redistributed over the remaining intact ones. Hence, the constitutive equation of the bundle can be obtained from the general form by substituting the distribution function from Eq. (5)
| (6) |
For brevity, we introduce the notation , , with , for the lower and upper bounds of strength in terms of strain. The stress-strain relation of the bundle is illustrated in Fig. 1. Perfectly linear behaviour is obtained up to the lower bound , since no fibers break in this regime. After fiber breaking sets on, the constitutive curve becomes gradually non-linear and develops a maximum whose position and value define the tensile strength of the bundle. Both the critical strain and stress depend on the degree of disorder characterized by and
| (7) |
and
| (8) |
Recently, we have shown that if the threshold distribution Eq. (4) of the model is sufficiently narrow, already the first fiber breaking can trigger the immediate failure of the entire bundle Kádár et al. (2017). It can be observed in Fig. 1 that this occurs when the position of the maximum of the constitutive curve coincides with the lower bound of the fibers’ strength. It follows that for all exponent values there exists a critical upper bound so that in the range the bundle exhibits a perfectly brittle behaviour. Perfect brittleness means that under stress or strain controlled loading the breaking of the weakest fiber gives rise to an immediate abrupt failure of the bundle, or in a softening behaviour, respectively. The critical upper bound can be obtained from Eqs. (7,8) as
| (9) |
The results imply that at a given value of the exponent in the parameter regime a quasi-brittle response is obtained where macroscopic failure is preceded by breaking avalanches.
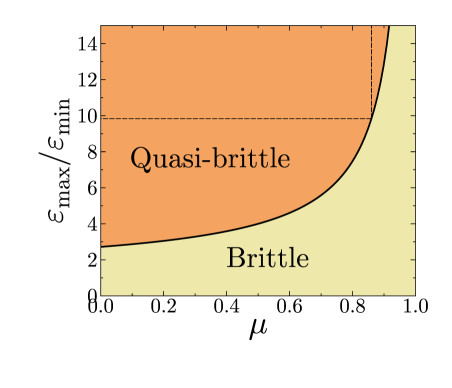
The phase boundary separating the brittle and quasi-brittle behaviours of the system is given by the relation Eq. (9). The phase diagram of the system is illustrated in Fig. 2 on the plane. Note that as the exponent approaches 1 from below the value of diverges so that the regime is always brittle. When presenting results at a fixed exponent , it is instructive to characterize the upper cutoff of fibers strength relative to the corresponding point of the phase boundary . Hence, we introduce the parameter , which can take any value in the range (equality holds on the phase boundary between the brittle and quasi-brittle phases).
Recently, we have demonstrated that the fat tailed microscale disorder gives rise to an anomalous size scaling of the macroscopic strength of the bundle Kádár et al. (2017). For finite upper cutoffs of fibers’ strength , the average strength of the bundle was found to increase with the number of fibers as
| (10) |
The usual decreasing behaviour of strength Smith (1980); Smith et al. (1983) gets restored beyond a characteristic system size which depends on the disorder parameters as
| (11) |
We could explain this interesting effect based on the extrem order statistics of the strength of single fibers, i.e. we pointed out that the bundle strength increases until the strongest fiber dominates the ultimate failure of the system Kádár et al. (2017). For sufficiently small systems, at high cutoffs , the strongest fiber can be so strong that it can keep the entire load on the system. Beyond the characteristic system size , this is no longer possible so that the average strength decreases with . In the following we show that the fat tailed disorder of fibers’ strength gives rise also to a complex behaviour of the statistics of breaking bursts when the parameters and are varied.
III Statistics of breaking bursts
Inside the quasi-brittle phase, we analyse the fracture process of the bundle under quasi-static loading, which is realized by slowly increasing the external load to provoke the breaking of a single fiber at a time. For simplicity, we assume that the load of the broken fiber is equally redistributed over the intact ones which may trigger additional breakings, followed again by load redistribution.
As a consequence of the repeated breaking and load redistribution steps, an avalanche emerges which stops when all the remaining intact fibers are sufficiently strong to keep the elevated load. Global failure occurs in the form of a catastrophic avalanche which destroys the entire system. The size of the avalanche is defined as the number of fibers breaking in the correlated trail.
III.1 Acceleration towards failure
Inside the brittle phase (see Fig. 2) already the first avalanche triggers the immediate catastrophic failure of the system. However, in the quasi-brittle parameter regime the system gradually approaches failure through a sequence of bursts whose size spans a broad range.
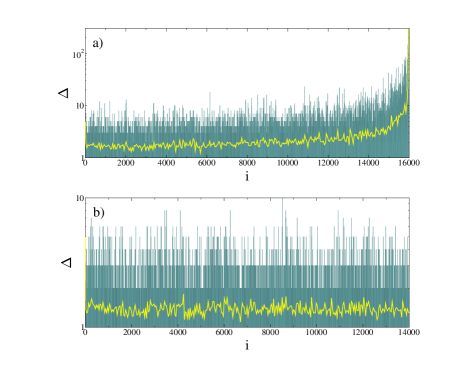
Representative examples of the series of bursts are shown in Fig. 3 for two different values of the upper cutoff , at the same exponent . For the infinite cutoff in Fig. 3 the burst size fluctuates, however, its moving average remains practically constant. It means that in spite of the increasing external load the system does not show any acceleration towards failure. In fact, in this case the constitutive curve of the bundle (see Fig. 1) does not have a maximum, it monotonically increases until the last fiber breaks the bundle. Contrary, for a finite upper cutoff in Fig. 3 the system approaches global failure through an increasing average size of bursts. At the critical point of failure a catastrophic avalanche emerges, while the catastrophic event is absent when the cutoff strength is infinite.
To understand the behaviour of the burst sequence, it is instructive to calculate the average number of fiber breakings triggered immediately by the failure of a single fiber at the strain Hidalgo et al. (2009); Kloster et al. (1997). The load dropped by the broken fiber is equally shared by the intact ones of number , giving rise to the stress increment . Multiplying with the probability density of failure thresholds and with the total number of fibers , the average number of triggered breakings can be cast into the form
| (12) |
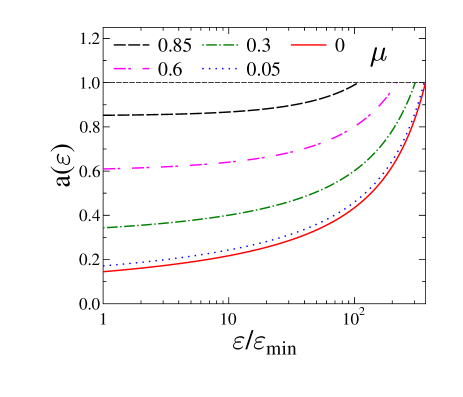
The right hand side of the equation was obtained by substituting the PDF Eq. (4) and the CDF Eq. (5) of failure thresholds of our model. The expression has to be evaluated over the range which is illustrated by Fig. 4 for several values of the exponent at a fixed upper cutoff . It can be seen that as the system approaches the critical point of global failure Eq. (7), the value of increases to 1 indicating the acceleration of the failure process and the onset of the catastrophic avalanche at the critical point.
It follows from Eq. (12) that for an infinite upper cutoff , the average number of triggered breakings takes a constant value , which implies stable cracking and a constant average burst size as it could be inferred from Fig. 3. When the cutoff strength is finite, for sufficiently small strains the value of still can be considered constant and the acceleration of the bursting process is constrained to the vicinity of the critical point . Eq. (12) implies that the effect is more pronounced when which requires to be close to 1 and a large value of the cutoff strength according to Eq. (7). Figure 4 shows this behaviour for where remains close to for a broad range of , while for smaller exponents a considerable acceleration is observed from the beginning of the failure process. In the limit the number of triggered breakings takes the form
| (13) |
while the critical point converges to (see also Fig. 4).
Note, however, that in the derivation of implicitly an infinite system size is assumed. Later on we show that to obtain acceleration towards failure and a catastrophic avalanche at finite cutoff strengths, the size of the system has to exceed a characteristic value, which is a consequence of the fat tailed disorder.
III.2 Size distribution of bursts
The statistics of breaking bursts can be characterized by the distribution of their size . The complete size distribution can be obtained analytically by substituting into the generic form Hemmer and Hansen (1992); Kloster et al. (1997); Hidalgo et al. (2009)
| (14) | |||
where for the upper limit of integration we have to insert the strength of the bundle. Utilizing the approximation , in
the limiting case of an infinite upper cutoff with the burst size distribution can be cast into a simple analytic form
| (15) |
A power law of exponent is obtained followed by an exponential cutoff. Here, denotes the characteristic burst size, which controls the cutoff of the distribution
| (16) |
This result means that at an infinite upper cutoff of fiber strength the size distribution of bursts always follows a simple power law of a universal exponent , where the value of the disorder exponent only controls the cutoff burst size . Using the Taylor expansion of logarithm around 1, it can easily be shown that as the cutoff burst size has a power law divergence
| (17) |
with a universal exponent . Burst size distributions obtained by computer simulations of a bundle of size fibres are presented in the inset of Fig. 5 for several values using an infinite cutoff strength. An excellent agreement is obtained with the analytical predictions. The main panel of Fig. 5 demonstrates that rescaling the distributions with the curves of different can be collapsed on the top of each other which confirms the validity of the scaling law Eq. (17). In Ref. Danku and Kun (2016) we also showed that approaching at , a continuous phase transition emerges from the quasi-brittle to the brittle phase, and we determined the critical exponents of the transition. Note that the modified gamma form of Eq. (15) of the burst size distribution has also been proposed for earthquake magnitude distributions to maintain a finite strain release rate in natural earthquake populations Main and Burton (1984); Kagan (1991).
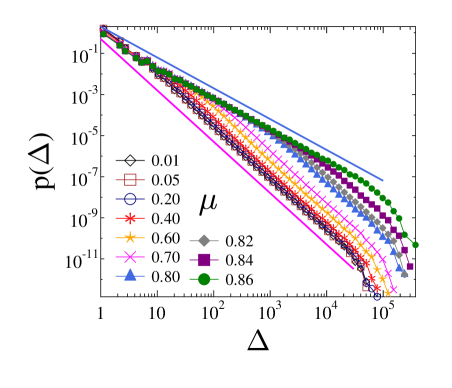
To characterize the statistics of breaking bursts at finite cutoff strength , we determined the burst size distribution for several parameter sets along two straight lines inside the quasi-brittle phase of the bundle (see Fig. 2). Figure 6 presents varying the disorder exponent at a constant finite upper cutoff . It can be seen that approaching the phase boundary the burst size distribution tends to a power law functional form followed by an exponential cutoff consistent with the generic expression Eq. (15).

The value of the power law exponent is the same as for an infinite cutoff. As decreases from its critical value, the burst size distribution exhibits a crossover between two power law regimes, i.e. the power law of exponent is followed by a steeper one of exponent in the regime of large bursts. For decreasing the crossover burst size separating the two power law regimes, shifts to lower values. In the limit almost the complete size distribution can be described by a single power law of exponent , however, the crossover burst size takes a small but finite minimum value.
For moderate amount of disorder, it has been shown for fiber bundles under equal load sharing conditions that the size distribution of avalanches has a power law functional form with a universal exponent Kloster et al. (1997). The result proved to be valid for those threshold distributions extending down to zero strength and having a sufficiently fast decreasing tail, where the constitutive curve has a quadratic maximum Hemmer and Hansen (1992); Kloster et al. (1997). In our system, the reason for the crossover of the burst size distribution between two power laws of exponent and is that the lower bound of fibers’ strength has a finite non-zero value. Additionally, close to the boundary of the quasi-brittle phase, bursts are generated in a narrow strain interval since the breakdown point falls close to .
It was pointed out in Refs. Pradhan et al. (2005, 2006) that in such cases the crossover burst size can be obtained as
| (18) |
where denotes the derivative of at the breakdown point. To apply this generic result to our truncated fat tailed disorder distribution, we substitute Eqs. (7,12) which yields
| (19) |
This expression is valid for exponents . It can be seen in Eq. (19) that approaching the phase boundary , the crossover size diverges , and hence, the burst size distribution has a single power law regime of exponent . The crossover to a higher exponent for large bursts is observed away from the phase boundary where takes finite values (see Fig. 6). Starting from Eq. (19), it can simply be shown that the divergence is described by a power law
| (20) |
with a universal exponent . To test the validity of this prediction Eq. (20), we determined the value of numerically as the crossing point of fitted power laws of exponents and . Figure 7 demonstrates that the crossover burst size rapidly increases as is approached, and it has a power law dependence on the distance from the critical point , in agreement with Eq. (20). The exponent of the fitted power law is which falls close to the analytical prediction.
IV Size dependent avalanche statistics
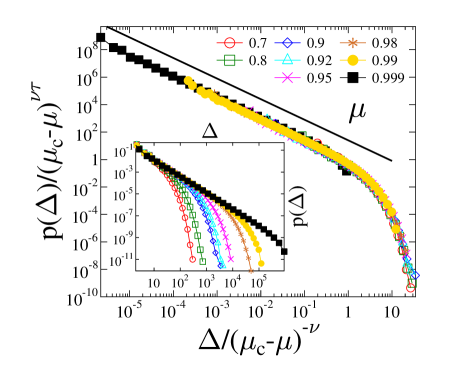
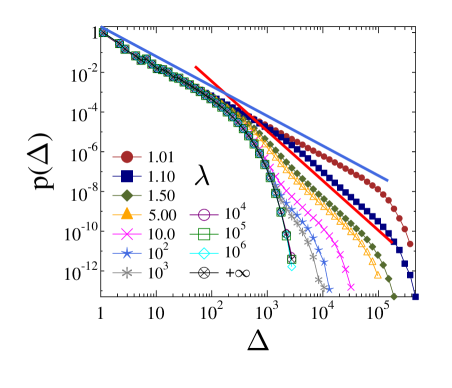
When the cutoff strength is varied while keeping the disorder exponent fixed, the burst size distribution exhibits an even more complicated behaviour. For a fixed , we express the cutoff strength relative to the phase boundary using the parameter , which takes values in the range . Figure 8 presents for several values of at the disorder exponent , i.e. along the vertical dashed line inside the quasi-brittle phase of Fig. 2. It can be observed that starting from a single power law of exponent at the phase boundary, shows again a crossover between two power law regimes, where the crossover burst size shifts to lower values as increases. Starting from Eq. (19) it is easy to show that exhibits again a power law divergence
| (21) |
when approaching the phase boundary . The value of the exponent is the same as in Eq. (20). However, a significant difference, compared to the case of a constant cutoff, is that far from the phase boundary, after some transients, the steeper power law regime of exponent gradually disappears. A single power law remains with exponent , as at the phase boundary Eq. (15), but with a significantly lower cutoff burst size .
It is important to note in Fig. 8 that at sufficiently large cutoffs , the burst size distributions coincide with the one corresponding to the infinite cutoff , in spite of the fact that the system has a finite critical point . The reason is that, at the exponent considered, the beginning of the series of bursts is close to stationary as it has been illustrated in Fig. 3. Since the average number of triggered breakings is nearly constant over a broad range of strain , as increases, the critical point is preceded by a shorter and shorter accelerating regime which has a diminishing contribution to the entire distribution .
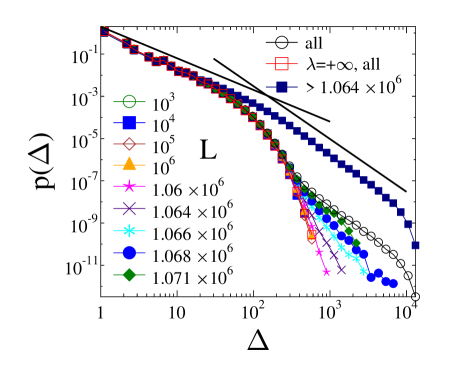
To test this idea we analyzed in detail the statistics of burst sizes in a bundle of size at the disorder parameters and where both power law regimes are present. Figure 9 shows the burst size distribution evaluated in event windows containing the first bursts, i.e. is the size distribution of bursts , , averaged over several realizations of the disorder at a given value of . For comparison, the size distribution of the entire failure process is also presented together with the one corresponding to the case of an infinite cutoff obtained at the same system size and exponent. It can be seen that up to the first bursts, the distributions perfectly agree with the case of an infinite cutoff . Deviations from start around above which gradually a steeper power law regime develops. The result confirms that in spite of the existence of a well defined critical point , for a broad event range the statistics of burst sizes is consistent with the stationary process of the infinite strength cutoff, and acceleration towards failure is restricted to the close vicinity of . The argument is further supported by the size distribution of the last bursts with event index greater than , which are generated in the vicinity of global failure. In this regime the functional form of is consistent with what has been obtained for varying in Fig. 6, i.e. a crossover emerges between two power laws of exponents and , as expected in the vicinity of the critical point.
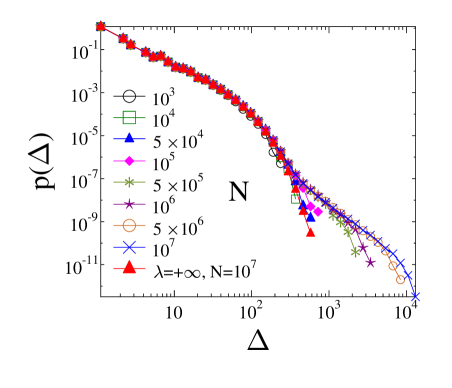
In Ref. Kádár et al. (2017) we have shown that for fat tailed distributions of fiber strength, the number of fibers has a substantial effect on the ultimate failure strength of the bundle: for small system sizes the strongest fiber controls the macroscopic failure, consequently the average bundle strength increases with the system size described by Eq. (10). The number of fibers has to exceed a characteristic value to observe the usual decreasing trend towards the strength of the infinite system given by Eqs. (7,8). Since at large the system size controls the behaviour of the system at the critical point, it follows that must play a decisive role also for the statistics of breaking avalanches. This is illustrated in Fig. 10 which presents burst size distributions of bundles of different sizes at fixed values of the disorder parameters and . It can be observed that for small values, the burst size distributions coincide with the corresponding curve of a large system obtained at the infinite cutoff . Above the system size a second power law regime gradually develops as it has been observed in Fig. 9 for a single system size with varying event window .
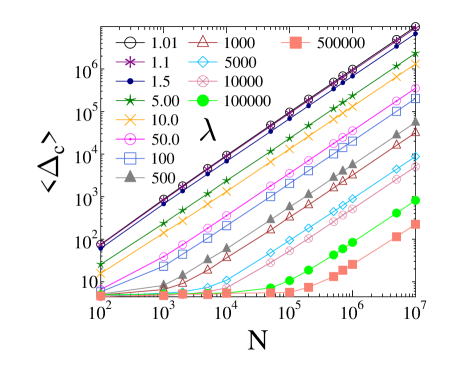
The reason of this astonishing dependence of the statistics of avalanches on the size of the system is that for small system sizes, even for finite cutoff strength of fibers, global failure occurs when the strongest fiber breaks. Consequently, the entire sequence of bursts is close to stationary and their statistics is practically the same as for the infinite cutoff. The existence of a finite critical point is only realized when the system size exceeds a characteristic value . For bundles with global failure is preceded by an acceleration of the failure process with increasing burst sizes. In this regime macroscopic failure occurs in the form of a catastrophic avalanche, however, the catastrophic event is completely absent for . In order to quantify this crossover of the avalanche statistics with respect to the size of the system , we determined the average size of the catastrophic avalanche as a function of the size of the bundle varying the upper cutoff of fibers’ strength in a broad range. The size of the catastrophic avalanche can be estimated as
| (22) |
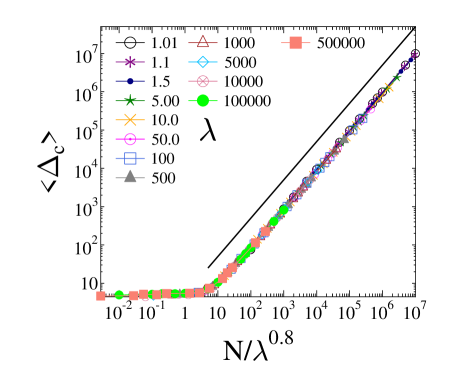
so that if a well defined critical bundle strength exists, a linear dependence is obtained on the system size . Figure 11 shows that for low values the simulation results are consistent with the above prediction. However, far from the phase boundary , a more complex behaviour is obtained: for small system sizes does not depend on , it takes a small constant value . The regular linear increase with is restored above a characteristic system size which increases with . Figure 12 demonstrates that rescaling with the th power of , the curves of obtained at different values can be collapsed on the top of each other. The high quality data collapse implies that the characteristic system size , separating the two types of avalanche statistics, has a power law dependence on as
| (23) |
This characteristic value is of course the same as the one which controls the size scaling of the ultimate strength of the bundle Eq. (11) Kádár et al. (2017). It also follows that the event window analysis presented in Fig. 9, can only be performed for system sizes , and the crossover event index below which the burst size distribution is close to the one of the infinite cutoff, has the same dependence Eq. (23) on the disorder parameter.
V Discussion
The degree of materials disorder has a substantial effect on the fracture of heterogeneous materials both on the micro- and macro-scales. When subject to a slowly increasing external load, fracture proceeds in bursts which can be considered as precursors of global failure. Failure forecast methods of the imminent catastrophic failure strongly rely on the bursting dynamics Voight (1989); Tárraga et al. (2008); Vasseur et al. (2015). It has been demonstrated experimentally that increasing amount of disorder gives rise to a more intensive precursory activity which then improves the quality of forecasts Vasseur et al. (2015); Jiang et al. (2017).
In this paper we investigated the effect of the amount of disorder on the microscopic dynamics of the fracture process of heterogeneous materials in the framework of a fiber bundle model focusing on the limit of very high disorder. We considered a power law distribution of fibers’ strength where the degree of disorder could be controlled by tuning the power law exponent and the upper cutoff of breaking thresholds. Assuming equal load sharing after local breakings, we showed that on the macro-scale the mechanical response of the bundle is either perfectly brittle where the bundle abruptly fails right at the breaking of the first fibre, or it is quasi-brittle where macroscopic failure is approached through a sequence of breaking bursts.The evolution of the crackling event series and the statistics of burst sizes have a high importance for the forecasting of the imminent failure of the bundle.
We showed that for an infinite upper cutoff of fibers’ strength, the sequence of bursts is stationary in the sense that the average burst size is constant. Hence, the system does not exhibit any sign of acceleration towards failure. Consequently, a power law burst size distribution is obtained, where the disorder exponent only controls the cutoff burst size. For finite upper cutoffs we showed that there exists a well-defined critical point of global failure, however, it can only be realized in sufficiently large systems. In small systems the global strength of the bundle is controlled by the strongest fiber. This peculiar behaviour gives rise to an astonishing dependence of the statistics of burst sizes on the size of the system: for small systems the burst sequence proved to be close to stationary, and hence, the burst size distribution coincides with the one corresponding to the infinite upper cutoff of fibers’ strength. For large systems the initially stationary sequence is followed by an accelerating regime in the close vicinity of the critical point, which gives rise to a crossover between two power laws of the burst size distribution. Analysing the dependence of the average size of the catastrophic burst on the size of the bundle, we pointed out that the transition between the two types of burst size distributions occurs at a characteristic system size which depends on the disorder parameters of the bundle. The results can have relevance for the design of laboratory experiments: when the micro-scale materials disorder has a rapidly (exponentially) decaying distribution, the sample size mainly affects the cutoff of the size distribution of bursts but not its functional form. However, for fat tailed disorder the sample size has a strong effect on the functional form of the burst size distribution so that the size of specimens in laboratory tests has to be sufficiently large to reproduce the acceleration of the burst sequence towards failure obtained in field measurements.
We also demonstrated that for a moderate amount of disorder, i.e. varying the disorder parameters in the vicinity of the phase boundary between the brittle and quasi-brittle phases, a crossover occurs between two power laws of exponents and . The reason is that bursts are generated in a narrow strain interval close to the critical point of macroscopic failure. In this case the crossover burst size was found to have a power law divergence as the phase boundary is approached.
Our results set important limitations on the forecastability of the imminent failure Voight (1988); Bell et al. (2013); Vasseur et al. (2015) of the system when the microscale disorder is fat tailed. We have demonstrated that even if a considerable avalanche activity accompanies the failure process, the collapse may not be predictable either because it is controlled by the extreme order statistics of fibers’ strength, or the accelerating regime preceding failure is too short. In failure forecast methods accelerating precursors have to be identified above a null hypothesis of stationary event rate, then one needs to wait for a sufficient amount of data to define a singularity with accuracy and precision at a finite time before the time of ultimate failure Bell et al. (2013). The effect of high disorder on the statistics of breaking bursts, revealed by our study, may be a real limitation for practical applications of forecasting methods based on acoustic or seismic precursors of failure Geller et al. (1997); Bell et al. (2013).
In the present study we focused mainly on the integrated statistics of burst sizes considering all events up to failure. The quantitative characterization of the evolution of the event series towards failure requires further careful analysis which is in progress.
Acknowledgements.
The work is supported by the EFOP-3.6.1-16-2016-00022 project. The project is co-financed by the European Union and the European Social Fund. This research was supported by the National Research, Development and Innovation Fund of Hungary, financed under the K-16 funding scheme Project no. K 119967. The research was financed by the Higher Education Institutional Excellence Program of the Ministry of Human Capacities in Hungary, within the framework of the Energetics thematic program of the University of Debrecen.References
- Petri et al. (1994) A. Petri, G. Paparo, A. Vespignani, A. Alippi, and M. Costantini, Phys. Rev. Lett. 73, 3423 (1994).
- Maes et al. (1998) C. Maes, A. v. Moffaert, H. Frederix, and H. Strauven, Phys. Rev. B 57, 4987 (1998).
- Deschanel et al. (2009) S. Deschanel, L. Vanel, N. Godin, and S. Ciliberto, J. Stat. Mech.: Theor. Exp. 2009, P01018 (2009).
- Castillo-Villa et al. (2013) P. O. Castillo-Villa, J. Baró, A. Planes, E. K. H. Salje, P. Sellappan, W. M. Kriven, and E. Vives, J. Phys.: Cond. Matt. 25, 292202 (2013).
- Xu et al. (2019a) Y. Xu, A. G. Borrego, A. Planes, X. Ding, and E. Vives, Phys. Rev. E 99, 033001 (2019a).
- Baró et al. (2016) J. Baró, P. Shyu, S. Pang, I. M. Jasiuk, E. Vives, E. K. H. Salje, and A. Planes, Phys. Rev. E 93, 053001 (2016).
- Diodati et al. (1991) P. Diodati, F. Marchesoni, and S. Piazza, Phys. Rev. Lett. 67, 2239 (1991).
- Lockner (1993) D. Lockner, International Journal of Rock Mechanics and Mining Sciences & Geomechanics Abstracts 30, 883 (1993).
- Meinders and Vliet (2008) M. B. J. Meinders and T. v. Vliet, Phys. Rev. E 77, 036116 (2008).
- Niccolini et al. (2011) G. Niccolini, A. Carpinteri, G. Lacidogna, and A. Manuello, Phys. Rev. Lett. 106, 108503 (2011).
- Vasseur et al. (2015) J. Vasseur, F. B. Wadsworth, Y. Lavallée, A. F. Bell, I. G. Main, and D. B. Dingwell, Sci. Rep. 5, 13259 (2015).
- Jiang et al. (2017) X. Jiang, H. Liu, I. G. Main, and E. K. H. Salje, Phys. Rev. E 96, 023004 (2017).
- Koivisto et al. (2016) J. Koivisto, M. Ovaska, A. Miksic, L. Laurson, and M. J. Alava, Phys. Rev. E 94, 023002 (2016).
- Pradhan et al. (2005) S. Pradhan, A. Hansen, and P. C. Hemmer, Phys. Rev. Lett. 95, 125501 (2005).
- Davidsen et al. (2007) J. Davidsen, S. Stanchits, and G. Dresen, Phys. Rev. Lett. 98, 125502 (2007).
- Sornette (2002) D. Sornette, Proc. Natl. Acad. Sci. USA 99, 2522 (2002).
- Voight (1988) B. Voight, Nature 332, 125 (1988).
- Bell et al. (2013) A. F. Bell, M. Naylor, and I. G. Main, Geophys. J. Int. 194, 1541 (2013).
- Rosti et al. (2009) J. Rosti, X. Illa, J. Koivisto, and M. J. Alava, Journal of Physics D: Applied Physics 42, 214013 (2009).
- Xu et al. (2019b) Y. Xu, A. G. Borrego, A. Planes, X. Ding, and E. Vives, Phys. Rev. E 99, 033001 (2019b).
- Zapperi et al. (1997) S. Zapperi, P. Ray, H. E. Stanley, and A. Vespignani, Phys. Rev. Lett. 78, 1408 (1997).
- Picallo et al. (2010) C. B. Picallo, J. M. López, S. Zapperi, and M. J. Alava, Phys. Rev. Lett. 105, 155502 (2010).
- Guarino et al. (1998) A. Guarino, A. Garcimartin, and S. Ciliberto, Eur. Phys. J. B 6, 13 (1998).
- Ramos et al. (2013) O. Ramos, P.-P. Cortet, S. Ciliberto, and L. Vanel, Phys. Rev. Lett. 110, 165506 (2013).
- Santucci et al. (2004) S. Santucci, L. Vanel, and S. Ciliberto, Phys. Rev. Lett. 93, 095505 (2004).
- de Arcangelis et al. (1989) L. de Arcangelis, A. Hansen, H. J. Herrmann, and S. Roux, Phys. Rev. B 40, 877 (1989).
- Andersen et al. (1997) J. V. Andersen, D. Sornette, and K. Leung, Phys. Rev. Lett. 78, 2140–2143 (1997).
- Hansen et al. (2015) A. Hansen, P. Hemmer, and S. Pradhan, The Fiber Bundle Model: Modeling Failure in Materials, Statistical Physics of Fracture and Breakdown (Wiley, 2015).
- Kloster et al. (1997) M. Kloster, A. Hansen, and P. C. Hemmer, Phys. Rev. E 56, 2615–2625 (1997).
- Kun et al. (2006) F. Kun, F. Raischel, R. C. Hidalgo, and H. J. Herrmann, in Modelling Critical and Catastrophic Phenomena in Geoscience: A Statistical Physics Approach, Lecture Notes in Physics, edited by P. Bhattacharyya and B. K. Chakrabarti (Springer-Verlag Berlin Heidelberg New York, 2006) pp. 57–92.
- Hidalgo et al. (2008) R. C. Hidalgo, K. Kovács, I. Pagonabarraga, and F. Kun, Europhys. Lett. 81, 54005 (2008).
- Hidalgo et al. (2009) R. C. Hidalgo, F. Kun, K. Kovács, and I. Pagonabarraga, Phys. Rev. E 80, 051108 (2009).
- Roy et al. (2017) S. Roy, S. Biswas, and P. Ray, Phys. Rev. E 96, 063003 (2017).
- Roy and Ray (2015) S. Roy and P. Ray, Europhys. Lett. 112, 26004 (2015).
- Kovács et al. (2013) K. Kovács, R. C. Hidalgo, I. Pagonabarraga, and F. Kun, Phys. Rev. E 87, 042816 (2013).
- Karpas and Kun (2011) E. Karpas and F. Kun, Europhys. Lett. 95, 16004 (2011).
- Hao et al. (2017) S. Hao, H. Yang, and X. Liang, Materials 10, 515 (2017).
- Kádár et al. (2017) V. Kádár, Z. Danku, and F. Kun, Phys. Rev. E 96, 033001 (2017).
- Smith (1980) R. L. Smith, Proc. R. Soc. Lond. A 372, 539 (1980).
- Smith et al. (1983) R. L. Smith, S. L. Phoenix, M. R. Greenfield, R. B. Henstenburg, and R. E. Pitt, Proc. R. Soc. Lond. A 388, 353 (1983).
- Hemmer and Hansen (1992) P. C. Hemmer and A. Hansen, J. Appl. Mech. 59, 909–914 (1992).
- Danku and Kun (2016) Z. Danku and F. Kun, J. Stat. Mech.: Theor. Exp. 2016, 073211 (2016).
- Main and Burton (1984) I. Main and P. Burton, Bull. Seismol. Soc. Am. 74, 1409 (1984).
- Kagan (1991) Y. Kagan, Geophys. J. Int. 106, 123 (1991).
- Pradhan et al. (2006) S. Pradhan, A. Hansen, and P. C. Hemmer, Phys. Rev. E 74, 016122 (2006).
- Voight (1989) B. Voight, Science 243, 200 (1989).
- Tárraga et al. (2008) M. Tárraga, R. Carniel, R. Ortiz, and A. García, in Caldera Volcanism: Analysis, Modelling and Response, Developments in Volcanology, Vol. 10, edited by J. Gottsmann and J. Marti (Elsevier, 2008) pp. 447 – 469.
- Geller et al. (1997) R. J. Geller, D. D. Jackson, Y. Y. Kagan, and F. Mulargia, Science 275, 1616 (1997).