Unsupervised Deep Metric Learning via Auxiliary Rotation Loss
Abstract
Deep metric learning is an important area due to its applicability to many domains such as image retrieval and person re-identification. The main drawback of such models is the necessity for labeled data. In this work, we propose to generate pseudo-labels for deep metric learning directly from clustering assignment and we introduce unsupervised deep metric learning (UDML) regularized by a self-supervision (SS) task. In particular, we propose to regularize the training process by predicting image rotations. Our method (UDML-SS) jointly learns discriminative embeddings, unsupervised clustering assignments of the embeddings, as well as a self-supervised pretext task. UDML-SS iteratively cluster embeddings using traditional clustering algorithm (e.g., k-means), and sampling training pairs based on the cluster assignment for metric learning, while optimizing self-supervised pretext task in a multi-task fashion. The role of self-supervision is to stabilize the training process and encourages the model to learn meaningful feature representations that are not distorted due to unreliable clustering assignments. The proposed method performs well on standard benchmarks for metric learning, where it outperforms current state-of-the-art approaches by a large margin and it also shows competitive performance with various metric learning loss functions.

1 Introduction
Metric learning methods aim to learn effective embedding space where similar instances are mapped to nearby points, while for samples coming from different classes, the embedding vectors are pushed apart. These methods explore different loss functions and mining methods to measure the similarities between data points accurately and robustly. Unlike traditional classification tasks which focus on category-specific concepts, metric learning aims to learn the general concept of distance metrics [34]. With the recent success of deep neural networks in computer vision, deep metric learning methods have shown impressive results. Deep metric learning methods have applications in different domains, such as person re-identification [22, 54], image retrieval [48, 19, 16], near-duplicate detection [56], zero-shot learning [5, 4, 52] and visual tracking [24, 31]. However, to obtain better performance, the training process often requires large-scale labeled data. Most of the fine-grained datasets are especially expensive to annotate since annotators are required to be domain experts [14]. Thus unsupervised deep metric learning is becoming of great interest to the vision community.
A major goal of unsupervised representation learning is to learn similarities between images or weak category information without labeled instances [51]. Recent work [3, 2, 6] treats the classification problem as a pretext task and explores the idea of updating the weights of models by predicting the cluster assignments. Iscen et al. [26] introduce a fully unsupervised way to mine hard training samples. Ye et al. [51] propose to sample positive pairs by using data augmentation and treat different instances as negative pairs.
The idea of using cluster assignment as pseudo-labels has been studied in deep learning domain [3, 2, 6, 7] such as DeepCluster [6]. However, these studies mainly focus on classification tasks with pseudo-labels. In UDML-SS, we propose to use pseudo-labels directly to generate samples for metric learning loss. By sampling the positive and negative pairs based on the cluster assignments generated with k-means, we are able to update weights of the unsupervised metric learning model. The pseudo-labels are then re-computed given the new embedding vectors and this process iterates until the model converges.
A challenge with clustering is that it tends to contain many unreliable assignments, which causes instability during training and difficulty of converges. Motivated by the recent development of self-supervised learning, we mitigate this problem by adding an auxiliary, self-supervised loss to the metric learning loss. This leads to more stable and accurate training because the dependency of the learned representations on the quality of the clustering assignment is reduced. In particular, we apply the state-of-the-art self-supervision method based on image rotation [15].
Our contributions In this work, we present an unsupervised metric learning framework (UDML-SS). We propose a metric learning loss that is based on cluster assignments directly as well as combines the metric learning with self-supervised representation learning. It alternates between clustering the learned embedding vectors and updating the weights of the convnet by minimizing a loss function, which is a combination of metric learning loss and a self-supervised loss. For simplicity, we focus our study on k-means for the former. For the latter, the image rotation prediction task [15] is chosen as our self-supervision task. UDML-SS is conceptually simple and compatible with any metric learning loss functions, which we will show in Section 4. Our method is evaluated extensively on several benchmarks for metric learning, where it outperforms current state-of-the-art unsupervised metric learning approaches by a large margin, e.g., improving [51] by +8.5% Recall@1 on CUB200 [44], by +3.8% Recall@1 on Cars196 [29] and by +14.6% Recall@1 on Stanford Online Product (Product) [34]. Figure 1 shows a conceptual pipeline of the proposed approach.
2 Related Work
Metric Learning With the progress made in deep learning, many approaches have been proposed for supervised deep metric learning. A lot of research effort has been devoted to designing new loss functions. Classical pair-based loss functions including contrastive loss [17, 23] and triplet loss [38, 8] are widely used in most existing metric learning methods. Contrastive loss encourages samples from a positive pair to be closer, and maximizes the distance between a negative pair in the embedding space. Triplet loss defines each triplet by choosing a positive sample and a negative sample given the same anchor point. It aims to learn an embedding where the similarity of the negative sample plus a given margin is lower than that of the positive one to the anchor. Extended from triplet loss, quadruplets are also applied in recent work, such as histogram loss [43]. Other methods, such as lifted-structure [34], n-pair loss [40], angular loss [45], adapted triplet loss [53], multi-similarity [46] focus on fully utilizing pairwise relations of all points in a batch. Hard sample mining has also been widely adopted to produce more robust models. Here, instead of sampling all negative instances for an anchor point, the most challenging negative instances are mined. To this end, Schroff et al. [38] propose semi-hard mining. They sample a negative example within the batch, such that it is close to the anchor point but further away from positives. Wu et al. [49] improve it by uniformly sampling negative instances weighted by their distance. Ge et al. [13] introduce a new violate margin, which is computed dynamically over the constructed hierarchical tree. Duan et al. [11] introduce a deep adversarial metric learning framework to generate synthetic hard negatives from the observed negative samples. To fully exploit information buried in all samples, Zheng et al. [57] performs linear interpolation on embeddings to adaptively manipulate their hard levels so that the metric is always challenged with proper difficulty. All these metric learning methods are supervised with class labels.
Self-supervised Representation Learning Self-supervised representation learning has been widely used in different domains [9, 32, 27]. Self-supervised representation learning utilizes only unlabeled data to formulate a pretext learning task for which a target objective can be acquired without supervision. [9, 33] predict the relative position of image patches to learn semantically relevant content. Larsson et al. [30] use colorization as a proxy task. Giaris et al. [15] propose to rotate the image and predict the rotation angle, which is a simple but yet effective method to achieve useful representations for downstream image classification and segmentation tasks. Feng et al. [12] introduce a split representation that contains both rotation related and unrelated part. [35, 20, 1] propose to train feature extractors by maximizing an estimate of the mutual information (MI) between different views of the data. Although these methods show state of the art performance on the classification task, it is unclear whether MI maximization is a good objective for learning good representations in an unsupervised fashion [42]. Recently, Hendrycks et al. [21] show self-supervised representation learning can improve the robustness of the classification model to label corruption.
Deep Clustering Clustering is a popular unsupervised learning method. Caron et al. [6] proposes a scalable clustering approach for the unsupervised representation learning of visual features. It iterates between clustering with k-means the features generated by the deep nets and using a discriminative loss to update the parameters by predicting the cluster assignments as pseudo-labels. In [6, 7], deep clustering idea is explored for general unsupervised feature learning, where the main goal is to pre-train model without labels.
Unsupervised Metric learning Most of the metric learning methods are supervised with class labels. There have been relatively fewer efforts devoted to unsupervised metric learning. [3, 2] split the training set into different groups based on complicated clustering scheme and utilize induced classification problem as a pretext task. Iscen et al. [26] introduce an unsupervised framework for hard training example mining which exploits the manifold distance to extract hard examples. Ye et al. [51] instead aim at learning data augmentation invariant features and explore the instance-wise supervision. This method is related to another unsupervised learning method [50].
3 Proposed Method
3.1 Problem Formulation
Let denote the data space where we sample a set of unlabeled data points . Let be a mapping from the data space to a feature space, where we have . is usually represented by a convolutional neural network (CNN), e.g. the pre-trained Inception-V1 [41] on ImageNet. Mapping learns a non-linear transformation of the image into a deep feature space . The objective of metric learning is to learn a metric in the feature space so that it can measure the visual similarity correctly based on different datasets. To learn the mapping from feature space to the embedding space, another function is appended to project feature vectors to embedding vectors. The embedding vector is usually normalized to have a unit length for training stability [38]. Finally, two mappings and are jointly learned (where the feature extraction backbone is usually fine-tuned) in such a way that maps images within same categories (positive pairs) close to one another and images in different categories (negative pairs) far apart in the embedding space. The similarity between two data points in the embedding space is thus defined as
| (1) |
Supervised metric learning approaches would use labeled data points to construct a training set () of positive and negative pairs of items. And the network parameters are learned by minimizing a specific loss function:
| (2) |
Our goal is to learn an embedding space without manually defined labels.
3.2 Pseudo-labels by clustering
In DeepCluster [6], the authors utilize a signal provided by the convolutional structure of the random convnet, as a prior to the input signal. To bootstrap this signal, they need to use a large amount of training samples, e.g. ImageNet [37] which contains 1.3M images uniformly distributed into 1000 classes. The goal of their work is to pre-train the model without labels. However, in our work, we focus on the metric learning task and study the signal provided by pre-trained models, which allows us to learn an embedding space even with a few thousand samples. Using the pre-trained network is a common practice in deep metric learning [26, 51]. The pre-trained convolutional neural network on ImageNet [37] classification task can usually provide decent signal for image retrievals [34]. Oh et al. [34] shows representations provided by Inception-V1 [41] achieves reasonable performance on standard benchmarks of metric learning. The idea of this work is to exploit such pre-trained signal to bootstrap the metric learning process in an unsupervised manner. For simplicity, we use k-means to cluster the feature vectors provided by the convnet and use the subsequent cluster assignments as pseudo-labels to initialize our proposed loss functions. After the initialization step, cluster reassignment is conducted on the embedding vectors instead of feature vectors.
3.3 Multi-similarity Loss
In general, our method is compatible with any metric learning loss function. Here we choose multi-similarity loss [46] because it shows the state of the art performance on supervised metric learning. However, we also show some experimental results using other popular metric learning loss functions in Section 4.
There are two steps in the multi-similarity method [46]. The first step is to mine hard sample pairs based on the cosine similarities between the corresponding embedding vectors. The goal of sampling hard examples is to speed up the training process and extract informative pairs. Let be the given instances, with as the pseudo-labels obtained from clustering assignments. Let be the anchor. Define as a negative pair chosen as
| (3) |
Similarly, is a positive pair chosen as
| (4) |
represents the similarity between two examples. controls the margin. Denote the set of chosen positive and negative pairs as and respectively. With the chosen training pairs, we can minimize the multi-similarity loss. The multi-similarity (MS) is defined as
| (5) |
We use the same and as in the original multi-similarity framework throughout our experiments.
3.4 Predicting Image Rotations
To overcome the challenge of unreliable clustering assignment, we aim to learn useful representations, independently of the quality of the clustering assignments. To this end, we exploit recent advancements in self-supervised approaches for representation learning. For example, the network can be trained on a pretext task including colorizing grayscale images [55], image inpainting [36], image jigsaw puzzle [33], predicting image rotations [15]. We propose to add a self-supervised task to our metric learning loss. In particular, in this work, we focus on the pretext task proposed in [15] where a model is trained to predict image rotations (0, 90, 180 and 270 degrees). They have shown state of the art performance on standard evaluation benchmarks in self-supervised learning.
Given a set of n images , let for be the rotated version (0, 90, 180, 270 degrees) of and . We learn the parameters of the feature extraction backbone, , jointly with parameters of a mapping, , from features extractors to the predicted labels of rotation classification. Formally, we have
| (6) |
where is the cross-entropy loss.
3.5 Proposed Loss Function
Combining (5) and (6) gives us the following loss functions:
| (7) |
where is the training example, is pseudo-label given by clustering assignment and is the label for the pretext rotation task. is a tuning parameter that balances the contributions of the metric learning loss and the rotation prediction loss. represents the parameter of feature extraction backbone, while and are the parameters of the metric learning layers and pretext task layers respectively. In other words, we use a single feature extraction network with two heads: one for metric learning and another for the pretext task. Note that the input images for metric learning are not rotated because we believe that we should keep the self-supervised pretext task separated to avoid “contamination” from any unreliability in the cluster assignments. Empirically we also find that this choice achieves better performance. Given the loss function 7, UDML-SS iteratively learns and clusters the embedding vectors.
4 Experimental Results
4.1 Datasets
We conduct experiments on three standard datasets for metric learning: CUB-200-2011 [44], Cars-196 [29] and Stanford Online Products [34]. We follow the same training/testing data split as [34].
-
•
The CUB-200-2011 (CUB) dataset has 11,788 images in total. We use the first 100 categories (5,864 images) for training and the remaining 100 categories for testing.
-
•
The Cars-196 (Cars) dataset contains 16,185 images of 196 classes of cars. The first 98 model categories are used for training, and the rest for testing.
-
•
The Stanford Online Products dataset consists of 120,053 images of 22,634 online products from eBay.com. We use the first 11,318 products (59,551 images) for training and the remaining 11,316 products (60,502 images) for testing.
4.2 Experimental Settings
Our method was implemented in PyTorch. We utilize Inception-V1 [41] pre-trained on ImageNet [37] as the backbone network, and fine-tuned it for our task. We also show experimental results on some other network architectures in Section 4.8. We add two separate fully connected layers (512-dim) on the top of the network following the global pooling layer. The first one is for the embedding layer and the second one is for rotation classification. All the input images were cropped to 227 227. During the training phase, we use random cropping with random horizontal mirroring for data augmentation. In the testing phase, a single center-cropped image is the input for fine-grained retrieval as in [46]. We use Adam [28] optimizer for all experiments
For each mini-batch, we follow the sampling strategy used in [46] and we randomly choose a certain number of classes, and then sample M = 5 examples from each class for all datasets in our experiments. To implement the rotation loss, we rotate 16 images in the batch in all four considered directions (0, 90, 180, and 270 degrees) and get a batch size of 64 (16 unique images) [15]. For CUB and Cars datasets, we use 100 clusters (i.e. ) while we show evaluations of Stanford Online Products with , as it contains a much larger number of samples. As shown in [51], the pre-trained Inception-V1 performs better on the CUB and Products dataset than on the Cars dataset. Based on this fact, we set for Cars so that the contribution of self-supervision is increased to reduce the dependency of learned representations on the quality of the cluster assignments, while for CUB and Products, we set . For more details on the performance of different , see the appendix. For all other hyperparameters, we use the values provided in [46]. The similarity is measured with cosine similarity.
We evaluate our method on image retrieval task by using the standard performance metric: Recall@K. Given a query image from the testing set, Recall@K is the probability that any correct matching occurs in the top-k retrieved images. We also provide Normalized Mutual Information (NMI) to measure the clustering performance of the testing dataset. NMI is defined by the ratio of the mutual information of clusters and ground truth labels to the arithmetic mean of their entropy [39].
| Method | R@1 | R@2 | R@4 | R@8 | NMI |
| Supervised | |||||
| Lifted [34] | 46.9 | 59.8 | 71.2 | 81.5 | 56.4 |
| Angular [45] | 53.6 | 65.0 | 75.3 | 83.7 | 61.0 |
| Triplet [47] | 35.9 | 47.7 | 59.1 | 70.0 | 49.8 |
| Triplet hard [38] | 40.6 | 52.3 | 64.2 | 75.0 | 53.4 |
| Multi-Sim [46] | 65.7 | 77.0 | 86.3 | 91.2 | - |
| Unsupervised | |||||
| Exemplar [10] | 38.2 | 50.3 | 62.8 | 75.0 | 45.0 |
| NCE [50] | 39.2 | 51.4 | 63.7 | 75.8 | 45.1 |
| DeepCluster [6] | 42.9 | 54.1 | 65.6 | 76.2 | 53.0 |
| Rot-Only [15] | 42.5 | 55.8 | 68.6 | 79.4 | 49.1 |
| MOM [26] | 45.3 | 57.8 | 68.6 | 78.4 | 55.0 |
| Instance [51] | 46.2 | 59.0 | 70.1 | 80.2 | 55.4 |
| UDML-SS | 54.7 | 66.9 | 77.4 | 86.1 | 61.4 |
4.3 Comparison with State-of-the-Art
Tables 1, 2, and 3 show quantitative results on the CUB-200-2011, Cars196, and Stanford Online Products datasets, respectively. MOM [26] and Instance [51] are two most recent state of art methods designed for unsupervised metric learning and they also utilize Inception-V1 [41] as their backbone. The performance of other state-of-the-art unsupervised methods (Exemplar [10], NCE [50], Deep Cluster [6] and Prediction Image Rotation [15]) on these three datasets [51] are also listed in these tables. For a fair comparison, we list evaluations using the same number of clusters () for UDML-SS and DeepCluster [6] methods. We also provide the performance of several popular supervised metric learning methods (Triplet [47], Triplet Hard [38], Lifted Structure [34], Angular [45], Multi-Similarity [46]) to show the relative performance of unsupervised metric learning. Note that only the multi-similarity work uses Inception-V2 [25].
As shown in Table 1, UDML-SS outperforms all competing methods with a large margin on CUB-200-2011 dataset. For example, we have achieved an 11.8% and 8.5% increase of Recall@1 compared to DeepCluster [6] and the instance method [51], respectively. Some qualitative results on CUB dataset are shown in the appendix. In Table 2 and 3, we show the results on Cars196 and Product datasets. We observe UDML-SS achieves very competitive performance and outperforms all competing methods with a clear margin on these two datasets. In particular, UDML-SS achieves a 14.6% boost of Recall@1 for Product dataset () and a 3.8% boost of Recall@1 on Cars196 dataset. When for Product dataset, which is much smaller than the number of classes (11318), our method still outperforms the competing method [51].
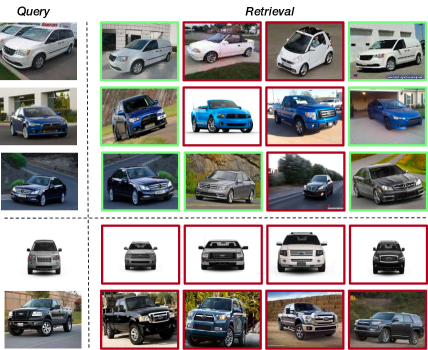
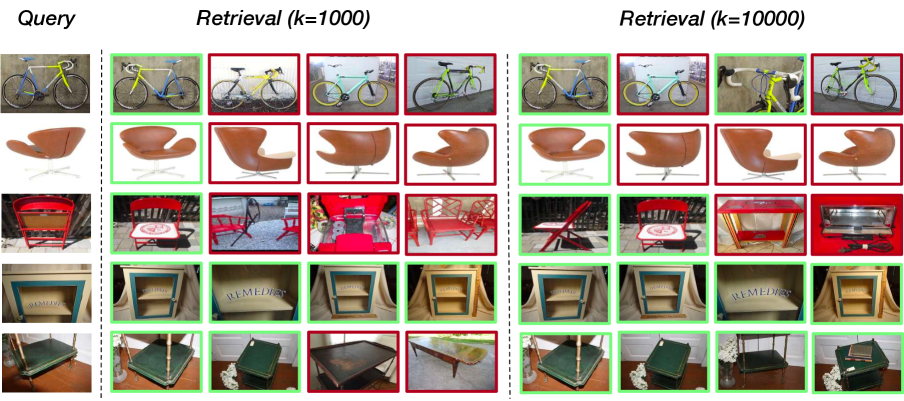
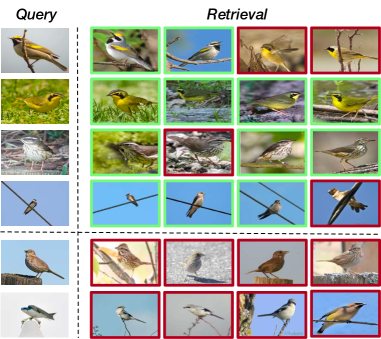
It is also noteworthy that the performance of UDML-SS on CUB and Product datasets is much closer than expected to some supervised methods. However, there is still a large gap between supervised and unsupervised method on Car. Figure 2 shows some example queries and nearest neighbors on Car with both successful and failure examples using UDML-SS. Some failure examples showed in Figure 2 look very similar to the query except logos, which is the common feature that people use to discriminate different cars. In general, it is hard for the unsupervised method to detect these kinds of fine-grained differences and we leave it for future work. In Figure 3, we show a comparison of retrievals using different number of clusters on Product.
| Method | R@1 | R@2 | R@4 | R@8 | NMI |
| Supervised | |||||
| Lifted [34] | 59.9 | 70.4 | 79.6 | 87.0 | 57.8 |
| Angular [45] | 71.3 | 80.7 | 87.0 | 91.8 | 62.4 |
| Triplet [47] | 45.1 | 57.4 | 69.7 | 79.2 | 52.9 |
| Triplet_hard [38] | 53.2 | 65.4 | 74.3 | 83.6 | 55.7 |
| Multi-Sim [46] | 84.1 | 90.4 | 94.0 | 96.5 | - |
| Unsupervised | |||||
| Exemplar [10] | 36.5 | 48.1 | 59.2 | 71.0 | 35.4 |
| NCE [50] | 37.5 | 48.7 | 59.8 | 71.5 | 35.6 |
| DeepCluster [6] | 32.6 | 43.8 | 57.0 | 69.5 | 38.5 |
| Rot-Only [15] | 33.3 | 44.6 | 56.4 | 68.5 | 32.7 |
| MOM [26] | 35.5 | 48.2 | 60.6 | 72.4 | 38.6 |
| Instance [51] | 41.3 | 52.3 | 63.6 | 74.9 | 35.8 |
| UDML-SS | 45.1 | 56.1 | 66.5 | 75.7 | 34.4 |
| Method | R@1 | R@10 | R@100 | NMI |
| Supervised | ||||
| Lifted [34] | 62.6 | 80.9 | 91.2 | 87.2 |
| Angular [45] | 67.9 | 83.2 | 92.2 | 87.8 |
| Triplet [47] | 53.9 | 72.1 | 85.7 | 86.3 |
| Triplet hard [38] | 57.8 | 75.3 | 88.1 | 86.7 |
| Multi-Sim [46] | 78.2 | 90.5 | 96.0 | - |
| Unsupervised | ||||
| Exemplar [10] | 45.0 | 60.3 | 75.2 | 85.0 |
| NCE [50] | 46.6 | 62.3 | 76.8 | 85.8 |
| DeepCluster [6] | 46.1 | 61.1 | 76.0 | 85.3 |
| Rot-Only [15] | 40.1 | 54.6 | 70.1 | 82.7 |
| MOM [26] | 43.3 | 57.2 | 73.2 | 84.4 |
| Instance [51] | 48.9 | 64.0 | 78.0 | 86.0 |
| UDML-SS (k=1000) | 54.4 | 70.0 | 82.9 | 86.5 |
| UDML-SS (k=10000) | 63.5 | 78.0 | 88.6 | 88.4 |
| Method | R@1 | R@100 | R@1000 | NMI |
| Product | ||||
| Instance [51] | 48.9 | 64.0 | 78.0 | 86.0 |
| Ours (, ) | 53.2 | 68.6 | 82.0 | 86.3 |
| Ours () | 54.4 | 70.0 | 82.9 | 86.5 |
| Ours (, ) | 63.4 | 77.4 | 87.6 | 88.4 |
| Ours () | 63.5 | 78.0 | 88.6 | 88.4 |
4.4 Ablation Study
We also conduct ablation study of the proposed unsupervised framework. Figure 4 shows the performance of UDML-SS with and without self-supervision loss. For all three datasets, metric learning loss equipped with k-means already achieves a decent performance. With additional rotation loss, the performance is further improved with a clear margin. For the Car dataset, the performance difference is up to 7% of Recall@1 between our method with and without rotation loss, which shows the importance of the rotation loss to UDML-SS. It is surprising that UDML-SS without the rotation loss still achieves better results than [51] on CUB and Product datasets. We speculate it is because the pre-trained Inception-V1 [41] itself provides a stronger signal to CUB and Product datasets than to the Car dataset. For more details about the performance of pre-trained Inception-V1 network, see [34].
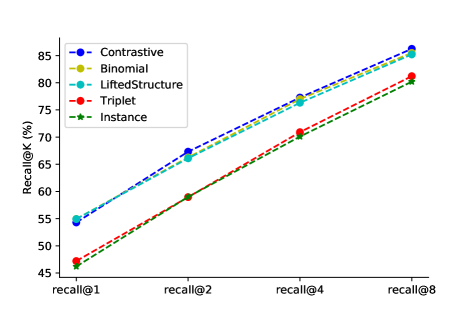
4.5 On Different Metric Learning Losses
In this section, we study the performance of UDML-SS using different metric learning loss functions. We conduct all the following experiments on the CUB dataset. It is interesting to see that in Figure 4 performances for Contrastive Loss, Binomial Loss and Lifted Structure Loss are very similar and all of them outperform the competing methods. However, Triplet Loss [38] does not work well, possibly because the success of triplet loss depends more on the label correctness.
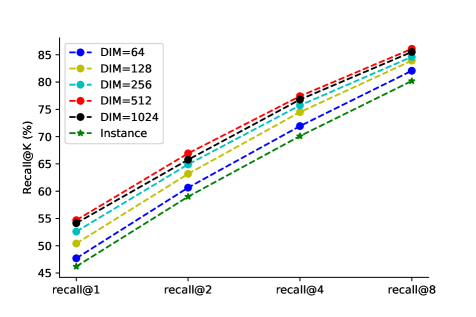
4.6 On the Embedding Size
Following [38], we study the performance of our proposed loss with different embedding sizes of {64, 128, 256, 512, 1024}. As shown in Figure 5, the performance is increased consistently with the embedding dimension except at 1024 on the CUB dataset. Our method with embedding dimension at 512 and 1024 performs similarly. We observe a similar pattern in the evaluations of Car and Product datasets. These results are provided in the appendix.
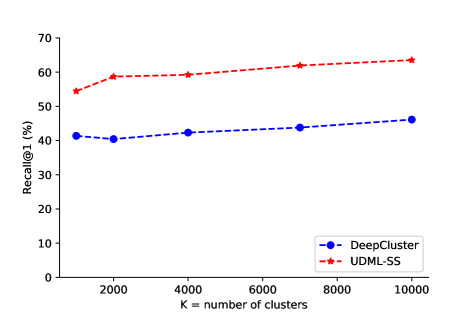
4.7 Choosing the Number of Clusters
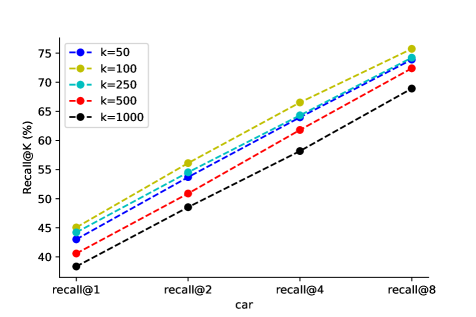
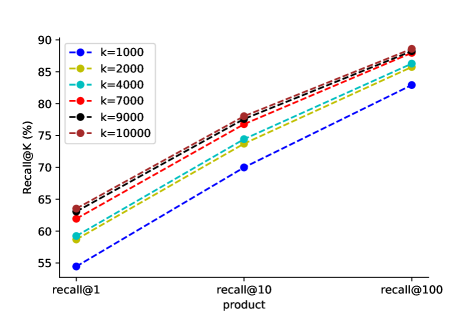
In this section, we measure the impact of the number of clusters () used in k-means on the performance of different datasets. In Table 5, we show the results using 50, 100, 250, 500, 1000 clusters. From the table for CUB dataset, we can see from a wide range of number of clusters (e.g. 50, 100, 250, 500), our method can achieve a better result than the competing method [51]. However, when the cluster size gets too large (e.g. k=1000), our method’s performance drops below that of the competing method. UDML-SS using different clusters on Car dataset shows similar performance trend as CUB dataset (see the appendix for details). For Product dataset, we show the performance of UDML-SS compared with DeepCluster [6] using the different number of clusters in Figure 6.
| k | R@1 | R@2 | R@4 | R@8 | NMI |
|---|---|---|---|---|---|
| Instance [51] | 46.2 | 59.0 | 70.1 | 80.2 | 55.4 |
| 50 | 50.7 | 63.0 | 74.4 | 84.1 | 57.0 |
| 100 | 54.7 | 66.9 | 77.4 | 86.1 | 61.4 |
| 250 | 52.1 | 64.5 | 75.4 | 83.9 | 56.6 |
| 500 | 49.4 | 61.4 | 73.1 | 83.3 | 56.5 |
| 1000 | 46.2 | 58.1 | 70.4 | 81.5 | 52.3 |
4.8 On Different ConvNet Backbones
| Method | R@1 | R@2 | R@4 | R@8 | NMI |
|---|---|---|---|---|---|
| Inception-V1 [41] | 54.7 | 66.9 | 77.4 | 86.1 | 61.4 |
| Inception-V2 [25] | 63.7 | 75.0 | 83.8 | 90.1 | 67.1 |
| ResNet34 [18] | 59.0 | 70.6 | 80.4 | 88.1 | 63.4 |
| ResNet50 [18] | 60.1 | 71.6 | 81.8 | 88.5 | 64.5 |
| ResNet101 [18] | 61.8 | 73.0 | 82.6 | 89.6 | 65.5 |
Here we show the performance of UDML-SS using different feature extractions backbones. The experiment is conducted on CUB dataset. From Table 6, we observe that Inception-V2 [25] and ResNet [18] can improve the performance by a large margin, while the performance difference between different ResNet is relatively small. It is noteworthy that the performance of UDML-SS with Inception-V2 is very close to that of supervised multi-similarity method [46], which also uses Inception-V2.
4.9 Learning from Scratch
So far, we showed that UDML-SS can perform very well with a chosen pre-trained network, e.g. Inception-V1 [41]. Now following [51], we evaluate the performance of UDML-SS using ResNet18 [18] without pre-training. Table 7 shows the performance of UDML-SS on Product dataset. The competing methods’ performance are originally from [51]. It is impressive that our method with random-initialized network can still outperform all other methods with a very large margin.
5 Conclusion
In this work, we have presented a new unsupervised metric learning framework (UDML-SS), which for the first time, combines clustering, self-supervised learning, and metric learning. In particular, we iteratively cluster embedding vectors using k-means and update embedding vectors by optimizing a multi-task loss function, which considers both similarity learning task and image rotation prediction task. We have demonstrated the effectiveness of the proposed framework on three popular benchmark datasets in metric learning. UDML-SS obtains a new state-of-the-art performance on these datasets. In addition, we explore the performance of UDML-SS with various popular metric learning loss functions. We empirically show that UDML-SS obtains state of the art performance even with a randomly initialized network.
References
- [1] Philip Bachman, R Devon Hjelm, and William Buchwalter. Learning representations by maximizing mutual information across views. arXiv preprint arXiv:1906.00910, 2019.
- [2] Miguel A Bautista, Artsiom Sanakoyeu, and Bjorn Ommer. Deep unsupervised similarity learning using partially ordered sets. In Proceedings of the IEEE Conference on Computer Vision and Pattern Recognition, pages 7130–7139, 2017.
- [3] Miguel A Bautista, Artsiom Sanakoyeu, Ekaterina Tikhoncheva, and Bjorn Ommer. Cliquecnn: Deep unsupervised exemplar learning. In Advances in Neural Information Processing Systems, pages 3846–3854, 2016.
- [4] Maxime Bucher, Stéphane Herbin, and Frédéric Jurie. Hard negative mining for metric learning based zero-shot classification. In European Conference on Computer Vision, pages 524–531. Springer, 2016.
- [5] Maxime Bucher, Stéphane Herbin, and Frédéric Jurie. Improving semantic embedding consistency by metric learning for zero-shot classiffication. In European Conference on Computer Vision, pages 730–746. Springer, 2016.
- [6] Mathilde Caron, Piotr Bojanowski, Armand Joulin, and Matthijs Douze. Deep clustering for unsupervised learning of visual features. In Proceedings of the European Conference on Computer Vision (ECCV), pages 132–149, 2018.
- [7] Mathilde Caron, Piotr Bojanowski, Julien Mairal, and Armand Joulin. Unsupervised pre-training of image features on non-curated data. 2019.
- [8] De Cheng, Yihong Gong, Sanping Zhou, Jinjun Wang, and Nanning Zheng. Person re-identification by multi-channel parts-based cnn with improved triplet loss function. In Proceedings of the iEEE conference on computer vision and pattern recognition, pages 1335–1344, 2016.
- [9] Carl Doersch, Abhinav Gupta, and Alexei A Efros. Unsupervised visual representation learning by context prediction. In Proceedings of the IEEE International Conference on Computer Vision, pages 1422–1430, 2015.
- [10] Alexey Dosovitskiy, Philipp Fischer, Jost Tobias Springenberg, Martin Riedmiller, and Thomas Brox. Discriminative unsupervised feature learning with exemplar convolutional neural networks. IEEE transactions on pattern analysis and machine intelligence, 38(9):1734–1747, 2015.
- [11] Yueqi Duan, Wenzhao Zheng, Xudong Lin, Jiwen Lu, and Jie Zhou. Deep adversarial metric learning. In Proceedings of the IEEE Conference on Computer Vision and Pattern Recognition, pages 2780–2789, 2018.
- [12] Zeyu Feng, Chang Xu, and Dacheng Tao. Self-supervised representation learning by rotation feature decoupling. In Proceedings of the IEEE Conference on Computer Vision and Pattern Recognition, pages 10364–10374, 2019.
- [13] Weifeng Ge. Deep metric learning with hierarchical triplet loss. In Proceedings of the European Conference on Computer Vision (ECCV), pages 269–285, 2018.
- [14] Timnit Gebru, Judy Hoffman, and Li Fei-Fei. Fine-grained recognition in the wild: A multi-task domain adaptation approach. In Proceedings of the IEEE International Conference on Computer Vision, pages 1349–1358, 2017.
- [15] Spyros Gidaris, Praveer Singh, and Nikos Komodakis. Unsupervised representation learning by predicting image rotations. arXiv preprint arXiv:1803.07728, 2018.
- [16] Alexander Grabner, Peter M Roth, and Vincent Lepetit. 3d pose estimation and 3d model retrieval for objects in the wild. In Proceedings of the IEEE Conference on Computer Vision and Pattern Recognition, pages 3022–3031, 2018.
- [17] Raia Hadsell, Sumit Chopra, and Yann LeCun. Dimensionality reduction by learning an invariant mapping. In 2006 IEEE Computer Society Conference on Computer Vision and Pattern Recognition (CVPR’06), volume 2, pages 1735–1742. IEEE, 2006.
- [18] Kaiming He, Xiangyu Zhang, Shaoqing Ren, and Jian Sun. Deep residual learning for image recognition. In Proceedings of the IEEE conference on computer vision and pattern recognition, pages 770–778, 2016.
- [19] Xinwei He, Yang Zhou, Zhichao Zhou, Song Bai, and Xiang Bai. Triplet-center loss for multi-view 3d object retrieval. In Proceedings of the IEEE Conference on Computer Vision and Pattern Recognition, pages 1945–1954, 2018.
- [20] Olivier J Hénaff, Ali Razavi, Carl Doersch, SM Eslami, and Aaron van den Oord. Data-efficient image recognition with contrastive predictive coding. arXiv preprint arXiv:1905.09272, 2019.
- [21] Dan Hendrycks, Mantas Mazeika, Saurav Kadavath, and Dawn Song. Using self-supervised learning can improve model robustness and uncertainty. arXiv preprint arXiv:1906.12340, 2019.
- [22] Alexander Hermans, Lucas Beyer, and Bastian Leibe. In defense of the triplet loss for person re-identification. arXiv preprint arXiv:1703.07737, 2017.
- [23] Junlin Hu, Jiwen Lu, and Yap-Peng Tan. Discriminative deep metric learning for face verification in the wild. In Proceedings of the IEEE conference on computer vision and pattern recognition, pages 1875–1882, 2014.
- [24] Junlin Hu, Jiwen Lu, and Yap-Peng Tan. Deep metric learning for visual tracking. IEEE Transactions on Circuits and Systems for Video Technology, 26(11):2056–2068, 2015.
- [25] Sergey Ioffe and Christian Szegedy. Batch normalization: Accelerating deep network training by reducing internal covariate shift. arXiv preprint arXiv:1502.03167, 2015.
- [26] Ahmet Iscen, Giorgos Tolias, Yannis Avrithis, and Ondřej Chum. Mining on manifolds: Metric learning without labels. In Proceedings of the IEEE Conference on Computer Vision and Pattern Recognition, pages 7642–7651, 2018.
- [27] Eric Jang, Coline Devin, Vincent Vanhoucke, and Sergey Levine. Grasp2vec: Learning object representations from self-supervised grasping. arXiv preprint arXiv:1811.06964, 2018.
- [28] Diederik P Kingma and Jimmy Ba. Adam: A method for stochastic optimization. arXiv preprint arXiv:1412.6980, 2014.
- [29] Jonathan Krause, Michael Stark, Jia Deng, and Li Fei-Fei. 3d object representations for fine-grained categorization. In Proceedings of the IEEE International Conference on Computer Vision Workshops, pages 554–561, 2013.
- [30] Gustav Larsson, Michael Maire, and Gregory Shakhnarovich. Learning representations for automatic colorization. In European Conference on Computer Vision, pages 577–593. Springer, 2016.
- [31] Laura Leal-Taixé, Cristian Canton-Ferrer, and Konrad Schindler. Learning by tracking: Siamese cnn for robust target association. In Proceedings of the IEEE Conference on Computer Vision and Pattern Recognition Workshops, pages 33–40, 2016.
- [32] Hsin-Ying Lee, Jia-Bin Huang, Maneesh Singh, and Ming-Hsuan Yang. Unsupervised representation learning by sorting sequences. In Proceedings of the IEEE International Conference on Computer Vision, pages 667–676, 2017.
- [33] Mehdi Noroozi and Paolo Favaro. Unsupervised learning of visual representations by solving jigsaw puzzles. In European Conference on Computer Vision, pages 69–84. Springer, 2016.
- [34] Hyun Oh Song, Yu Xiang, Stefanie Jegelka, and Silvio Savarese. Deep metric learning via lifted structured feature embedding. In Proceedings of the IEEE Conference on Computer Vision and Pattern Recognition, pages 4004–4012, 2016.
- [35] Aaron van den Oord, Yazhe Li, and Oriol Vinyals. Representation learning with contrastive predictive coding. arXiv preprint arXiv:1807.03748, 2018.
- [36] Deepak Pathak, Philipp Krahenbuhl, Jeff Donahue, Trevor Darrell, and Alexei A Efros. Context encoders: Feature learning by inpainting. In Proceedings of the IEEE conference on computer vision and pattern recognition, pages 2536–2544, 2016.
- [37] Olga Russakovsky, Jia Deng, Hao Su, Jonathan Krause, Sanjeev Satheesh, Sean Ma, Zhiheng Huang, Andrej Karpathy, Aditya Khosla, Michael Bernstein, et al. Imagenet large scale visual recognition challenge. International journal of computer vision, 115(3):211–252, 2015.
- [38] Florian Schroff, Dmitry Kalenichenko, and James Philbin. Facenet: A unified embedding for face recognition and clustering. In Proceedings of the IEEE conference on computer vision and pattern recognition, pages 815–823, 2015.
- [39] Hinrich Schütze, Christopher D Manning, and Prabhakar Raghavan. Introduction to information retrieval. In Proceedings of the international communication of association for computing machinery conference, page 260, 2008.
- [40] Kihyuk Sohn. Improved deep metric learning with multi-class n-pair loss objective. In Advances in Neural Information Processing Systems, pages 1857–1865, 2016.
- [41] Christian Szegedy, Wei Liu, Yangqing Jia, Pierre Sermanet, Scott Reed, Dragomir Anguelov, Dumitru Erhan, Vincent Vanhoucke, and Andrew Rabinovich. Going deeper with convolutions. In Proceedings of the IEEE conference on computer vision and pattern recognition, pages 1–9, 2015.
- [42] Michael Tschannen, Josip Djolonga, Paul K Rubenstein, Sylvain Gelly, and Mario Lucic. On mutual information maximization for representation learning. arXiv preprint arXiv:1907.13625, 2019.
- [43] Evgeniya Ustinova and Victor Lempitsky. Learning deep embeddings with histogram loss. In Advances in Neural Information Processing Systems, pages 4170–4178, 2016.
- [44] Catherine Wah, Steve Branson, Peter Welinder, Pietro Perona, and Serge Belongie. The caltech-ucsd birds-200-2011 dataset. 2011.
- [45] Jian Wang, Feng Zhou, Shilei Wen, Xiao Liu, and Yuanqing Lin. Deep metric learning with angular loss. In Proceedings of the IEEE International Conference on Computer Vision, pages 2593–2601, 2017.
- [46] Xun Wang, Xintong Han, Weilin Huang, Dengke Dong, and Matthew R Scott. Multi-similarity loss with general pair weighting for deep metric learning. In Proceedings of the IEEE Conference on Computer Vision and Pattern Recognition, pages 5022–5030, 2019.
- [47] Kilian Q Weinberger and Lawrence K Saul. Distance metric learning for large margin nearest neighbor classification. Journal of Machine Learning Research, 10(Feb):207–244, 2009.
- [48] Paul Wohlhart and Vincent Lepetit. Learning descriptors for object recognition and 3d pose estimation. In Proceedings of the IEEE Conference on Computer Vision and Pattern Recognition, pages 3109–3118, 2015.
- [49] Chao-Yuan Wu, R Manmatha, Alexander J Smola, and Philipp Krahenbuhl. Sampling matters in deep embedding learning. In Proceedings of the IEEE International Conference on Computer Vision, pages 2840–2848, 2017.
- [50] Zhirong Wu, Yuanjun Xiong, Stella X Yu, and Dahua Lin. Unsupervised feature learning via non-parametric instance discrimination. In Proceedings of the IEEE Conference on Computer Vision and Pattern Recognition, pages 3733–3742, 2018.
- [51] Mang Ye, Xu Zhang, Pong C Yuen, and Shih-Fu Chang. Unsupervised embedding learning via invariant and spreading instance feature. In Proceedings of the IEEE Conference on Computer Vision and Pattern Recognition, pages 6210–6219, 2019.
- [52] Sasi Kiran Yelamarthi, Shiva Krishna Reddy, Ashish Mishra, and Anurag Mittal. A zero-shot framework for sketch based image retrieval. In European Conference on Computer Vision, pages 316–333. Springer, 2018.
- [53] Baosheng Yu, Tongliang Liu, Mingming Gong, Changxing Ding, and Dacheng Tao. Correcting the triplet selection bias for triplet loss. In Proceedings of the European Conference on Computer Vision (ECCV), pages 71–87, 2018.
- [54] Rui Yu, Zhiyong Dou, Song Bai, Zhaoxiang Zhang, Yongchao Xu, and Xiang Bai. Hard-aware point-to-set deep metric for person re-identification. In Proceedings of the European Conference on Computer Vision (ECCV), pages 188–204, 2018.
- [55] Richard Zhang, Phillip Isola, and Alexei A Efros. Colorful image colorization. In European conference on computer vision, pages 649–666. Springer, 2016.
- [56] Stephan Zheng, Yang Song, Thomas Leung, and Ian Goodfellow. Improving the robustness of deep neural networks via stability training. In Proceedings of the ieee conference on computer vision and pattern recognition, pages 4480–4488, 2016.
- [57] Wenzhao Zheng, Zhaodong Chen, Jiwen Lu, and Jie Zhou. Hardness-aware deep metric learning. In Proceedings of the IEEE Conference on Computer Vision and Pattern Recognition, pages 72–81, 2019.
6 Appendix
In this appendix, we show more detailed experimental results to support our paper. We add more details of experiments on three standard datasets for metric learning: CUB-200-2011 [44], Cars-196 [29] and Stanford Online Products [34].
6.1 On the Embedding Size
In Table 8 and 9, we show the experimental results of UDML-SS on Car and Product datasets with different embedding sizes.
| Embedding Size | R@1 | R@2 | R@4 | R@8 |
|---|---|---|---|---|
| 64 | 36.0 | 45.6 | 56.7 | 67.4 |
| 128 | 41.2 | 50.8 | 61.6 | 72.0 |
| 256 | 43.2 | 53.4 | 63.7 | 73.8 |
| 512 | 45.1 | 56.1 | 66.5 | 75.7 |
| 1024 | 46.1 | 56.2 | 66.4 | 75.6 |
| Embedding Size | R@1 | R@2 | R@100 |
|---|---|---|---|
| 64 | 62.5 | 77.2 | 88.2 |
| 128 | 62.9 | 77.7 | 88.4 |
| 256 | 63.3 | 77.9 | 88.6 |
| 512 | 63.5 | 78.0 | 88.6 |
| 1024 | 63.5 | 77.9 | 88.5 |
6.2 Choosing the Number of Clusters
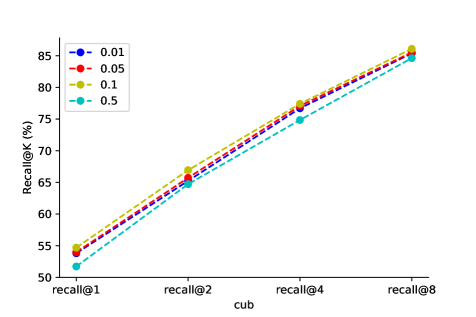
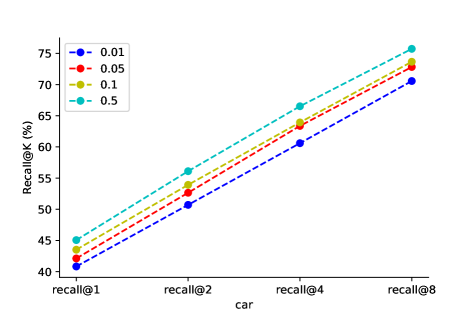
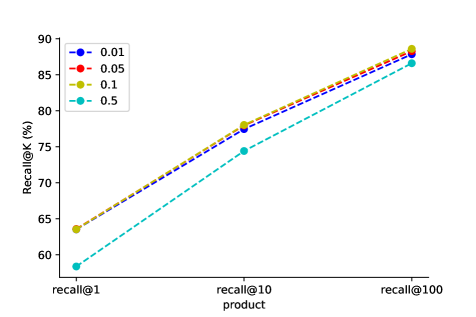
6.3 How affects evaluation results
This section, we show the evaluation results on CUB, Car and Product datasets of UDML-SS using different in Figure 10, 11 and 12.