Mining News Events from Comparable News Corpora: A Multi-Attribute Proximity Network Modeling Approach
Abstract
We present ProxiModel, a novel event mining framework for extracting high-quality structured event knowledge from large, redundant, and noisy news data sources. The proposed model differentiates itself from other approaches by modeling both the event correlation within each individual document as well as across the corpus. To facilitate this, we introduce the concept of a proximity-network, a novel space-efficient data structure to facilitate scalable event mining. This proximity network captures the corpus-level co-occurence statistics for candidate event descriptors, event attributes, as well as their connections. We probabilistically model the proximity network as a generative process with sparsity-inducing regularization. This allows us to efficiently and effectively extract high-quality and interpretable news events. Experiments on three different news corpora demonstrate that the proposed method is effective and robust at generating high-quality event descriptors and attributes. We briefly detail many interesting applications from our proposed framework such as news summarization, event tracking and multi-dimensional analysis on news. Finally, we explore a case study on visualizing the events for a Japan Tsunami news corpus and demonstrate ProxiModel’s ability to automatically summarize emerging news events.
I Introduction
With the proliferation of digital media and newswires, massive online news data has become widely available. Subsequently, automated analysis of news events has become an important research issue since the sheer quantity of news events makes human-powered analysis intractable [11, 36, 30].
An interesting phenomenon within these large new corpora is that in addition to a large coverage of news events within a corpus, individual articles within a collection often contain redundant, partially overlapping content with each other. This overlapping content provides an opportunity to align articles and discover what is important.
More formally, this information redundancy from partially overlapping content across news articles provides the statistical power necessary to confidently identify and describe important events as well as their essential attributes such as time, location, and relevant persons and organizations. Moreover, because news articles often concurrently cover multiple related events, the vast redundancy facilitates the discovery of the connections that link events forming a comprehensive new event timeline.
Discovering, extracting, and visualizing events along with their key descriptors, attributes, and temporal and relevancy connections makes it possible to both understand the intricacies of an event while simultaneously forming a big-picture by linking events. As such, it’s desirable to build a system that, given a news corpus, automatically discovers important events, attributes key properties to them accurately, and connects them thematically and temporally.
There have been multiple approaches to summarize and visualize news events. However, these approaches suffer from several limitations.
-
1.
Unigram-based event descriptors: While some systems use unigrams (i.e., single words) as event descriptors [11, 15], it has been shown that phrases are more descriptive and interpretable than words [32, 5]. There are several studies that use phrases in information flow detection on the Web [9, 29] or in event detection with micro blogs [23, 10]. However, their phrases are not for describing events but for searching and linking multiple documents.
-
2.
Lack of key attributes for event description: A reader can better understand the context of an event if aware of several key attribute values of an event: when and where the event happened, and who or which organizations the event is related to [31, 22]. Most previous works do not provide such defining attributes to events. Others apply heuristics such as extracting event attributes from meta data like publication dates and reporting locations, which can be noisy and misleading. Other key values, such as persons or organizations, are often unavailable or inaccurate.
-
3.
Ignoring event connections within a single document: Events naturally relate to each other. For example, in 2011, an earthquake off the coast of Japan triggered a tsunami; this tsunami propelled a series of incidents that led to the 2011 Japan nuclear disaster. While these connections are often explicitly addressed within news articles, many event detection and tracking studies in micro blogs [24, 10, 23] and news articles [11, 15] make the strong assumption that each document describes a single event. While this assumption may hold true for short documents such as micro blog posts, long documents like news articles are more susceptible to event drift and may contain multiple related events.
Given the assumption that noisy news text corpora is plentiful and these corpora contain news articles of redundant and comparable content, we propose a model for (1) identifying key attributes and descriptors, (2) grouping them, and (3) denoising them to extract high-quality event knowledge. This new approach, ProxiModel (Proximity network-based generative model), leverages the notion of proximity: If two instances co-occur in news articles closely and frequently, they have high proximity. ProxiModel leverages this notion of proximity to model events, descriptors, attributes, and connections.
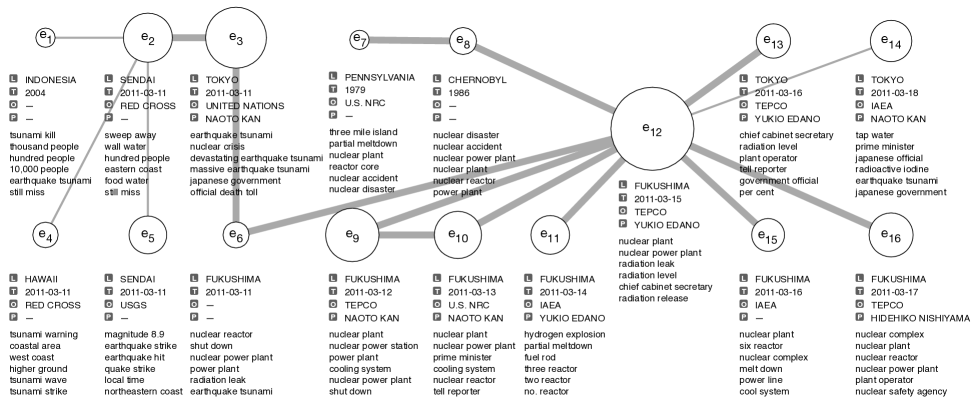
Fig. 1 shows an example output of ProxiModel for a news collection covering the 2011 Japan tsunami and subsequent nuclear accident. There are events shown, with automatically generated phrasal key descriptors and event attributes, where circle size represents the importance of events, and line width the strength of event connection.
By automatically identifying latent news events, their phrasal descriptors, attributes, and connections, ProxiModel provides an effective framework for organizing and exploring these huge amounts of data. This process is performed without understanding the semantic meaning of the content in the news articles. Instead, the method purely utilizes the interconnections between event attributes and their proximity. ProxiModel possesses several key qualities that differentiate it from other event detection methods and allow for high-quality event discovery and intuitive and interpretable organization of news: (1) it provides a big picture of events in news articles with rich information, which includes the importance of events, key phrasal descriptors, event attributes, and event connections, (2) it solely utilizes proximity information with regularized sparsity on model parameters to find correct event attributes and connections from text, and (3) it uses a scalable data structure, called a proximity network, that stores necessary information from news articles.
The remaining portion of the paper is organized as follows: Section II introduces the preliminaries and definitions. Section III describes our construction of proximity networks, followed by our generative models and the model learning process. Our experimental setup and results are described in Section IV. The related work is discussed in Section V, and Section VI concludes our study.
II Preliminaries
While bearing some similarities, event discovery has subtle differences from topic discovery or topic modeling. Traditionally, a topic is defined as a distribution of words [4]. An event, however, is associated with several key attributes including location, time, person, organization, and a set of descriptive phrases to denote theme.
We first examine several key attributes and primitives of events.
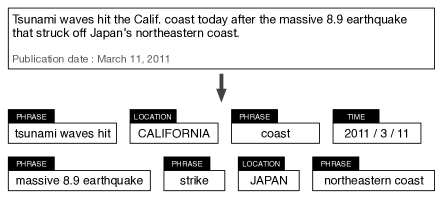
1. Time: Temporal expressions are extracted from documents and normalized to the form of the TIMEX3, which is a part of the TimeML annotation language [20]. Relative temporal expressions like “last night” and “yesterday” are also normalized by taking the report time or publication time of the document as the fixed reference time. For example, the word “today” in Figure 2 is mapped to “2011/3/11” because of the publication date. In this paper, we informally refer to the extracted normalized time expressions as time.
2. Location: Locations are geo-political entities such as city, state, and country. They are extracted and normalized to their surface forms. For example, the word “Calif.” is mapped to “CALIFORNIA” in Figure 2.
3. Person Extracted persons are not only public figures, but also private figures who are mentioned in news articles. For example, Jun-seok Lee, who was the captain of the sunken Sewol Ferry, is extracted. Co-references are also resolved within a document (e.g., Captain Lee is mapped to Jun-seok Lee).
4. Organization Companies, governments, and other organizations are extracted. An abbreviation of an organization is mapped to its full name if they are mentioned in the same document. For example, TEPCO is mapped to Tokyo Electric Power Company.
5. (Thematic) phrases: A phrase is a sequence of contiguous words that represents a meaningful semantic unit. Recently developed phrase mining algorithms such as ToPMine [5] and SegPhrase [12] perform fast, pruning-based frequent contiguous pattern mining and then statistically reason about the significance of the contiguous co-occurrence while applying context constraints to discover meaningful phrases. We use ToPMine [5] to mine quality phrases representing the above dimensions as well as thematic phrases that form a thematic dimension as shown in Fig. 2.
For simplicity, we refer to any phrase, time, location, person, or organization as a basis. A document is a sequence of segments , where corresponds to a basis. The order of segments corresponds to the order of original word tokens in the document. For a given comparable news corpus, we want to discover events defined as follows:
Definition 1 (Event)
An event, , is a real-world occurrence represented as a 5-tuple , where is the distribution over all phrases, is that (distribution) over all locations, is that over all time, is that over all organizations, and is that over all persons.
III Event Mining
In this section, we introduce the concept of a proximity network and demonstrate the process of generating one from a comparable news corpus. We then propose an event mining method that operates efficiently on the constructed proximity network.
III-A Comparable News Corpus
In NLP tasks such as machine translation, a comparable corpus is a corpus consisting of documents on similar topics [2]. Similarly, we define a comparable news corpus is a collection of news articles that cover related events. Manually obtaining such corpora is relatively simple and can be done, for example, by simply using keyword search on a news database. Given that such a corpus is curated using a few key-word searches, the resultant comparable news corpus contains many documents with partially repeated information and common phrases for important events. These documents with their overlapping pieces of information can aid in analyzing and understanding the underlying events that these documents detail.
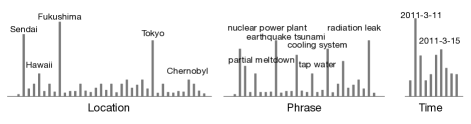
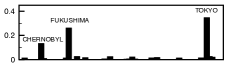
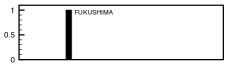
Here we briefly illustrate the potential of a collective analysis on a comparable news corpus, with two simple but incomplete analysis methods. The first is counting the occurrences of key attributes such as locations, phrases, and time as shown in Fig. 3. The second is by counting redundant information across the news articles about Japan tsunami in 2011, the peaks show important information in each dimension.
Unfortunately, such peaks, generated from document-level co-occurrences of key attributes may be inaccurate and are as such unsuitable for extracting events. For example, a hydrogen explosion in a nuclear power plant happened in Fukushima on March 14, 2011. The phrase “hydrogen explosion”, however, has high co-occurrence with “2011-03-11” because most of the news articles mentioned the earthquake on March 11, 2011 to address the cause of the damaged nuclear power plant. To avoid these problems, events should be resolved by considering the proximity of bases within documents.
III-B Proximity Network
Proximity is a measure of how close two terms occur in a document or a passage. This measure has been successfully adopted in many different tasks including word association [33, 34], document retrieval [13, 35], named entity retrieval and expert finding [3, 19].
Proximity is an important cue for estimating the strength of association between two bases, in which a strong association between two bases indicates they belong to the same event. For example, in the Japan Tsunami news corpus, we find time expressions of 2011/03/11 near earthquake hit phrase frequently: This is the time when a massive earthquake hit Japan. In addition, we find the phrase radiation leak around mentions of the location Fukushima more often than other locations: Similarly, Fukushima is the city where crippled nuclear power plants had radiation leaks.
We want to collect such evidence or associations between bases in an efficient way by constructing an information network that we refer to as a proximity network. We define a proximity network as a heterogenous network with different types of nodes and edges between them. The set of nodes in the proximity network is the set of bases in a given corpus , and the weight of an edge between two nodes is based on proximity between the nodes as follows.
where is an indicator function and is a proximity kernel such that
Note that is a constant that controls the propagation scope of each segment. A proximity network with small captures very different information from one with large . We will use two proximity networks with different s to model different information as discussed in the next section.
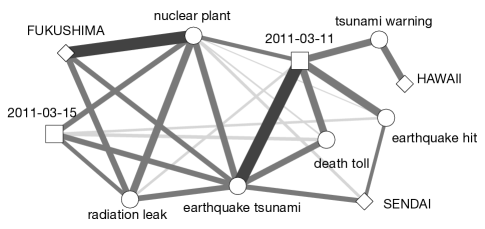
An example of proximity networks is shown in Figure 4, generated from the Japan Tsunami corpus with . It shows strong proximity between FUKUSHIMA and nuclear plant and between earthquake tsunami and 2011-03-11. If one tries to cluster the nodes in the figure based on the edges, such clustering may yield three clusters as follows:
-
1.
{ 2011-03-15, FUKUSHIMA, radiation leak, earthquake tsunami, nuclear plant }
-
2.
{ 2011-03-11, SENDAI, earthquake tsunami, death toll, earthquake hit }
-
3.
{ 2011-03-11, HAWAII, tsunami warning }
We posit that some latent parameters guide the formation of clusters of nodes. As such, we model such latent parameters as events and describe how to best infer these latent events in the following section.
A proximity network constructed from the corpus could be noisy and dense without post-processing. Since our corpus has partially repeated news articles and important links get greater weights, we use link minimum support () to remove infrequent links (i.e., whose weights are less than ). This truncation not only removes noise in the network, but also makes the network sparse, where modeling becomes more efficient in relation to time and space.
III-C Proximity Network Generative Models
In this section, we describe the Proximity Network Generative Model (ProxiModel). Proximity networks have pairwise proximity information among bases. Unlike previous studies that use heuristic proximity metrics [33, 34, 13, 35, 19], we learn latent parameters from proximity to model events. Specifically, we design a probabilistic model for proximity networks to model events, in which edges in the networks are created according to a generative process. In order to model events with descriptors, attributes, and connections, we construct two proximity networks and , with small and large values, from an input corpus.
Proximity Network : is set smaller than to capture proximity within a smaller propagation scope. This proximity network is mainly used to learn event descriptors and attributes. It only has edges with at least one phrase end node. In other words, it only has edges consisting of phrase-phrase, phrase-time, phrase-location, phrase-organization, or phrase-person.
Proximity Network : is set greater than to capture proximity within a larger propagation scope. This proximity network is mainly used to learn event connections. It only has edges with two phrase end nodes. In other words, it has only edges of phrase-phrase.
Our Assumptions: In the generative model, we encode our assumptions as follows:
-
1.
Two phrases for the same event have high proximity in .
-
2.
A phrase and an event attribute for the same event have high proximity in .
-
3.
Two phrases from different events have high proximity in if the events are connected
-
4.
Each event has a few event attributes of the same type.
-
5.
There are only a few event connections.
Note that two phrases for the same event have high proximity in as well as in because of the Gaussian kernel.

We first address the assumptions with an example news article in Figure 5. The news article mainly reports the leaked radiation from a crippled nuclear power plant in Fukushima, Japan, which happened on March 15, 2011.
The article also mentions a main cause of the damages in the nuclear power plant—a massive earthquake hit Japan in March 11, 2011 which caused strong tsunamis that damaged the nuclear power plant. For example, radiation leaked and crippled nuclear plant have high proximity in as an example of Assumption 1. 9.0-magnitude earthquake and Friday have high proximity in as an example of Assumption 2. In addition, 9.0-magnitude earthquake and crippled nuclear plant have high proximity in .
III-C1 Generative Process
In our generative model, we convert the edge weights in and to multigraphs as follows: The number of edges between two nodes is equal to the integer part of the weight in the original network. We denote the total number of edges in and by and respectively.
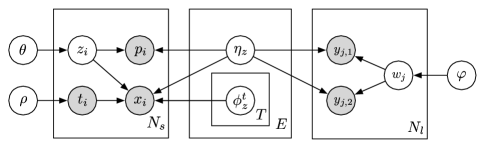
We define a generative process for edges in and as shown in Algorithm 1. In , each edge belongs to one event, indicating two end points belong to the event. In , end points of each edge can belong to different events as well as the same event. See Figure 6 for a graphical representation of the model.
In this generative model, we can derive the distribution of the number of edges between any two nodes in . Generating an edge between a phrase- node and an attribute- node of type in event can be modeled as a Bernoulli trial with a success probability of . When is large, the total number of successes, asymptotically follows a Poisson distribution [27] as follows:
Due to the additive property of Poisson distribution, we can derive that the observed variable follows a Poisson distribution as follows:
Thus, given the model parameters, the probability of all observed edges in is
where .
Similarly, we can derive the distribution of the number of edges between any two nodes in .
Thus, given the model parameters, the probability of all observed edges in is
where .
The overall probability of all observed edges in and is
We encode Assumptions 1 and 2 in the generative process of , and Assumption 3 in the generative process of .
To model the assumptions that each event has only a few event attributes and there are only few event connections, we introduce sparse regularization on model parameters as priors.
We impose an apriori probability on the parameters given by
| (1) |
where , , is the Shannon’s entropy of distribution , and and are sparse prior weights. With higher values of and , event attributes and connections have lower entropy, i.e. are sparser.
III-C2 Parameter Learning
We learn the model parameters by the Maximum Likelihood (ML) principle. To deal with the normalization constants of the prior probabilities, the log-likelihood of Eq (1) must be augmented by appropriate Lagrange multipliers:
Then, we maximize using an Expectation-Maximization (EM) algorithm that iteratively infers the model parameters.
The E-step calculates the expected number of edges:
| (2) | ||||
| (3) |
In the M-step, the update equations for , , and are given by
| (4) | |||
| (5) |
In the M-step, maximization of with respect to and leads to different sets of equations due to their priors and Lagrange multipliers:
| (6) | |||
| (7) |
The above set of simultaneous transcendental equations for and can be solved using the Lambert’s function similar to [28].
| (8) |
where equations Eq. (6) and Eq. (8) form a set of fixed-point iterations for , and thus the M-step for finding .
Similarly, we can get the following update equation for :
| (9) |
IV Experiments
In this section, we evaluate ProxiModel on a variety of news article corpora. We begin by first describing the comparable news corpora we collected for our evaluation, then showing the quality of event descriptors and attributes generated by ProxiModel, when compared to baselines. After evaluating the quality of our events, we benchmark the efficiency of our algorithm. We demonstrate the efficiency gains of constructing a compact network for a corpus (without document-level representation) as we increase the number of documents. In addition, we show how using a link minimum support threshold reduces the runtime while maintaining high-quality attributes. Since we have three technical parameters—noise reduction, proximity and sparsity—that affect the quality of event descriptors and attributes as well as method efficiency, we perform parameter studies by varying these parameters to highlight the effects of proximity and sparsity.
Finally, by applying our methodology and extracting key event descriptors and event attributes, we demonstrate how one can construct an event storyline detailing the timeline of events.
IV-A Datasets
We evaluate each method on three news corpora, collected from a variety of news agencies through NewsBank 111www.newsbank.com, which cover different distinct topical content.
-
•
Sewol Ferry (2014): The sinking of Sewol ferry occured on April 16, 2014, en route from Incheon to Jeju. We searched articles with “Sewol Korea” keywords, and collected 1,520 articles published from April 15, 2014 to June 30, 2014.
-
•
Japan Tsunami (2011): A massive 8.9-magnitude earthquake shook Japan on March 11, 2011, causing a devastating tsunami to the coast of Japan. We searched articles with “Japan Tsunami” keywords, and collected 21,528 articles published from March 11, 2011 to April 11, 2011.
-
•
Multiple (2014): This dataset has multiple news stories, including Ebola outbreak, the 2014 Winter Olympics, Russian military intervention in Ukraine, missing MH370, Gamboru Ngala attack, Jos bombings, ISIS, Israel-Gaza conflict, and the MH17 tragedy. We searched articles with multiple keywords for each news story, and collected 100,472 articles published in 2014.
Table I summarizes the collected three datasets. The number of events and the other input parameters can be selected by using cross-validation with perplexity or Bayesian information criterion (BIC) [26]. In our study, we set the number of events as follows: 10 for Sewol Ferry, 30 for Japan Tsunami, and 60 for Multiple. As the default values, we set the proximity parameters and to 1 and 10, and the sparsity parameters , , , , and to 1000, 1000, 10, 10, and 100, respectively.
| Dataset | Articles | Words | TIME | GPE | ORG | PERSON |
|---|---|---|---|---|---|---|
| Sewol Ferry | 1,520 | 5,706 | 67 | 190 | 164 | 235 |
| Japan Tsunami | 21,528 | 31,793 | 574 | 2,367 | 2,862 | 4,338 |
| Multiple | 100,472 | 133,540 | 3,565 | 10,907 | 15,417 | 39,093 |
IV-B Baselines
Method HISCOVERY PhraseLDA ProxiModel-NP ProxiModel-NS ProxiModel Descriptors ferry third mate save life people in need people in need ship abandon ship third mate two crew member two crew member people begin list two crew member third mate third mate captain senior prosecutor look whether arrest suspicion negligence abandon arrest suspicion negligence abandon passenger 30 minute distress call look whether look whether crew make sharp turn evacuation order senior prosecutor evacuation order rescue arrest warrant sharp turn evacuation order save life sewol arrest suspicion negligence abandon coast guard news agency arrest warrant miss look whether inside ferry save life senior prosecutor official first mate high school arrest warrant four crew member Attributes SEOUL INCHEON INCHEON MOKPO MOKPO 2014-04-20 2014-04-19 2014-04-19 2014-04-19 2014-04-19 LEE JOON-SEOK LEE JOON-SEOK LEE JOON-SEOK LEE JOON-SEOK LEE JOON-SEOK YANG JUNG-JIN YANG JUNG-JIN YANG JUNG-JIN YANG JUNG-JIN YANG JUNG-JIN
For the comparative study, we have identified two, directly comparable methods and two variations of ProxiModel as baselines for each of our proposed hypotheses.
-
•
HISCOVERY: This work [11] assumes each document describes a single event, and the event time is very close to the publication date of the news article. Because of the event time assumption, this model uses publication dates as extra information, which is not available to other baselines.
-
•
PhraseLDA: PhraseLDA is proposed in [5]. This model extends Latent Dirichlet allocation to incorporate phrase generation. It utilizes the co-occurrence of phrases or attributes in documents, instead of using proximity. In addition, it has homogeneous outcomes from the generative process, in which all phrases and attributes are generated from a single distribution.
-
•
ProxiModel-NP: This is a variation of our model which does not use the proximity information, but instead uses solely the co-occurrence information. It is a special case of ProxiModel, where the proximity parameters () are set to a very large number. This model serves to see the effectiveness of the proximity information.
-
•
ProxiModel-NS: This is our model without the sparse regularization. It is a special case of ProxiModel, where the sparsity parameters are 0. This baseline is designed to show the effects of sparse priors.
IV-C Event Descriptor Evaluation
In this section we perform a user-study to evaluate the descriptors of the key events across each method.
We select key events from each dataset that can be found across all the methods.
These alignments were performed by expert examination of the descriptors and attributes. One example of a key event used in our evaluation is: “captain arrested on suspicion of negligence” in 4/19/2014 which was reported in a news article: “senior prosecutor Yang Jung-jin said the ferry captain, Lee Joon-seok, 68, faces five charges including negligence of duty and violation of maritime law.” 222The article can be found in http://goo.gl/0jW2dO
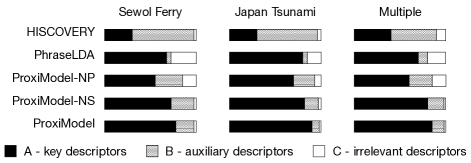
We found 4 events in Sewol Ferry, 10 events in Japan Tsunami, and 16 events in Multiple datasets. For each key event, we collected the top 10 descriptors from each method, combined and shuffled them to make a method-blind list of descriptors. We then asked four participants, who are very familiar with each event and have first read multiple articles for further familiarity, to label each descriptors into the following categories A to C: (A) key descriptors, (B) vague or auxiliary descriptors, and (C) not related. The agreement of the labels by the four participants was measured as 0.67 in Fleiss’ kappa [6], indicating substantial agreement.
We show an example of aligned key events in Sewol Ferry and the top 10 descriptors and the associated attributes from each methods in Table II. Figure 7 shows the distribution of labels for each method. The phrase-based methods have smaller proportions of B labels than the word-based method, HISCOVERY. In addition, the results show that modeling proximity is important to find key descriptors for events.
IV-D Event Attribute Evaluation
We use a positive and negative set of event attributes for event attribute evaluation. We define a positive set of event attributes as follows: all attributes in a positive set related to one specific event.
We generated a candidate list of attribute sets and labelled them manually. Table III shows some of the annotated event attribute sets.
We compute the probability to generate a given set of attributes from one event as following:
where is a model, is an event, is a given labeled set of attributes, and is an attribute in .
Based on these probabilities, we rank the labelled sets of attributes to compute the area under the curve (AUC) of the receiver operator curve (ROC)—a curve showing the true positive rate against the false positive rate. This is a standard measure used in information retrieval to show the performance of a binary classifier as the discriminatory threshold is varied. We can see the performance of our model compared to other baselines in Table IV. While ProxiModel and ProxiModel-NS outperform the other baseline methods, ProxiModel has marginal improvement over ProxiModel-NS. We will address this difference between our sparse model, and non-sparse model in Section IV-E3. Also, note that PhraseLDA has lower AUC than ProxiModel, especially in Organization and Person because of using a single distribution for attributes and phrases.
Time Location Phrase + 2011-03-11 HAWAII tsunami warning + 2011-03-16 FUKUSHIMA nuclear power plant - 2011-03-11 CHERNOBYL cooling system - 2011-03-16 TOKYO spend fuel pool Positive and negative examples of Base
Time Location Phrase Org. + 2011-03-11 SENDAI relief effort RED CROSS + 2011-03-19 TOKYO radiation level TEPCO - 2011-03-12 CHERNOBYL cooling system IAEA - 2011-03-12 LIBYA sweep away UN Positive and negative examples of Base + Organization
Time Location Phrase Person. + 2011-03-11 FUKUSHIMA stay indoors NAOTO KAN + 2011-03-17 FUKUSHIMA storage pool YUKIO EDANO - 1979 UKRAINE radioactive material NAOTO KAN - 2011-03-11 SENDAI fuel rod BARACK OBAMA Positive and negative examples of Base + Person
HISCOVERY PhraseLDA ProxiModel-NP ProxiModel-NS ProxiModel Sewol Ferry Base 0.5217 0.7971 0.6102 0.8010 0.8103 Org. 0.5190 0.6659 0.5111 0.6983 0.6944 Person 0.5144 0.6105 0.5308 0.6385 0.6455 Japan Tsunami Base 0.5149 0.6018 0.5212 0.6854 0.6976 Org. 0.4754 0.5018 0.5594 0.7648 0.7688 Person 0.6093 0.5334 0.5291 0.6710 0.6948 Multiple Base 0.5928 0.7139 0.6272 0.7310 0.7351 Org. 0.6254 0.6740 0.6170 0.7564 0.7431 Person 0.5409 0.6688 0.6504 0.7605 0.7660
IV-E Parameter Studies
There are three main parameters in ProxiModel to control the noise reduction: (1) link minimum support, (2) proximity measures, and (3) sparsity of learning parameters. In the following sections, we show how these parameters affect the model’s performance.
IV-E1 Link Minimum Supports
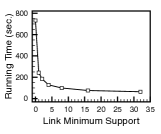
Because ProxiModel leverages data redundancy, it naturally places higher emphasis on larger link-weights. Taking this into consideration, we apply a minimum support to links in order to reduces the number of trivial links and thus enhance the efficiency of the algorithm. In the Japan tsunami dataset, more than 96% of links have less than 1.0 weight. By removing small weight links, we have comparable results in quality, but better efficiency.
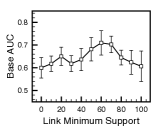
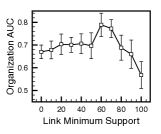

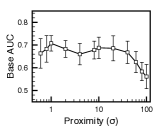
In Figure 8, we analyze both our performance as a measure of area under curve of ROC and our runtime performance as we vary the link minimum support parameter. We show the performance of ProxiModel in AUC against different values of link minimum support, . When is too large, the performance is degraded due to the loss of important information. For all our datasets, we set to 10.
In Figure 11(a), as we increase the minimum support, proximity networks become sparser, leading to improved efficiency and better runtime.
IV-E2 Proximity
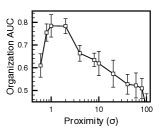
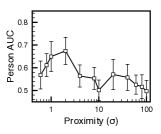
In Section IV-D, experiments showed ProxiModel outperforming ProxiModel-NP (non-proximity). In this section we vary to control our proximity parameter and analyze its effect on retrieval performance. In Figure 9, we show the performance of our model in AUC with variants with different proximity parameters() for . We notice peaks around one in the all figures, but we have significant drops for Organization and Person performance when . As we addressed in Section III-B, proximity is related to the information propagation within a document. When is large, the proximity network captures long range information propagation. For smaller , only near-by information is propagated. Analyzing Figure 9, we can see indication that for organizations and persons, information is generally propagated in relatively shorter range when compared to location and time information while enjoying long-range propagation. As such, this motivates setting the proximity parameters for each attribute.
IV-E3 Sparsity
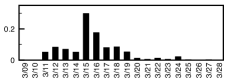
As mentioned previously, ProxiModel demonstrated marginal improvement over ProxiModel-NS, which was shown to not be statistically significant in Table IV. While objectively performance is marginal, we observe however that sparsity affects the interpretability of the learned parameters. For example, Figure 10 shows the learned parameters – location distribution and time distributions – for the fire explosion that occurred in the Fukushima nuclear power plant on March 15th. Unlike non-sparse models which display many peaks and thus conflicting information, ProxiModel appears sparse displaying single peaks in the location distribution and time distribution. These are significantly more human-interpretable.

IV-F Efficiency Analysis
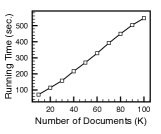
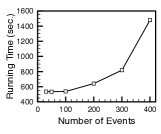
To understand the run-time efficiency of our methodology, we measure the run-time of ProxiModel using our Multiple dataset, which has approximately 100k documents combined from a variety of sources. We measure runtime as we incrementally increase corpus size. Figure 11(b) demonstrates empirically run-time is linear in terms of the number of documents. We then vary the number of events parameter and observe run-time performance. From Figure 11(c) we can see that runtime is quadratic in relation to number of events. As this parameter is usually small (a small number of events), this is less significant than linearity with respect to corpus size.
IV-G Visualization
We use ProxiModel to learn Japan Tsunami events and their connections, and visualize them in Figure 1. An event is represented by a circle with a radius proportional to its probability in event distribution . Each event is described by a list of top 6 event descriptors from in conjunction with top event attributes (e.g., time, location, organization, persons) from . For some events, there could be no relevant event attributes for a certain type. When for a top event attribute of an event , the top event attribute is ignored and shown as –. This combination of human-interpretable, multi-word phrases with event attributes help an individual to better understand each event.
In addition, links between events are drawn based on . Since we impose sparsity on , there are only a few non-trivial links between events. Each line width is proportional to its probability in event link distribution . The links between events help chain related events together naturally forming an easy-to-interpret branching timeline story. By systematically traversing this event graph, one can naturally construct a storyline of the significant events surrounding the Japan nuclear disaster.
V Related Work
With the explosion of digitalized news data, identifying and organizing news articles into events has emerged as a key method of improving access and reuse of these large news collections. Many attempts have been made to extract events from text corpora. These approaches can be categorized into NLP-based contextual analysis approaches and data mining approaches.
In the NLP literature, many approaches employ rich features to model event extraction as a parsing problem. McClosky et al. perform event extraction by creating a tree of event-argument relations and using this as a representation for reranking of the dependency parser [14]. NLP event extraction techniques have even been applied to extracting biomedical events from text literature such as binding, regulation, and gene-protein interactions; these techniques rely on a rich feature-set for classification [16]. Other methods employ tagging and matching specified event patterns to perform large-scale event extraction; redundancy is reduced by automatically generating rulesets for event merging [1]. While these NLP-based methods often obtain high-quality results, their dependency on parsing, user-defined patterns, and annotated data reduces effectiveness across multiple sources. While these methods may show acceptable performance in a closed-domain such as when the types of events are known before-hand, they suffer in an open-domain scenario.
In the data mining literature, a variety of methods have been introduced for extracting underlying events from news corpora. Using a probabilistic model that incorporates both content, time, and location information, Li et al. develop a unified generative model where, for each article, a single latent event generates observable event descriptors such as location, people, keywords and timestamps [11]. This HISCOVERY framework first applies NLP entity recognition tools to extract persons, locations, and dates/times, then uses this data in its generative model. However, it makes the strong assumption that each news article references a single event, a requirement we relax in our probabilistic model. Other works have purely focused on extending topic models for identifying phrases, topical hierarchies, and entities in news corpora [7, 21].
Other approaches in the data mining literature apply clustering and document relevancy measures to organize documents into coherent events. These method often employ heuristic clustering approaches based on intra-cluster similarity to agglomeratively form event clusters. Naughton et al. annotate sentences with event labels then aggregate these sentences into a structured form and create coherent event summaries [17]. They also apply machine learning to extract event-containing sentences and propose two metrics for event sentence clustering to identify, integrate, and summarize news events from multiple sources [18]. Further clustering approaches agglomeratively merge and prune event clusters to identify discriminative events [25]. Lam et al. cluster documents into events and detect new events by first extracting discriminative “concept terms”, named entities, and other identifying information and using these features, cluster documents into existing and new events [8]. These clustering approaches are document-level event analysis, defining an event as a collection of topically related article. These works are not suitable for fine-grained event analysis.
VI Conclusions
In this study, we address the problem of, given large, noisy comparable news corpora, extracting events, their identifying attributes along with interpretable descriptors. We design a novel event mining framework to integrate phrases, named entities, and time expressions to construct then cluster proximity networks to identify these hidden events. A key aspect of our approach involves utilizing proximity of information consistently found in corpus in order to model and propagate event information. By evaluating our approach on three news corpora with different topical contents, we validate our ability to generate concise, accurate, and interpretable key descriptors and attributes consistently beating the comparable baselines.
VII Acknowledgements
Research was sponsored in part by U.S. Army Research Lab. under Cooperative Agreement No. W911NF-09-2-0053 (NSCTA), DARPA under Agreements No. W911NF-17-C-0099 and FA8750-19-2-1004, National Science Foundation IIS 16-18481, IIS 17-04532, and IIS-17-41317, DTRA HDTRA11810026, and grant 1U54GM114838 awarded by NIGMS through funds provided by the trans-NIH Big Data to Knowledge (BD2K) initiative (www.bd2k.nih.gov). Any opinions, findings, and conclusions or recommendations expressed in this document are those of the author(s) and should not be interpreted as the views of any U.S. Government. The U.S. Government is authorized to reproduce and distribute reprints for Government purposes notwithstanding any copyright notation hereon.
References
- [1] Chinatsu Aone and Mila Ramos-Santacruz. Rees: a large-scale relation and event extraction system. In ANLC. ACL, 2000.
- [2] Mona Baker. Corpora in translation studies: An overview and some suggestions for future research. Target, pages 223–243, 1995.
- [3] Krisztian Balog, Leif Azzopardi, and Maarten de Rijke. A language modeling framework for expert finding. Information Processing & Management, 45(1):1–19, 2009.
- [4] David M Blei, Andrew Y Ng, and Michael I Jordan. Latent dirichlet allocation. JMLR, 3:993–1022, 2003.
- [5] Ahmed El-Kishky, Yanglei Song, Chi Wang, Clare Voss, and Jiawei Han. Scalable topical phrase mining from text corpora. VLDB, 8(3), 2014.
- [6] Joseph L Fleiss. Measuring nominal scale agreement among many raters. Psychological bulletin, page 378, 1971.
- [7] Jiawei Han, Chi Wang, and Ahmed El-Kishky. Bringing structure to text: mining phrases, entities, topics, and hierarchies. In SIGKDD, pages 1968–1968. ACM, 2014.
- [8] Wai Lam, HML Meng, KL Wong, and JCH Yen. Using contextual analysis for news event detection. IJIS, 16(4):525–546, 2001.
- [9] Jure Leskovec, Lars Backstrom, and Jon Kleinberg. Meme-tracking and the dynamics of the news cycle. In KDD. ACM, 2009.
- [10] Rui Li, Kin Hou Lei, Ravi Khadiwala, and KC-C Chang. Tedas: A twitter-based event detection and analysis system. In ICDE. IEEE, 2012.
- [11] Zhiwei Li, Bin Wang, Mingjing Li, and Wei-Ying Ma. A probabilistic model for retrospective news event detection. In SIGIR. ACM, 2005.
- [12] Jialu Liu, Jingbo Shang, Chi Wang, Xiang Ren, and Jiawei Han. Mining quality phrases from massive text corpora. In SIGMOD, 2015.
- [13] Yuanhua Lv and ChengXiang Zhai. Positional language models for information retrieval. In SIGIR. ACM, 2009.
- [14] David McClosky, Mihai Surdeanu, and Christopher D Manning. Event extraction as dependency parsing. In ACL-HLT. ACL, 2011.
- [15] Qiaozhu Mei, Chao Liu, Hang Su, and ChengXiang Zhai. A probabilistic approach to spatiotemporal theme pattern mining on weblogs. In WWW. ACM, 2006.
- [16] Makoto Miwa, Rune Sætre, Jin-Dong Kim, and Jun’ichi Tsujii. Event extraction with complex event classification using rich features. Journal of bioinformatics and computational biology, 8(01):131–146, 2010.
- [17] Martina Naughton, Nicholas Kushmerick, and Joe Carthy. Clustering sentences for discovering events in news articles. In Advances in Information Retrieval, pages 535–538. Springer, 2006.
- [18] Martina Naughton, Nicholas Kushmerick, and Joseph Carthy. Event extraction from heterogeneous news sources. In Event Extraction and Synthesis, 2006.
- [19] Desislava Petkova and W Bruce Croft. Proximity-based document representation for named entity retrieval. In CIKM. ACM, 2007.
- [20] James Pustejovsky, José M Castano, Robert Ingria, Roser Sauri, Robert J Gaizauskas, Andrea Setzer, Graham Katz, and Dragomir R Radev. Timeml: Robust specification of event and temporal expressions in text. New directions in question answering, 3:28–34, 2003.
- [21] Xiang Ren, Ahmed El-Kishky, Heng Ji, and Jiawei Han. Automatic entity recognition and typing in massive text data. In SIGMOD, pages 2235–2239. ACM, 2016.
- [22] Xiang Ren, Ahmed El-Kishky, Chi Wang, and Jiawei Han. Automatic entity recognition and typing in massive text corpora. In WWW, pages 1025–1028, 2016.
- [23] Alan Ritter, Oren Etzioni, Sam Clark, et al. Open domain event extraction from twitter. In KDD. ACM, 2012.
- [24] Takeshi Sakaki, Makoto Okazaki, and Yutaka Matsuo. Earthquake shakes twitter users: real-time event detection by social sensors. In WWW. ACM, 2010.
- [25] Hassan Sayyadi, Alireza Sahraei, and Hassan Abolhassani. Event detection from news articles. In Advances in Computer Science and Engineering, pages 981–984. Springer, 2009.
- [26] Gideon Schwarz et al. Estimating the dimension of a model. The annals of statistics, 6(2):461–464, 1978.
- [27] Robert J Serfling. Some elementary results on poisson approximation in a sequence of bernoulli trials. Siam review, 20(3):567–579, 1978.
- [28] Madhusudana Shashanka, Bhiksha Raj, and Paris Smaragdis. Sparse overcomplete latent variable decomposition of counts data. In NIPS, 2008.
- [29] Caroline Suen, Sandy Huang, Chantat Eksombatchai, Rok Sosic, and Jure Leskovec. Nifty: a system for large scale information flow tracking and clustering. In WWW. ACM, 2013.
- [30] Fangbo Tao, George Brova, Jiawei Han, Heng Ji, Chi Wang, Brandon Norick, Ahmed El-Kishky, Jialu Liu, Xiang Ren, and Yizhou Sun. Newsnetexplorer: automatic construction and exploration of news information networks. In SIGMOD, pages 1091–1094. ACM, 2014.
- [31] Earl J Wagner, Jiahui Liu, Larry Birnbaum, and Kenneth D Forbus. Rich interfaces for reading news on the web. In IUI. ACM, 2009.
- [32] Chi Wang, Marina Danilevsky, Nihit Desai, Yinan Zhang, Phuong Nguyen, Thrivikrama Taula, and Jiawei Han. A phrase mining framework for recursive construction of a topical hierarchy. In KDD. ACM, 2013.
- [33] Justin Washtell. Co-dispersion: A windowless approach to lexical association. In EACL. ACL, 2009.
- [34] Justin Washtell and Katja Markert. A comparison of windowless and window-based computational association measures as predictors of syntagmatic human associations. In EMNLP. ACL, 2009.
- [35] Jiashu Zhao, Jimmy Xiangji Huang, and Ben He. Crter: using cross terms to enhance probabilistic information retrieval. In SIGIR. ACM, 2011.
- [36] JIA Zi-Yan, He Qing, ZHANG Hai-Jun, L Jia-You, and S Zhong-Zhi. A news event detection and tracking algorithm based on dynamic evolution model. Journal of Computer Research and Development, 2004.