Subaru FOCAS IFU observations of two 0.12 strong-lensing elliptical galaxies from SDSS MaNGA††thanks: Based on data collected at Subaru Telescope, which is operated by the National Astronomical Observatory of Japan.
Abstract
We present new observations of two = 0.12 strong-lensing elliptical galaxies, originally discovered from the SDSS-IV MaNGA survey, using the new FOCAS IFU spectrograph on the Subaru Telescope. For J1436+4943, our observations confirm the identification of this system as a multiple-image lens, in a cusp configuration, with Einstein radius = 2.0 arcsec. For J1701+3722, the improved data confirm earlier hints of a complex source plane, with different configurations evident in different emission lines. The new observations reveal a previously unseen inner counter-image to the [O iii] arc found from MaNGA, leading to a smaller revised Einstein radius of = 1.6 arcsec. The inferred projected masses within the Einstein apertures (3.7–4.7 kpc) are consistent with being dominated by stars with an initial mass function (IMF) similar to that of the Milky Way, and a dark matter contribution of 35 per cent as supported from cosmological simulations. These results are consistent with ‘pure lensing’ analyses of lower-redshift lenses, but contrast with claims for heavier IMFs from combined lensing-and-dynamical studies of more distant early-type galaxies.
keywords:
gravitational lensing: strong – galaxies: elliptical and lenticular, cD1 Introduction
Strong gravitational lensing is a key tool for measuring extragalactic masses and probing the distribution of dark and luminous matter in galaxies (e.g. Treu, 2010). Analysing a sample of 0.2 strong-lensing elliptical galaxies, Treu et al. (2010) found that their velocity dispersions and projected lensing masses could only be reconciled with a universal dark matter profile if the stellar mass-to-light ratio, , was larger than expected for an initial mass function (IMF) like that in the Milky Way (e.g. Kroupa, 2001). By contrast, for the few known nearby ( = 0.03–0.07) strong lenses, lensing alone constrains to be close to the value expected from the Kroupa IMF (Collier et al., 2018). In these low-redshift systems, the arcs are formed at smaller physical radius, minimising the contributions from dark matter, which obviates the need for dynamical information to separate dark and stellar components. One possible resolution of the tension between the above results, discussed by Sonnenfeld et al. (2019), is that steep inner gradients in may inflate the central velocity dispersion, causing the combined lensing-and-dynamics analysis to assign too much mass to the stellar component and too little to the dark halo.
Establishing well-constrained lenses at intermediate distances should help to solve the apparent discrepancy between the nearby and distant samples. Smith, Lucey & Conroy (2015) presented the first use of Integral Field Unit (IFU) spectroscopy as a tool to discover lensed line-emitting sources behind bright foreground galaxies. This method, applied to individually targeted lens candidates, has also been adapted to the VLT MUSE spectrograph (Smith et al., 2015; Collier et al., 2018, and in preparation). A complementary approach is to exploit data from large multi-IFU surveys. The SDSS-IV MaNGA survey (Bundy et al., 2015) is acquiring IFU observations for thousands of nearby galaxies, including hundreds of massive ellipticals, which are the most effective gravitational lenses.
Two groups have searched the MaNGA data cubes for lens systems. Smith (2017) (and unpublished extensions) conducted a semi-automated search in MaNGA data releases DR13–DR15, restricted to 600 galaxies with velocity dispersion 200 km s-1, which dominate the total strong-lensing cross section. Independently, Talbot et al. (2018) searched all datacubes in DR13–DR14 with a fully-automated source detection method. Smith (2017) reported discovery of a lensed source behind J1701+3722, apparently showing a near-complete Einstein ring in [O ii], but only a single ‘arc’ in [O iii]. He estimated an Einstein radius of 2.3 arcsec, but noted that this is uncomfortably large compared to the measured velocity dispersion. The Talbot et al. (2018) search yielded seven new apparent multiple-imaging systems as well as confirming identification of J1701+3722. In a subsequent re-analysis of the data, we could not convincingly reproduce many of these systems (see discussion in Smith et al., 2018), but J1436+4943, which was missed in Smith’s visual search, is a compelling candidate for further study.
In this Letter, we present follow-up observations of J1436+4943 and J1701+3722, obtained with the new IFU mode of the FOCAS spectrograph at the Subaru telescope (Section 2). The new observations have much higher spatial resolution than the MaNGA discovery data, and also higher spectral resolution, enabling a more detailed reanalysis of the two lenses (Sections 3–4). Combining the measured Einstein radii with photometry and estimates for the dark matter contributions and likely stellar ages, we derive results on the total and stellar mass-to-light ratios, and constraints on the IMF through the mass-excess factor (Section 5). The work is briefly summarized in Section 6.
We adopt the cosmological parameters from Planck Collaboration et al. (2018).
2 Subaru FOCAS IFU observations
We observed J1436+4943 and J1701+3722 using the Subaru FOCAS IFU during its first night of scientific operations, on 2019 June 26. The design and characteristics of the IFU are fully described by Ozaki et al. (2014, and in preparation). Briefly, the unit is an image slicer which reformats a 10.113.5 arcsec2 field-of-view into 23 slices of width 0.44 arcsec, sampled with 0.2 arcsec pixels; the IFU feeds the existing FOCAS spectrograph (Kashikawa et al., 2002). We observed with the VPH900 grism, providing a wavelength coverage of 7600–10600 Å over most of the field-of-view, with spectral resolution 2800–3300, sampled at 0.74 Å pix-1 in wavelength.
For J1436+4943 we acquired six dithered exposures totalling 2943 sec integration, while for J1701+3722 a single 900 sec exposure was obtained. The seeing was 0.75 arcsec FWHM for J1436+4943, and 0.5 arcsec for J1701+3722 (estimated from focus-sequence images of a star taken close to the observation time). Especially for J1701+3722, the PSF is thus severely under-sampled in the across-slice dimension (R.A.).
The data were reduced using the observatory pipeline software. The wavelength calibration solution was obtained from the science frames themselves, using the numerous night-sky emission lines as a simultaneous reference source.
3 SDSSJ 143607.49+494313.2
The J1436+4943 system was first identified as a possible multiple-imaging system by Talbot et al. (2018). The foreground galaxy is an elliptical at redshift = 0.125, with velocity dispersion = 28210 km s -1 from the single-fibre SDSS spectrum (Abazajian et al., 2009). MaNGA revealed background [O ii] emission at = 1.231, apparently forming two separate arcs east and west of the target galaxy (Talbot et al., 2018).
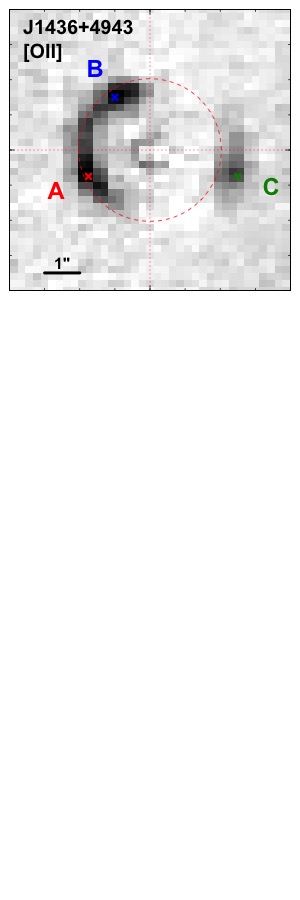
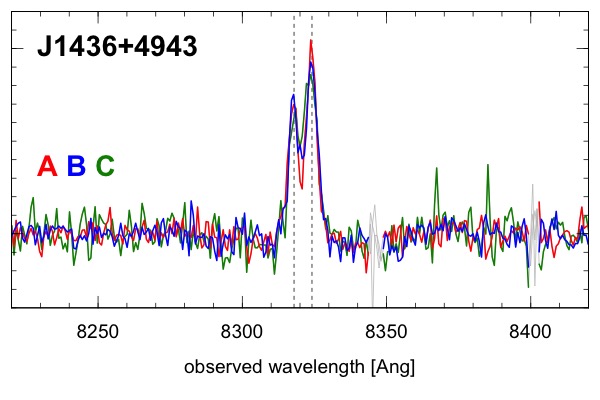
Figure 1 shows the net [O ii] emission line image for the source, from the Subaru data. The lens light has been subtracted using the neighbouring continuum, and a correction has been made to remove a radial trend in the net image (caused by gradients in spectral features in the lens galaxy). The [O ii] image confirms the presence of an extended arc (labelled A and B) to the east, and a western counter-image (C), suggesting a cusp lens configuration. Figure 2 shows the [O ii] doublet in the spectra for the three labelled regions.
To derive the Einstein radius, we have fitted simple lensing models to the net [O ii] image using PyAutoLens (Nightingale et al., 2018a, b). The source galaxy is parameterized with an elliptical Sérsic profile, while the lens is treated as a singular isothermal ellipsoid (SIE), with centre, ellipticity and position angle fixed to those of the lens galaxy light. Fitting for the lens normalisation, we obtain = 2.020.02 arcsec; allowing a free external shear term does not affect the fit. Fitting with a pixelised source, we find = 2.080.04 with no shear, or 2.050.03 with a 32% shear. The reconstructed source is compact and unstructured in each case. For the calculations in Section 5, we adopt = 2.030.04, averaging the results from pixelised and parametric models with shear, with the error reflecting the variation between models.
4 SDSSJ 170124.01+372258.1
J1701+3722 was identified as a multiple-image lens by Smith (2017), and also recovered in the Talbot et al. (2018) search. The foreground galaxy is an elliptical at redshift = 0.122, with velocity dispersion = 2588 km s -1 from the single-fibre SDSS spectrum. MaNGA detected [O ii], [O iii], and H emission lines from a background source at = 0.791.
As discussed by Smith (2017), the MaNGA data for J1701+3722 posed two puzzles. First, although the system exhibited a near-complete Einstein ring in the [O ii] and H lines, only a single south-eastern ‘arc’ was visible in [O iii]. Secondly, the estimated Einstein radius of = 2.3 arcsec derived from the [O ii] ring was substantially larger than the 1.5 arcsec predicted for an isothermal profile matching the stellar velocity dispersion.
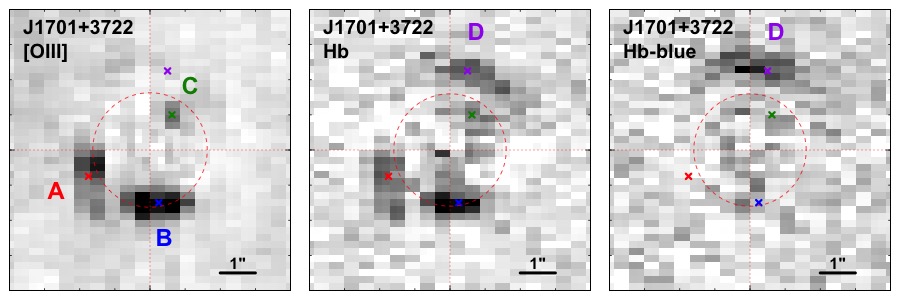
Figure 3 (left) shows the net emission-line image for the background [O iii] 5007 Å line. The south-eastern arc identified from MaNGA is resolved by FOCAS into two distinct sections, labelled A and B, at 1.8 arcsec from the lens centre. Additionally, a probable faint counter-image, C, is now visible at smaller radius, 1.1 arcsec. Turning to the H line, Figure 3 (centre) shows that features A, B and (marginally) C are all detected, but the situation is complicated by an additional arc, D, at radius 2.4 arcsec, which is very faint in the [O iii] image. This feature clearly corresponds to the northern arc seen in H and [O ii] in MaNGA. Note that the [O ii] doublet falls shortwards of our spectral coverage with FOCAS.
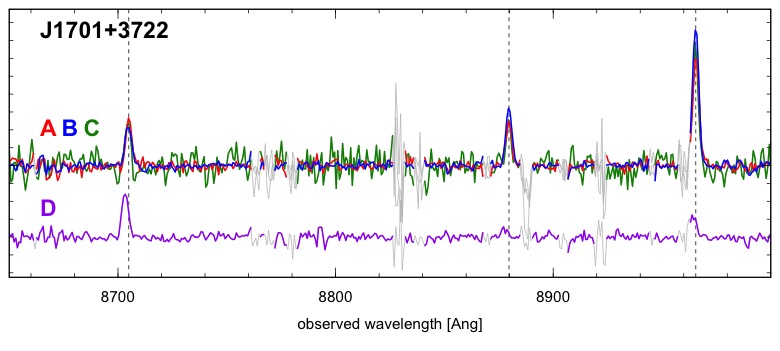
Figure 4 shows spectra from the regions discussed. The spectrum of the putative counter-image C is indistinguishable from those of A and B (similar line ratios and 20 km s-1 velocity difference), supporting the origin of all three in a single source. The spectrum of arc D, however, not only exhibits the very different [O iii]-to-H ratio already seen in the images, but is also offset to lower velocity, by 6010 km s-1. Clearly D does not originate from the same part of the source plane as A, B and C; it is presumably a neighbouring galaxy (at separation 7 kpc, for the lens model derived below). In Figure 3 (right), we exploit the velocity offset by selecting a slightly bluer and narrower wavelength interval, to isolate arc D. (The image position shifts, indicating a velocity gradient along this arc.) Given the Einstein radius of the lens derived in the following section, we should expect a counter-image to D, at a radius of 0.7 arcsec, but we cannot confidently identify such a feature in the present data.
Even after excluding the contaminating H source, it is difficult to fit our data for J1701+3722 using pixelised lensing models. Specifically, we find that the optimization always favours slightly improving the fit to arcs A and B, at the expense of not producing any counter-image at C. This is not a failing of the modelling method, but reflects the limitations of our data for this system, e.g. under-sampled PSF and strongly correlated pixels (after rebinning onto square pixels), due to the lack of dithered pointings.
We proceed on the assumption that C is genuinely a counter-image to A and B, and crudely enforce this ‘qualitative’ aspect of the model by artificially reducing the noise map values around C, to assign it greater weight. With this approach, we obtain acceptable fits to a SIE with geometry (centre, axis ratio and position angle) fixed to the lens light, and a sizeable shear of amplitude 12 per cent (representing angular structure in the mass not captured in the SIE, and/or external perturbations). For a pixelised source, we obtain = 1.620.01 arcsec. Fitting with a parameterized Sersic source yields = 1.640.01 arcsec. We adopt the average of these values in Section 5. However, to reflect the greater systematic uncertainty in modelling J1701+3722, we impose a 10 per cent error on ; deeper and (especially) cleaner data are still required for this lens.
5 Mass-to-light ratios
Here we derive estimates of the total mass-to-light ratio within the Einstein radius, , for each lens, and (with assumptions for the dark-matter contribution, and the galaxy age) the stellar mass-to-light ratio, , and the IMF mass-excess factor, .
The first part of Table 1 details the observed parameters used in the calculations, i.e. the lens and source redshifts, the Einstein radius and the Einstein-aperture magnitudes in the band, as measured from the SDSS imaging. For reference, we also note the effective radius and velocity dispersion. We have applied corrections of 0.1 mag for the 1 arcsec SDSS PSF, derived from fits with galfit (Peng et al., 2010). The second part of the table reports the projected Einstein radius in kpc, and the corresponding projected mass () and luminosity (). The luminosities assume galactic extinction corrections of 0.04 mag in from Schlafly & Finkbeiner (2011), a band-shifting correction of 0.09 mag derived using EzGal (Mancone & Gonzalez, 2012), and a solar absolute magnitude of = 4.53 from the same source.
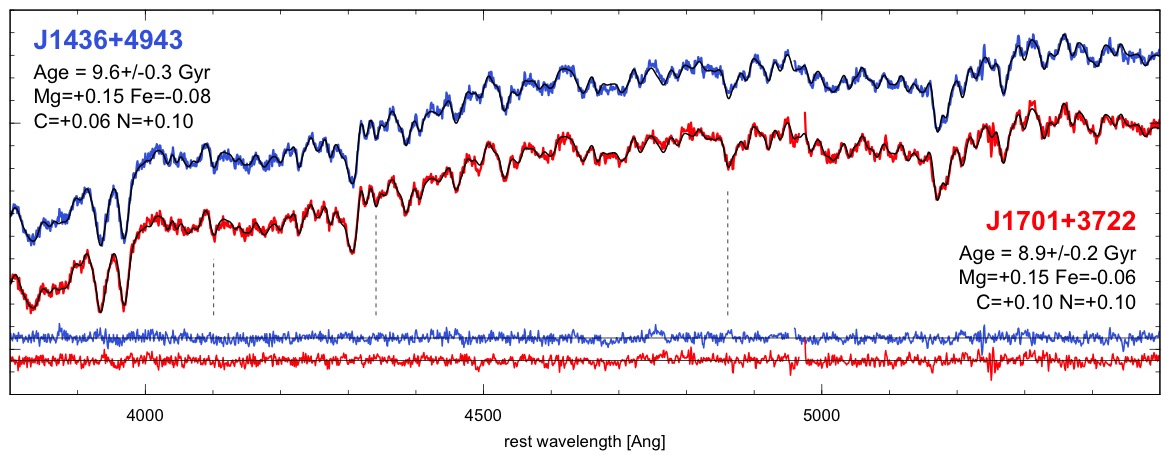
In the third part of Table 1, we compute the total lensing mass-to-light ratio in the Einstein aperture, which includes contributions from dark matter (and in principle from a central black hole, gas, etc but these are expected to be negligible). To compare this with the value expected from the stars alone, , we used EzGal to derive the latter for stellar population models from Conroy, Gunn & White (2009), for metallicities 1.0–1.5 the solar value and ages 8–12 Gyr (corresponding to formation redshift 1.5). The full range in spanned by these models is 2.41–3.46; our calculations adopt this as the 2 interval, i.e. we assume = 2.930.26. These assumptions are supported by fits of single-burst models from Conroy & van Dokkum (2012) to the Einstein-aperture spectra from MaNGA, which favour ages 9–10 Gyr for both galaxies (Figure 5). If all of the lensing mass is attributed to stars, the derived maximum IMF mass factor = , is intermediate between the values of = 1.0 for a Kroupa IMF and 1.65 for an unbroken power-law IMF with the Salpeter (1955) slope.
The final part of Table 1 records the correction for dark matter, and its effect on the derived stellar mass-to-light ratio, . The corrections are based on the scheme described in Smith et al. (2015), which uses the projected dark-matter profiles in the EAGLE cosmological simulation, for halos hosting galaxies with 250 km s-1 (Schaller et al., 2015). The estimated contributions are 356 per cent of for the MaNGA systems, roughly twice the fraction obtained for the much closer Smith et al. lenses. (The error here derives from the scatter among halos in the simulation.) After subtracting the halo contribution, we arrive at values for the stellar mass-to-light ratio and the IMF mass-excess factor = ) =. For J1436+4943, the resulting is consistent with unity, i.e. the lensing mass is compatible with a Kroupa IMF and the dark matter expected from EAGLE. For J1701+3722, the derived result is lighter than the Kroupa IMF prediction. Heavier-than-Salpeter IMFs are excluded at the 4 level.
Our estimates are subject to the usual systematic uncertainties affecting this method. For example, using Maraston (2005) models for would increase by 12 per cent; adopting the Bennett et al. (2014) cosmological parameters would increase by 3.5 per cent. The recovered anti-correlates with the adopted stellar population age; however, consistency with a Salpeter IMF ( 1.6) would require ages 4–5 Gyr, which are excluded by the weakness of the H and H absorption lines.
Although the IMF constraints for the two galaxies studied here are similar to those obtained from lower-redshift lenses (Newman et al., 2017; Collier et al., 2018), we stress that the current results apply at larger radius (3.7–4.7 kpc, compared to 2 kpc), and are more dependent on the accuracy of the dark-matter correction.
| quantity | unit | J1436+4943 | J1701+3722 |
|---|---|---|---|
| 0.125 | 0.122 | ||
| 1.231 | 0.791 | ||
| arcsec | 2.030.04 | 1.630.16 | |
| ABmag | 16.620.02 | 16.760.07 | |
| ABmag | 16.510.02 | 16.660.07 | |
| km s-1 | 28210 | 2588 | |
| arcsec | 3.78 | 4.30 | |
| kpc | 4.720.09 | 3.710.37 | |
| 28.21.1 | 18.83.7 | ||
| 6.720.10 | 5.560.35 | ||
| 4.190.10 | 3.380.46 | ||
| 2.930.26 | 2.930.26 | ||
| 1.430.14 | 1.160.19 | ||
| 9.61.8 | 6.61.6 | ||
| 2.760.27 | 2.200.41 | ||
| 0.940.13 | 0.750.16 |
6 Summary
We have presented Subaru observations of two = 0.12 strong lenses originally identified from the SDSS-IV MaNGA survey. For each of these systems, the increased signal-to-noise and resolution greatly improve on the previous data. We have definitively established J1436+4943 as a multiple-image lens, with a secure Einstein radius. For J1701+3722, we have confirmed that two background sources are present, as suspected from MaNGA, and removed the contamination from the second source to derive a new lensing model which is more consistent with the velocity dispersion.
After correction for the dark-matter contributions expected from cosmological simulations, the lensing-derived stellar mass-to-light ratios for the two galaxies are consistent with (or even lighter than) a Kroupa (2001) IMF like that in the Milky Way. At face value, this = 0.12 application of ‘pure lensing’ (without dynamical information) supports the ‘lightweight’ IMFs derived from lenses at = 0.03–0.07 (Newman et al., 2017; Collier et al., 2018), albeit at a larger physical radius, and with a greater reliance on the correctness of our estimated dark-matter contributions.
The observations described here demonstrate the suitability of the FOCAS IFU for galaxy-scale lensing science. The MaNGA systems were observed as validation targets during a Subaru search for low-redshift strong-lensing ellipticals; the results of the search programme will be presented in a future paper.
Acknowledgements
RJS and JRL were supported by the Science and Technology Facilities Council through the Durham Astronomy Consolidated Grant 2017–2020 (ST/P000541/1); RJS also acknowledges travel funding from PATT Linked Grant 2019–2020 (ST/S001557/1). WPC was supported by a STFC studentship (ST/N50404X/1). We are grateful to Kentaro Aoki, Takashi Hattori and Marita Morris for supporting our observations during the first science run with the FOCAS IFU. We thank James Nightingale for helpful discussions about lens modelling with PyAutolens.
Funding for the Sloan Digital Sky Survey IV has been provided by the Alfred P. Sloan Foundation, the U.S. Department of Energy Office of Science, and the Participating Institutions. SDSS-IV acknowledges support and resources from the Center for High-Performance Computing at the University of Utah. The SDSS web site is www.sdss.org. SDSS-IV is managed by the Astrophysical Research Consortium for the Participating Institutions of the SDSS Collaboration including the Brazilian Participation Group, the Carnegie Institution for Science, Carnegie Mellon University, the Chilean Participation Group, the French Participation Group, Harvard-Smithsonian Center for Astrophysics, Instituto de Astrofísica de Canarias, The Johns Hopkins University, Kavli Institute for the Physics and Mathematics of the Universe (IPMU) / University of Tokyo, the Korean Participation Group, Lawrence Berkeley National Laboratory, Leibniz Institut für Astrophysik Potsdam (AIP), Max-Planck-Institut für Astronomie (MPIA Heidelberg), Max-Planck-Institut für Astrophysik (MPA Garching), Max-Planck-Institut für Extraterrestrische Physik (MPE), National Astronomical Observatories of China, New Mexico State University, New York University, University of Notre Dame, Observatário Nacional / MCTI, The Ohio State University, Pennsylvania State University, Shanghai Astronomical Observatory, United Kingdom Participation Group, Universidad Nacional Autónoma de México, University of Arizona, University of Colorado Boulder, University of Oxford, University of Portsmouth, University of Utah, University of Virginia, University of Washington, University of Wisconsin, Vanderbilt University, and Yale University.
References
- Abazajian et al. (2009) Abazajian K. N., et al., 2009, ApJS, 182, 543
- Bennett et al. (2014) Bennett C. L., Larson D., Weiland J. L., Hinshaw G., 2014, ApJ, 794, 135
- Bundy et al. (2015) Bundy K., et al., 2015, ApJ, 798, 7
- Collier et al. (2018) Collier W. P., Smith R. J., Lucey J. R., 2018, MNRAS, 478, 1595
- Conroy & van Dokkum (2012) Conroy C., van Dokkum P., 2012, ApJ, 747, 69
- Conroy et al. (2009) Conroy C., Gunn J. E., White M., 2009, ApJ, 699, 486
- Kashikawa et al. (2002) Kashikawa N., et al., 2002, PASJ, 54, 819
- Kroupa (2001) Kroupa P., 2001, MNRAS, 322, 231
- Mancone & Gonzalez (2012) Mancone C. L., Gonzalez A. H., 2012, PASP, 124, 606
- Maraston (2005) Maraston C., 2005, MNRAS, 362, 799
- Newman et al. (2017) Newman A. B., Smith R. J., Conroy C., Villaume A., van Dokkum P., 2017, ApJ, 845, 157
- Nightingale et al. (2018a) Nightingale J. W., Hayes R., Dye S., Massey R. J., Frenk C. S., 2018a, PyAutoLens: Strong lens modeling (ascl:1807.003)
- Nightingale et al. (2018b) Nightingale J. W., Dye S., Massey R. J., 2018b, MNRAS, 478, 4738
- Ozaki et al. (2014) Ozaki S., et al., 2014, in Proc. SPIE. p. 915149, doi:10.1117/12.2054838
- Peng et al. (2010) Peng C. Y., Ho L. C., Impey C. D., Rix H.-W., 2010, AJ, 139, 2097
- Planck Collaboration et al. (2018) Planck Collaboration et al., 2018, arXiv e-prints, p. arXiv:1807.06209
- Salpeter (1955) Salpeter E. E., 1955, ApJ, 121, 161
- Schaller et al. (2015) Schaller M., et al., 2015, MNRAS, 451, 1247
- Schlafly & Finkbeiner (2011) Schlafly E. F., Finkbeiner D. P., 2011, ApJ, 737, 103
- Smith (2017) Smith R. J., 2017, MNRAS, 464, L46
- Smith et al. (2015) Smith R. J., Lucey J. R., Conroy C., 2015, MNRAS, 449, 3441
- Smith et al. (2018) Smith R. J., Lucey J. R., Collier W. P., 2018, MNRAS, 481, 2115
- Sonnenfeld et al. (2019) Sonnenfeld A., Jaelani A. T., Chan J., More A., Suyu S. H., Wong K. C., Oguri M., Lee C.-H., 2019, A&A, 630, A71
- Talbot et al. (2018) Talbot M. S., et al., 2018, MNRAS, 477, 195
- Treu (2010) Treu T., 2010, ARA&A, 48, 87
- Treu et al. (2010) Treu T., Auger M. W., Koopmans L. V. E., Gavazzi R., Marshall P. J., Bolton A. S., 2010, ApJ, 709, 1195