Energy gap closure of crystalline molecular hydrogen with pressure
Abstract
We study the gap closure with pressure of crystalline molecular hydrogen. The gaps are obtained from grand-canonical Quantum Monte Carlo methods properly extended to quantum and thermal crystals, simulated by Coupled Electron Ion Monte Carlo. Nuclear zero point effects cause a large reduction in the gap (). Depending on the structure, the fundamental indirect gap closes between 380GPa and 530GPa for ideal crystals and 330-380GPa for quantum crystals. Beyond this pressure the system enters into a bad metal phase where the density of states at the Fermi level increases with pressure up to 450-500 GPa when the direct gap closes. Our work partially supports the interpretation of recent experiments in high pressure hydrogen.
The metallization of crystalline hydrogen under pressure has attracted considerable attention over the last century. Predicted to be stable in an atomic bcc lattice around 25GPa, the mechanism for molecular dissociation was first discussed by Wigner and Huntington Wigner and Huntington (1935). The search for its metallization has driven high pressure research until the recent Dias and Silvera (2017), still debated Goncharov and Struzhkin (2017); Loubeyre et al. (2017); Liu et al. (2017); Silvera and Dias (2017), observation of reflective samples at 495GPa in a Diamond Anvil Cell (DAC) apparatus. Even though it is the simplest element and H2 the simplest homonuclear molecule in nature, the study of hydrogen under extreme conditions has uncovered rich and unexpected physics Mao and Hemley (1994); McMahon et al. (2012); Nellis (2006).
The mechanism by which the insulating crystal transforms into a conducting crystal is still unclear. Experiments have difficulty in determining the crystalline structure and its evolution with pressure because of the low cross section to X-rays Loubeyre et al. (1996); Ji et al. (2019); Dubrovinsky et al. (2019) and the small volume of the samples for neutron scattering. Structural information are obtained indirectly through vibrational spectroscopy while electronic structure is probed by optical measurements Silvera and Dias (2018). Direct measurements of static conductivity in the DAC remain inconclusive Eremets and Troyan (2011); Nellis et al. (2012); Goncharov and Struzhkin (2012); Goncharov et al. (2013); Eremets et al. (2016, 2017). A complex phase diagram comprising up to at least four different molecular phases (from I to IV) with different vibrational spectra has been traced experimentally McMahon et al. (2012). Recent experiments Dias et al. (2016); Dias and Silvera (2017); Eremets et al. (2017); Loubeyre et al. (2020); Dias et al. (2019) searched for metallization at low temperature ( 100K) while raising pressure in phase III. Considerable attention has also been paid to the higher temperature phase IV since its discovery Eremets and Troyan (2011); Howie et al. (2012a, b); Zha et al. (2012); Loubeyre et al. (2013); Howie et al. (2015). The emerging picture is that the transparent insulating molecular phase III transforms into a strongly absorbing (in the visible) molecular phase at 350-360GPa with different IR frequencies, first named phase VEremets et al. (2016) and later -PRE or phase VI Silvera and Dias (2018); Dias et al. (2019), with semiconducting characteristics Eremets et al. (2019). Hydrogen finally reaches a metallic phase with the observation of reflective samples at 495GPaDias and Silvera (2017), although disagreement concerning the pressure scale still remains Eremets and Drozdov (2016); Loubeyre et al. (2017); Silvera and Dias (2018). New synchrotron infrared spectroscopy measurements Loubeyre et al. (2020) report a reversible collapse of the IR transmission spectrum at 427GPa, interpreted as a first order transition to the metallic state, an interpretation criticised in Silvera and Dias (2019).
In this paper we investigate the closure of the electronic gap of candidate structures for phase III (Cmca-12 and C2/c-24) and phase IV (Pc48)Pickard and Needs (2007); Pickard et al. (2012a) within a Quantum Monte Carlo (QMC) framework Yang et al. (2020). For ideal structures, the fundamental gap decreases with pressure from 3-3.5 eV at 250GPa to a vanishing value 380GPa in the Cmca12 structure and 530GPa in the C2/c-24 structure. Using Coupled Electron-Ion Monte Carlo (CEIMC) calculations, we then include Zero Point Motion (ZPM) and finite temperature effects of the nuclei within a first principles, non-perturbative Path Integral approach. Extending the grand canonical method Yang et al. (2020) to quantum crystal at finite temperature, we observe a strong gap reduction of 2eV due to nuclear quantum effects (NQE) while temperature effects below 300K are minor. At 200K the fundamental indirect gap closes 330GPa for Cmca-12 and 380GPa for C2/c-24. Raising the temperature of C2/c-24 to 290K reduces the closure pressure to 340GPa while decreasing it to 100K does not give any noticeable effect. For both structures the direct gap, as obtained by unfolding of the supercell bands see Supplementary Material , remains open up to 470-500GPa. Values for the C2/c-24 structure are in agreement with recent experimental data Loubeyre et al. (2020), although we cannot discuss the experimentally observed sudden closure at 427GPa. Our new method for calculating energy gaps allows us to benchmark DFT functionals not only for thermodynamics and structural properties, but also for excitation energies, important for predicting optical properties.
Method. The primary information for theoretical investigations of solids are the crystalline structures. Candidates structures for high pressure phases have been obtained by ab initio Random Structural Search methods Pickard and Needs (2007); Pickard et al. (2012a, b); Monserrat et al. (2018). For phase III we consider C2/c-24 and Cmca-12, which are among the lowest free energy structures in ground state QMC calculations assuming harmonic phonons corrections (with DFT-PBE) McMinis et al. (2015); Azadi et al. (2014). For Phase IV we consider only Pc48, since the recently proposed Pca21 structure Monserrat et al. (2018) is found to be rather similar to Pc48 after geometry relaxation.We first consider ideal crystal structures (protons fixed at lattice sites) relaxed at constant pressure with the DFT-vdW-DF functional. Quantum crystals, with protons represented by path integrals at finite temperature, are addressed with CEIMC at constant volume111We have checked that the stress tensor in the constant volume CEIMC run remains diagonal with same diagonal elements within our statistical noise.. All systems considered have 96 protons in nearly cubic supercells. Optimized Slater-Jastrow-Backflow trial wave functions have been used for the CEIMC calculations Pierleoni et al. (2016); details of the CEIMC simulations are reported in Ref.Rillo et al. (2018). Averages over ionic positions for gaps are obtained using 40 statistically independent configurations from the CEIMC trajectories.
For a given fixed nuclear configuration, the fundamental energy gap is obtained by considering systems with a variable number of electrons where . For each system we perform Reptation Quantum Monte Carlo (RQMC) calculations with imaginary-time projection 2.00 Ha-1 and time step 0.01 Ha-1 for up to Monkhorst-Pack grid of twists. We check that those values are adequate for converging the band gaps within our resolution. The fundamental gap is obtained from grand-canonical twist-averaged boundary conditions (GCTABC) RQMC and corrected for finite size effects in leading and next-to-leading order Yang et al. (2020).
Extending calculations of the fundamental gaps to quantum crystals, the trace over nuclear degrees of freedom must be taken with care. In the semiclassical approximation see Supplementary Material , the fundamental gap is the smallest electronic excitation energy that occurs from quantum or thermal fluctuations of the lattice. Strictly speaking this gap is always closed, since the probability of a proton configuration with a metallic character is never exactly zero. For dense molecular hydrogen phonon energies are eV Pickard et al. (2012a). ZPM dominates for K, so the semi-classical approach is not appropriate. Electronic energies should be averaged over the nuclear configurations according to their thermal distribution. The gap will be given by the minimum of the average excitation energies, always larger than the semiclassical gap. Figure 4 illustrates typical results for the integrated density of states as a function of (electronic) chemical potential. The gap of the quantum crystal can be directly read off from the width of the incompressible region. More details are given in see Supplementary Material .
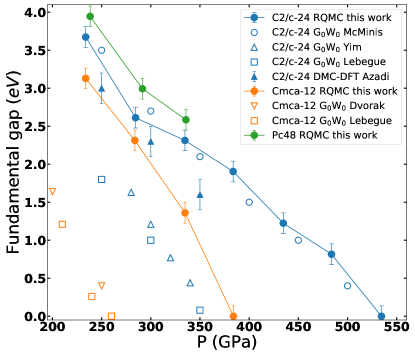
Results. Figure 1 shows estimates of the fundamental gap for ideal crystals versus pressure. The gap decreases with pressure in a similar fashion for all structures: Cmca-12 has the smallest gap, followed by C2/c-24 and by Pc48. We find reasonable agreement with the QMC estimates of Ref. Azadi et al. (2017) 222The observed small difference, in particular at the higher pressure, is probably due to the different XC approximation used for geometry optimization, vdW-DF in our case, BLYP in Ref. Azadi et al. (2017) and different size extrapolation.. References Lebègue et al. (2012); Wai-Leung Yim and Tse (2017); Dvorak et al. (2014) report smaller values of the gap based on GW. We believe this disagreement is primarily due to the lattice geometry that has been optimized at constant pressure with PBE in Refs Lebègue et al. (2012); Wai-Leung Yim and Tse (2017); Dvorak et al. (2014) and with vdW-DF in the present work. It has been previously observed that PBE optimized geometries has longer H2 bonds and smaller gap values at DFT levelMorales et al. (2013); Clay et al. (2014). This propagates into . Indeed, GW results from structures optimized with vdw-DF McMinis et al. (2015) are in excellent agreement with our predictions.
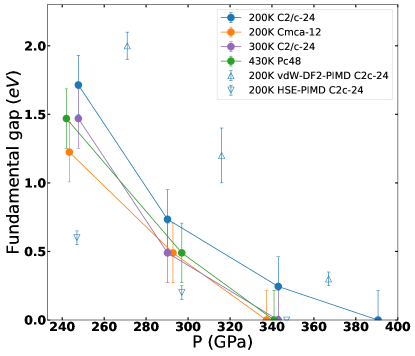
Values of the fundamental gap from GCTABC for quantum crystals at various temperatures and pressures are shown in Fig. 2: they are smaller by 2eV with respect to the ideal crystal. ZPM is almost entirely responsible for this reduction. Note that the gap hardly changes from 300K to 200K within our estimated errors. Similar to ideal crystals, Cmca-12 gap is smaller than C2/c-24 gap at T=200K, the former closing 340GPa while the latter at higher pressures 380GPa. As for the Pc-48 structure at T=430K (phase IV) the gap is slightly below values for C2/c-24 at 200K. Our results show that the electronic gap is fairly independent of the specific crystalline structure of the molecular quantum crystals. We also report gap values for C2/c-24 at T=200K from Path Integral Molecular Dynamics (PIMD)Morales et al. (2013) with two different DFT functionals, namely HSE Heyd et al. (2005) and vdW-DF2 Lee et al. (2010). As vdW-DF2 underestimates the molecular bond lengths of the ideal crystalline structure Clay et al. (2014), its PIMD configurations are expected to bias the electronic gap towards larger values. Our results do not agree with predictions of Ref. Azadi et al. (2018) (not shown) yielding a metallic state for C2/c-24 at 300GPa and 300K, and predict substantially larger gap reduction for C2/c-24 quantum crystals than Ref. Li et al. (2013). However, those works are based on less controlled assumptions such as using “scissor corrected” BLYP band structure and an ad hoc procedure for including nuclear motion.
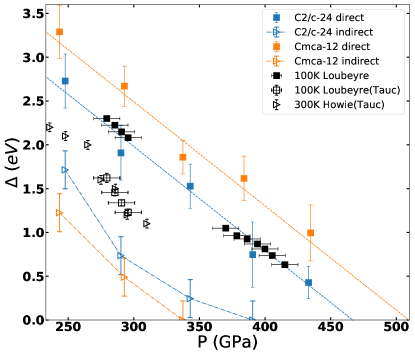
For all structures considered the observed fundamental gap is indirect. Estimate of the direct gap can be obtained by unfolding the band structure of the supercell see Supplementary Material . Fig. 3 shows the direct gap for both C2/c-24 and Cmca-12 structures. While for the indirect gap Cmca-12 is always lower than C2/c-24, the direct gap is systematically larger. The difference between direct and indirect gap is of for C2/c-24, and of for Cmca-12. Closure of the direct gaps, obtained by linear extrapolation, occurs in C2/c-24 and in Cmca-12. Hence for both structures we observe an intermediate pressure region where the fundamental indirect gap is closed but the direct vertical gap remains open and decreases linearly with pressure. In this region, we expect the density of states around the Fermi level to increases progressively with pressure, as qualitatively reported in Ref. Rillo et al. (2018). This indicates the formation of a bad metal with properties similar to a semi-metal upon closure of the indirect gap, a scenario strongly supporting the recently proposed experimental picture Eremets et al. (2019)(see also refs. Silvera and Dias (2018); Dias et al. (2019)). The non-vanishing direct gap naturally explains the reported observation of absorbing (black) hydrogen around 320-360 GPa (depending on the experimental pressure scale) Loubeyre et al. (2002).
Fig. 3 also shows the experimental estimates of both indirect and direct gaps from optical absorption. Measuring indirect gaps is difficult in hydrogen since samples are very thin and the optical signal from phonon-assisted absorption is too low to be detected Goncharov and Struzhkin (2012); Eremets et al. (2017). The indirect gap value has been extracted from a Tauc analysis of the absorption profiles at 300K (Phase IV) Howie et al. (2012b); Goncharov et al. (2013) and 100K (Phase III) Loubeyre et al. (2002); Zha et al. (2012) assuming the low energy absorption spectrum can be reliably extrapolated to zero energy. 333We have re-analyzed the spectra of ref. Loubeyre et al. (2002) to extract the value of the indirect gap from a Tauc plot Tauc et al. (1966), as was performed in ref. Goncharov et al. (2013) for the data from ref. Howie et al. (2012b). Details are given in the see Supplementary Material . Conversely the direct gap at 100K (phase III) has been associated with the absorption edge at lower pressure Loubeyre et al. (2002) or with full absorption at higher pressure Loubeyre et al. (2020) and corresponds roughly to the energy where the absorption coefficient equals 30000cm-1. The direct gap of C2/c-24 structure is in agreement with the experimental data up to 425GPa, where experiments report a collapse of the gap value ascribed to the metallization transitionLoubeyre et al. (2020). Our results do not allow to predict this transition, but rule out C2/c-24 and Cmca-12 for this new metallic phase. 444Our estimates of the direct gap could be biased by due to the discreteness of our twist grid. Correcting for this bias will place the experimental data in between the C2/c-24 and Cmca-12 predictions. For the indirect gap we predict smaller values than in experiments. However, the Tauc analysis of Refs Howie et al. (2012b); Goncharov et al. (2013); Loubeyre et al. (2002) does not consider the energy of the emitted or absorbed phonons, which should be comparable to the observed discrepancy. However, excitonic effects and exciton-phonon coupling, neglected within the present approach, need to be addressed for this level of precision. In agreement with our findings, the experimental indirect gap depends little on both temperature and structure 555Note that the pressure values of Ref. Loubeyre et al. (2002) have been recently corrected Loubeyre et al. (2020).
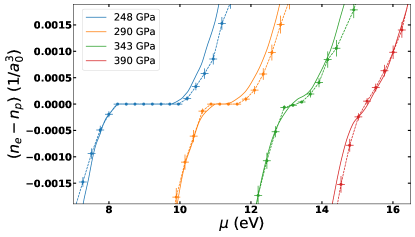
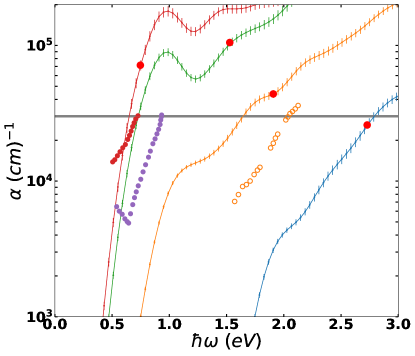
Next we explore optical properties computed using the Kubo-Greenwood (KG) framework with Kohn-Sham (KS) orbitals. To reduce the bias of the underlying DFT functional, we have benchmarked several XC approximations to reproduce the behavior of the QMC density of states close to the gap. In Fig. 4 for C2/c-24 at 200K, we compare the electronic excess density, , as a function of electronic chemical potential, , from QMC and from DFT-HSE 666This quantity is closely related to the integrated density of states.. The observed plateau at is the signature of the indirect gap. Deviations from the plateau on both sides characterize the density of states of the valence and conduction band close to the band edges. As shown in Fig. 4 the HSE approximation provides slightly smaller values of the fundamental gap and reproduces reasonably well the integrated density of states from GCTABC around the Fermi energy (more details are in see Supplementary Material ). We therefore employed HSE to compute optical properties exploiting the KGEC code Calderín et al. (2017) in the QuantumEspresso suite Giannozzi et al. (2017). For thermal and quantum crystals considered here, the William-Lax (WL) semiclassical (SC) approximation Williams (1951); Lax (1952); Patrick and Giustino (2014); Zacharias et al. (2015); Zacharias and Giustino (2016) is not appropriate as already discussed. Instead of a joint density of states based on excitation energies for each nuclear configuration entering the WL expression, we have used the corresponding one based on electronic energies averaged over ionic ZPM, more appropriate for low temperatures see Supplementary Material . In Fig. 5 we compare the absorption profiles for C2/c-24 at T=200K and different pressures 777To partially correct for HSE inaccuracy, we shifted the energy scale by the difference between the QMC and HSE gap. to experimental profiles from Refs Loubeyre et al. (2002, 2020) at T=100K. We observe a higher absorption than in experiments at comparable pressure, which cannot be explained by the temperature difference. We marked each predicted profile with a red dot at the energy corresponding to the observed direct gap and we report a thick horizontal line at the value of the absorption used in the experiments to extract the value of the direct gap. Our results at lower pressures are in reasonable agreement with this criterion. However at the higher pressure absorption at the energy gap is about 2-3 times higher than .
Conclusions. We have studied the closure of the fundamental gap with pressure of candidate structures of molecular hydrogen in phase III (C2/c-24 and Cmca-12) and phase IV (Pc48) entirely based on Quantum Monte Carlo. For ideal structures our gap values are in excellent agreement with GW predictionMcMinis et al. (2015). Considering quantum nuclei at finite temperature, we observe a strong reduction of the energy gap with respect to the ideal structures at the same pressure ( 2eV) caused by ZPM. At 200K the fundamental (indirect) gap closes at 370-380GPa for C2/c-24 and at 340GPa for Cmca-12. We observe a reasonable agreement with experimental determinations of indirect gaps from optical absorption. The direct gap remains open until 450GPa for C2/c-24 and for Cmca-12. In this range of pressure the system is a bad metal (or semi-metal) suggesting a scenario that qualitatively supports recent experiments Dias et al. (2016); Eremets et al. (2017, 2019); Dias et al. (2019). In Refs Eremets et al. (2017, 2019) no discontinuities in the Raman vibrational spectrum are reported when entering the semi-metallic phase, while in Refs Dias et al. (2016, 2019) new IR vibron peaks are reported in this pressure range and ascribed to a structural phase transition. They have been tentatively assigned to a transition from the C2/c-24 to the Cmca-12 structureDias et al. (2019). Our present results, supplemented by free energy calculations Pierleoni , do not disprove this hypothesis. Our predictions for direct gap are in good agreement with the experimental data at T=100K Loubeyre et al. (2002, 2020). However our absorption profiles do not agree as well with the experimental behaviour. This disagreement remains an open question.
Acknowledgements.
We thank Paul Loubeyre, Mikhail Eremets, Mario Santoro and Michele Nardone for useful suggestions. D.M.C. was supported by DOE Grant NA DE-NA0001789 and by the Fondation NanoSciences (Grenoble). V.G. and C.P. were supported by the Agence Nationale de la Recherche (ANR) France, under the program “Accueil de Chercheurs de Haut Niveau 2015” project: HyLightExtreme. Computer time was provided by the PRACE Project 2016143296, ISCRAB (IsB17_MMCRHY) computer allocation at CINECA Italy, the high-performance computer resources from Grand Equipement National de Calcul Intensif (GENCI) Allocation 2018-A0030910282, by an allocation of the Blue Waters sustained petascale computing project, supported by the National Science Foundation (Award OCI 07- 25070) and the State of Illinois, and by the Froggy platform of CIMENT, Grenoble (Rhône-Alpes CPER07-13 CIRA and ANR-10-EQPX-29-01).References
- Wigner and Huntington (1935) E. Wigner and H. B. Huntington, J. Chem. Phys. 3, 764 (1935).
- Dias and Silvera (2017) R. P. Dias and I. F. Silvera, Science 355, 715 (2017).
- Goncharov and Struzhkin (2017) A. F. Goncharov and V. V. Struzhkin, Science 357 (2017), 10.1126/science.aam9736.
- Loubeyre et al. (2017) P. Loubeyre, F. Occelli, and P. Dumas, (2017), arXiv:1702.07192 .
- Liu et al. (2017) X.-D. Liu, P. Dalladay-Simpson, R. T. Howie, B. Li, and E. Gregoryanz, (2017), arXiv:1704.07601v2 .
- Silvera and Dias (2017) I. Silvera and R. Dias, Science 357, eaan1215 (2017), arXiv:1603.02162 .
- Mao and Hemley (1994) H. K. Mao and R. Hemley, Rev. Mod. Phys. 66, 671 (1994).
- McMahon et al. (2012) J. M. McMahon, M. A. Morales, C. Pierleoni, and D. M. Ceperley, Rev. Mod. Phys. 84, 1607 (2012).
- Nellis (2006) W. J. Nellis, Reports on Progress in Physics 69, 1479 (2006).
- Loubeyre et al. (1996) P. Loubeyre, R. LeToullec, D. Hausermann, M. Hanfland, R. J. Hemley, H. K. Mao, and L. W. Finger, Nature 383, 702 (1996).
- Ji et al. (2019) C. Ji, B. Li, W. Liu, J. S. Smith, A. Majumdar, W. Luo, R. Ahuja, J. Shu, J. Wang, S. Sinogeikin, Y. Meng, V. B. Prakapenka, E. Greenberg, R. Xu, X. Huang, W. Yang, G. Shen, W. L. Mao, and H.-K. Mao, Nature 573, 558 (2019).
- Dubrovinsky et al. (2019) L. Dubrovinsky, N. Dubrovinskaia, and M. I. Katsnelson, arxiv:1910.10772 (2019).
- Silvera and Dias (2018) I. Silvera and R. P. Dias, J. Phys.: Condens. Matter 30, 254003 (2018).
- Eremets and Troyan (2011) M. I. Eremets and I. A. Troyan, Nature materials 10, 927 (2011).
- Nellis et al. (2012) W. J. Nellis, A. L. Ruoff, and I. F. Silvera, (2012), arXiv:1201.0407 .
- Goncharov and Struzhkin (2012) A. F. Goncharov and V. V. Struzhkin, Nature Materials 10, 927 (2012).
- Goncharov et al. (2013) A. F. Goncharov, J. S. Tse, H. Wang, J. Yang, V. V. Struzhkin, R. T. Howie, and E. Gregoryanz, Phys. Rev. B 87, 024101 (2013).
- Eremets et al. (2016) M. I. Eremets, I. A. Troyan, and A. P. Drozdov, (2016), arXiv:1601.04479 .
- Eremets et al. (2017) M. Eremets, A. P. Drozdov, P. Kong, and H. Wang, (2017), https://arxiv.org/abs/1708.05217 .
- Dias et al. (2016) R. P. Dias, O. Noked, and I. F. Silvera, (2016), arXiv:1603.02162 .
- Loubeyre et al. (2020) P. Loubeyre, F. Occelli, and P. Dumas, Nature 577, 631 (2020).
- Dias et al. (2019) R. P. Dias, O. Noked, and I. F. Silvera, Physical Review B 100, 184112 (2019).
- Howie et al. (2012a) R. T. Howie, T. Scheler, C. L. Guillaume, and E. Gregoryanz, Physical Review B 86, 214104 (2012a).
- Howie et al. (2012b) R. T. Howie, C. L. Guillaume, T. Scheler, A. F. Goncharov, and E. Gregoryanz, Phys. Rev. Letts. 108, 125501 (2012b).
- Zha et al. (2012) C. S. Zha, Z. Liu, and R. J. Hemley, Phys. Rev. Letts. 108, 146402 (2012).
- Loubeyre et al. (2013) P. Loubeyre, F. Occelli, and P. Dumas, Phys. Rev. B 87, 134101 (2013).
- Howie et al. (2015) R. T. Howie, P. Dalladay-Simpson, and E. Gregoryanz, Nature Materials 14, 1 (2015).
- Eremets et al. (2019) M. I. Eremets, A. P. Drozdov, P. P. Kong, and H. Wang, Nat. Phys. (2019), 10.1038/s41567-019-0646-x.
- Eremets and Drozdov (2016) M. I. Eremets and A. P. Drozdov, (2016), arXiv:1601.04479 .
- Silvera and Dias (2019) I. F. Silvera and R. P. Dias, arXiv (2019), arXiv:1906.05634 .
- Pickard and Needs (2007) C. J. Pickard and R. J. Needs, Nature Physics 3, 473 (2007).
- Pickard et al. (2012a) C. J. Pickard, M. Martinez-Canales, and R. J. Needs, Physical Review B 85, 214114 (2012a).
- Yang et al. (2020) Y. Yang, V. Gorelov, C. Pierleoni, D. M. Ceperley, and M. Holzmann, Phys. Rev. B 101, 085115 (2020).
- (34) see Supplementary Material, [url] which includes Refs. [67-74] .
- Pickard et al. (2012b) C. Pickard, M. Martinez-Canales, and R. Needs, Phys. Rev. B 86, 214114 (2012b).
- Monserrat et al. (2018) B. Monserrat, N. D. Drummond, P. Dalladay-simpson, R. T. Howie, P. Lopez Rios, E. Gregoryanz, C. J. Pickard, and R. J. Needs, Phys Rev Letts 120, 255701 (2018).
- McMinis et al. (2015) J. McMinis, R. C. Clay, D. Lee, and M. A. Morales, Phys. Rev. Letts. 114, 105305 (2015).
- Azadi et al. (2014) S. Azadi, B. Monserrat, W. M. C. Foulkes, and R. J. Needs, Phys. Rev. Lett. 112, 165501 (2014).
- Note (1) We have checked that the stress tensor in the constant volume CEIMC run remains diagonal with same diagonal elements within our statistical noise.
- Pierleoni et al. (2016) C. Pierleoni, M. A. Morales, G. Rillo, M. Holzmann, and D. M. Ceperley, Proc. Natl. Acad. Sci. 113, 4954 (2016).
- Rillo et al. (2018) G. Rillo, M. A. Morales, D. M. Ceperley, and C. Pierleoni, J. Chem Phys. 148, 102314 (2018).
- Azadi et al. (2017) S. Azadi, N. D. Drummond, and W. M. C. Foulkes, Phys. Rev. B 95, 035142 (2017).
- Lebègue et al. (2012) S. Lebègue, C. Araujo, D. Kim, M. Ramzan, H. Mao, and R. Ahuja, Proceedings of the National Academy of Sciences 109, 9766 (2012).
- Wai-Leung Yim and Tse (2017) Y. L. R. J. H. Wai-Leung Yim, Hongliang Shi and J. S. Tse, in Correlations in Condensed Matter under Extreme Conditions, edited by G. A. Editors and A. L. Magna (Springer International Publishing, AG, 2017) Chap. 9, pp. 107–126.
- Dvorak et al. (2014) M. Dvorak, X.-J. Chen, and Z. Wu, Physical Review B 90, 035103 (2014).
- Note (2) The observed small difference, in particular at the higher pressure, is probably due to the different XC approximation used for geometry optimization, vdW-DF in our case, BLYP in Ref. Azadi et al. (2017) and different size extrapolation.
- Morales et al. (2013) M. A. Morales, J. M. McMahon, C. Pierleoni, and D. M. Ceperley, Phys. Rev. B 87, 184107 (2013).
- Clay et al. (2014) R. C. Clay, J. McMinis, J. M. McMahon, C. Pierleoni, D. M. Ceperley, and M. A. Morales, Phys. Rev. B 89, 184106 (2014).
- Heyd et al. (2005) J. Heyd, J. E. Peralta, G. E. Scuseria, and R. L. Martin, J. Chem. Phys. 123, 174101 (2005).
- Lee et al. (2010) K. Lee, É. Murray, L. Kong, B. Lundqvist, and D. Langreth, Physical Review B 82, 81101 (2010).
- Azadi et al. (2018) S. Azadi, R. Singh, and T. D. Kühne, Journal of Computational Chemistry 39, 262 (2018), arXiv:1710.09703 .
- Li et al. (2013) X.-Z. Li, B. Walker, M. I. J. Probert, C. J. Pickard, R. J. Needs, and A. Michaelides, J. Phys. Condens. Matter 25, 085402 (2013), arXiv:1302.0062v1 .
- Loubeyre et al. (2002) P. Loubeyre, F. Occelli, and R. LeToullec, Nature 416, 613 (2002).
- Note (3) We have re-analyzed the spectra of ref. Loubeyre et al. (2002) to extract the value of the indirect gap from a Tauc plot Tauc et al. (1966), as was performed in ref. Goncharov et al. (2013) for the data from ref. Howie et al. (2012b). Details are given in the see Supplementary Material .
- Note (4) Our estimates of the direct gap could be biased by due to the discreteness of our twist grid. Correcting for this bias will place the experimental data in between the C2/c-24 and Cmca-12 predictions.
- Note (5) Note that the pressure values of Ref. Loubeyre et al. (2002) have been recently corrected Loubeyre et al. (2020).
- Note (6) This quantity is closely related to the integrated density of states.
- Calderín et al. (2017) L. Calderín, V. V. Karasiev, and S. B. Trickey, Comput. Phys. Commun. 221, 118 (2017), 1707.08437 .
- Giannozzi et al. (2017) P. Giannozzi, O. Andreussi, T. Brumme, O. Bunau, M. Buongiorno Nardelli, M. Calandra, R. Car, C. Cavazzoni, D. Ceresoli, M. Cococcioni, N. Colonna, I. Carnimeo, A. Dal Corso, S. de Gironcoli, P. Delugas, R. A. J. DiStasio, A. Ferretti, A. Floris, G. Fratesi, G. Fugallo, R. Gebauer, U. Gerstmann, F. Giustino, T. Gorni, J. Jia, M. Kawamura, H.-Y. Ko, A. Kokalj, E. Kukukbenli, M. Lazzeri, M. Marsili, N. Marzari, F. Mauri, N. L. Nguyen, H.-V. Nguyen, A. Oreto-de-la Roza, L. Laulatto, S. Ponce, D. Rocca, R. Sabatini, B. Santra, M. Schlipf, A. Seitsonen, A. Smogunov, I. Timrov, T. Thonhauser, P. Umari, N. Vast, X. Wu, and S. Baroni, J. Phys. Cond Mat. 29, 465901 (2017).
- Williams (1951) F. Williams, Phys. Rev. 82, 281 (1951).
- Lax (1952) M. Lax, The Journal of Chemical Physics 20, 1752 (1952).
- Patrick and Giustino (2014) C. E. Patrick and F. Giustino, Journal of Physics Condensed Matter 26, 365503 (2014).
- Zacharias et al. (2015) M. Zacharias, C. E. Patrick, and F. Giustino, Phys. Rev. Lett. 115 (2015).
- Zacharias and Giustino (2016) M. Zacharias and F. Giustino, Phys. Rev. B 94, 75125 (2016).
- Note (7) To partially correct for HSE inaccuracy, we shifted the energy scale by the difference between the QMC and HSE gap.
- (66) C. Pierleoni, unpublished .
- Martin et al. (2016) R. M. Martin, L. Reining, and D. M. Ceperley, Interacting Electrons: Theory and Computational Approaches (Cambridge University Press, 2016).
- Perdew (1985) J. P. Perdew, Int. J. Quantum Chem. 28, 497 (1985).
- Lin et al. (2001) C. Lin, F. H. Zong, and D. M. Ceperley, Phys. Rev. E 64, 016702 (2001), arXiv:0101339 [cond-mat] .
- Holzmann et al. (2009) M. Holzmann, B. Bernu, V. Olevano, R. M. Martin, and D. M. Ceperley, Phys. Rev. B 79, 2 (2009).
- Grosso and Parravicini (2014) G. Grosso and G. Parravicini, Solid State Physics, 2nd ed. (Academic Press, 2014).
- Wooten (1972) F. Wooten, Optical properties of Solids (Academic Press, NY, 1972).
- Morales et al. (2014) M. A. Morales, R. Clay, C. Pierleoni, and D. M. Ceperley, Entropy 16, 287 (2014).
- Tauc et al. (1966) J. Tauc, R. Grigorovici, and A. Vancu, Physica Status Solidi (b) 15, 627 (1966).