∎
School of Science
Low Temperature Laboratory
P.O. BOX 15100 FI-00076 Aalto, Finland
33email: tapio.riekki@aalto.fi
A. P. Sebedash 44institutetext: P. L. Kapitza Institute for Physical Problems RAS
Kosygina 2, 119334 Moscow, Russia
Performance of adiabatic melting as a method to pursue the lowest possible temperature in 3He and 3He–4He mixture at the 4He crystallization pressure††thanks:
Abstract
We studied a novel cooling method, in which 3He and 4He are mixed at the 4He crystallization pressure at temperatures below . We describe the experimental setup in detail, and present an analysis of its performance under varying isotope contents, temperatures, and operational modes. Further, we developed a computational model of the system, which was required to determine the lowest temperatures obtained, since our mechanical oscillator thermometers already became insensitive at the low end of the temperature range, extending down to ( of pure 3He). We did not observe any indication of superfluidity of the 3He component in the isotope mixture. The performance of the setup was limited by the background heat leak of the order of at low melting rates, and by the heat leak caused by the flow of 4He in the superleak line at high melting rates up to . The optimal mixing rate between 3He and 4He, with the heat leak taken into account, was found to be about . We suggest improvements to the experimental design to reduce the ultimate achievable temperature further.
Keywords:
Adiabatic melting Helium-3Helium-4Helium-3–Helium-4 mixture Kapitza resistance1 Introduction
Strong motivation for pursuing ever lower temperatures in helium fluids is the anticipated superfluid transition of the 3He component in dilute 3He–4He mixtures. Pure liquid 3He undergoes superfluid transition when fermionic 3He atoms start to form BCS-like pairs BCS . The phenomenon occurs only at sufficiently low temperatures, which for pure 3He is about 1 mK at saturated vapor pressure, and just below 3 mK at 3He crystallization pressure (). We, however, are interested in systems where 3He is diluted by 4He. The 4He component of the mixture becomes superfluid already at around , and at millikelvin regime it acts as a thermally inert background contributing to the interactions between the 3He atoms. The requirement for the BCS-pairing is an attractive interaction between the particles, and since a very weak attraction is still present in the mixture systems, the 3He component superfluid transition is expected to occur at some ultra-low temperature Ebner_thesis ; Bardeen1967 ; AL-SUGHEIR2006 ; Sandouqa2011 ; Effective_3He_interactions . Rysti et al. Effective_3He_interactions calculated the highest transition temperature to occur at in saturated mixture, while at the crystallization pressure of 4He (), it was estimated to be about .
Superfluid mixture of 3He and 4He would be a dense mixture of fermionic and bosonic superfluids, and thus a completely unique system. Mixture superfluidity has been studied in rare quantum gases Kinnunen2015 ; Chevy2015 ; Delehaye2015 ; Onofrio2016 , where it has been observed both in mixtures of 6Li and 7Li Bose_Fermi_superfluids , and 6Li and 174Yb Roy2017 . However, the interactions between Fermi and Bose superfluids are significantly weaker there than they would be in liquid helium of times higher density, making the superfluid helium isotope mixture a fascinating system to study. Furthermore, since the melting method can be used to cool pure 3He phase as well, it could be used to study the exotic f-wave pairing state of superfluid 3He, that has been anticipated to take place below Nguyen2019 . The majorana quasiparticle surface states should also manifest themselves at low enough temperature Bunkov2013 ; Bunkov2014 .
To reach for such extreme conditions, cooling techniques need to be perfected. The situation was similar in the 1960s during the search for 3He superfluidity Osheroff1972 ; Osheroff1972a , that saw, for example, the development of the Pomeranchuk cooling method pomeranchuk1950theory ; anufriev1965soviet . Oh et al. Oh1994 used a two-stage nuclear demagnetization refrigerator to cool a small mixture sample, with a heat-exchanger surface area, to at 1 MPa. The major problem with an external cooling method, such as that, is the rapidly increasing thermal boundary resistance, or Kapitza resistance, between liquid helium and metallic coolant. To fight against it, one needs to increase the surface area of the experimental volume, but eventually, it will become practically unviable.
The adiabatic melting method Sebedash1997 ; Sebedash2000 ; Tuorinemi_Martikainen_Pentti ; Adiabatic_Melting overcomes the Kapitza bottleneck by relying on internal cooling that takes place directly in helium fluid. In this setup, the nuclear demagnetization refrigerator provides only precooling conditions, and thus the surface area of the cell will no longer be the ultimate limiting factor. The physical origin of cooling is similar to that of a conventional dilution refrigerator, except that the melting method operates cyclically at an elevated pressure. The phase separation between helium isotopes is achieved by increasing the pressure in the system to the crystallization pressure of 4He Pentti_Thermometry . When 4He solidifies at sufficiently low temperature, it expels all the 3He component Balibar2000 ; Balibar2002 ; Pantalei2010 , and ideally in the end we have a system consisting of pure solid 4He, with negligibly small entropy, and pure liquid 3He. If the system is then cooled to far below the superfluid transition temperature of pure 3He Pentti_Thermometry , the entropy of the liquid component can also be reduced dramatically.
Good initial temperature would be of order 0.5 mK, which is straightforward to bring about by using adiabatic nuclear demagnetization of copper. Next, the solid phase is melted, releasing liquid 4He allowing 3He to mix with it again forming a saturated mixture with Pentti_etal_solubility molar 3He concentration. Per mole, 3He–4He mixture contains a large amount of entropy compared to superfluid 3He, and going adiabatically from the system of solid 4He–superfluid 3He to mixture is only possible if the temperature of the system decreases. Theoretically, the cooling factor in the melting process can exceed 1000, but in practice, things like remnant mixture in the initial state, and external heat leak can severely limit it. To repeat the process, solid then needs to be regrown and the heat released from the phase separation absorbed to the precooling stage. A more thorough discussion about the thermodynamics of the adiabatic melting method can be found in Ref. Riekki2019 .
Our experiment takes advantage of the lessons learned from the earlier run Adiabatic_Melting , and places the sinter needed for precooling into a separate volume to reduce the heat load from the precooler to the melting cell at the coldest stages of the experiment. We have also improved the design of the superleak line. Superleak is a capillary filled with tightly packed powder, that allows only superfluid 4He to flow through it. The performance of the superleak is essential to the success of the experiment, as the solid 4He phase is grown, or melted, by transferring superfluid 4He to, or from, the cell. Further, the cooling power of the melting process is directly proportional to the melting rate, whence the superleak needs to be able to sustain large enough flow.
The present paper is a complete recollection of our recent melting experiment run. Our earlier publications Riekki2019 ; Sebedash_QFS ; Riekki2019a ; Riekki_kappa laid the groundwork for the results presented here, and will be frequently referred to. We start by describing the experimental setup, briefly summarizing the entire cooling system, but focusing on the low temperature parts, as well as give a rundown of a typical melting run. Then we will build upon the computational thermal model of the system, first introduced in Ref. Riekki_kappa . The computational model was needed, because at the lowest temperatures, the quartz tuning fork oscillators we used for thermometry had become insensitive Riekki2019a . To complete the model, we first determine the Kapitza resistance coefficients of our system that determine the thermal connection between the melting cell and the demagnetization precooler. Then we will describe the determination of distribution of the helium isotopes between the three phases present in the system at different stages of the experiment, before moving on to the next topic, the heat leak during the melting process. We will show that it consists of two components: generic background heat leak, and melting-rate dependent contribution. Once the computational model is completed, we use it to determine the lowest achieved temperatures. We conclude that there was no observation of the superfluidity of the mixture phase. We will also show examples of how the setup behaved at higher temperatures (), under varying conditions, as well as simulate how altering certain parameters would have affected the lowest possible temperature achievable in the system. Finally, we will also suggest improvements for the next iteration of the experiment.
2 Experimental Setup
2.1 Cooling system
The cooling system that allowed us to reach for the record-low temperatures in helium fluids essentially consisted of five stages. The cryostat was submerged in liquid 4He bath, which provided starting temperature of 4 K. Liquid from the bath was also used to operate a 4He evaporation cooler, or pot, to provide 1 K base temperature to the vacuum insulated inner parts of the cryostat. The pot was needed to liquefy the incoming 3He to the closed-cycle 3He–4He dilution refrigerator, in which 3He was continuously mixed with 4He to decrease the temperature to about 10 mK. In fact, we had two pots connected together with one providing the general cooling to 1 K and condensing of 3He, while the secondary pot was used to thermalize the capillaries connecting to the melting cell.
The dilution refrigerator was, in turn, used to precool the adiabatic nuclear demagnetization stage Pobell ; Lounasmaa . There the nuclear spins of copper were first aligned in a large magnetic field, and the heat of magnetization was absorbed by the dilution refrigerator, after which the two stages were thermally disconnected by an aluminum heat switch. Then, the magnetic field was slowly lowered, while maintaining alignment of the nuclear spins, which cooled the system further, dropping the copper electron temperature to below 0.5 mK. The electron temperature was monitored by a pulsed 195Pt NMR thermometer (PLM). The nuclear stage cannot be operated continuously, as increasing the magnetic field heats the system to about 50 mK. Attached to the nuclear stage was the fifth and final cooling stage: the melting cell.
2.2 Cell
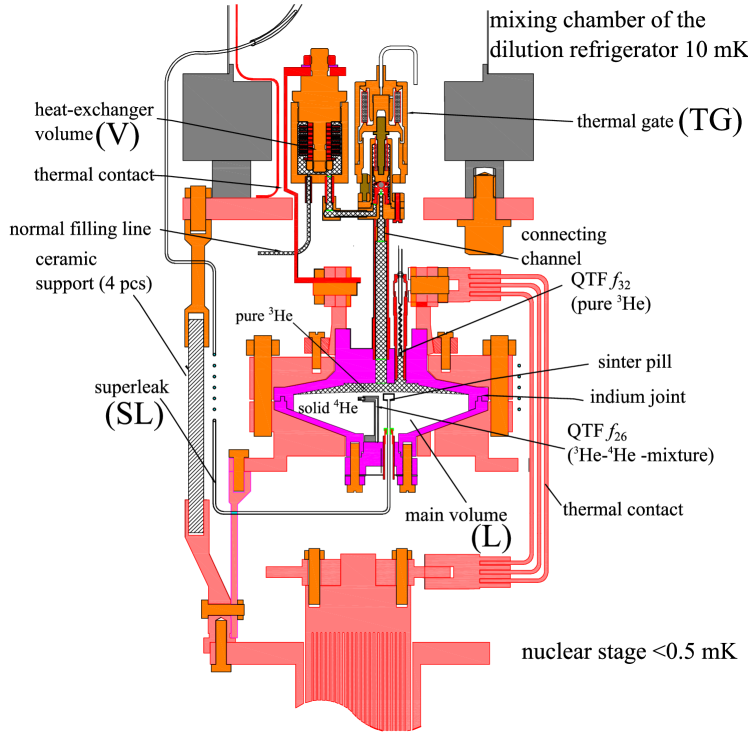
The total volume of the experimental cell, shown in Fig. 1, was and it consisted of two separate parts: a large main volume () and a small sinter-filled heat-exchanger volume () connected together by a channel that could be restricted by a pressure-operated cold-valve, dubbed as the thermal gate. The cooling process occurred in the main volume that housed liquid 3He, 3He–4He mixture, and solid 4He at varying proportions depending on the stage of the cooling cycle. At most, about 90% of the main volume was filled by solid. The connecting channel and the heat-exchanger were filled with liquid 3He, and as the name suggests, its purpose was to provide thermal connection between the liquid in the cell and the nuclear stage during precooling periods.
The body of the main volume was made of two high-purity copper shells that were encased in between thick copper flanges to provide rigidity to sustain high pressures. The shells were sealed by an indium joint and tightened by 16 bolts through the copper flanges. The bottom surface of the cell had a grafoil strip on it to act as a nucleation site for 4He crystal Balibar2005 .
The heat-exchanger volume was also made of copper with a stack of 8 sintered discs attached to the top half of the volume. Each of them was a silver disc covered by silver sinter on both sides with silver-plated copper spacers in between to provide good thermal contact throughout the entire stack. We determined the surface area of the stack to be about , while the plain walls of the main cell volume had about surface area.
The setup had two filling lines to transport liquid helium in the system. An ordinary capillary line attached to the heat-exchanger volume was used to fill the cell with 3He, while a superleak line connected to the main volume of the cell was used to transfer superfluid 4He to and from the cell. The 4He crystallization pressure in porous superleak is higher than in bulk and thus that line remained open when the normal capillary was already blocked by solid helium. The cell-side end of the superleak line was placed in the middle of the main volume to allow the crystal to grow to large enough size, and had a cylindrical pill of sintered powder attached to it to prevent solid from blocking it prematurely. The other two feedthroughs were for the quartz tuning fork oscillators, discussed further in Section 2.3.
2.2.1 Thermal gate
Ultimately, the main volume of the cell was the coldest part of the experiment. The purpose of the thermal gate was to isolate the cell main volume from the heat-exchanger volume at times like this to minimize the heat flow coming from the nuclear stage. Thermal gate was a pressure operated needle valve, where the “needle” was a stainless steel ball at the end of a Vespel rod pressed against a conical copper saddle (see Fig. 1). The valve was operated by a miniature stainless steel bellows system with brass framework and a copper bottom flange. Vespel was used to provide heat insulation both between the upper and the lower part of the bellows as well as between the frame and the bottom flange. The upper bellows was fitted with both normal and superleak lines with the normal line allowing us to introduce 3He to the system, while the superleak was used to operate the bellows via transfer of superfluid 4He.
As the pressure in upper bellows is increased, the ball is pressed against the saddle, restricting the width of the channel. At 0.1 MPa the gate was fully open, while at 0.3 MPa it was closed. The setup was not intended to be superfluid 3He tight, but rather it was supposed to sufficiently limit the flow of normal-fluid 3He that is responsible of the entropy transfer between the volumes. Further information about the thermal gate can be found in Ref. Sebedash_QFS .
2.2.2 Superleak line and the bellows system
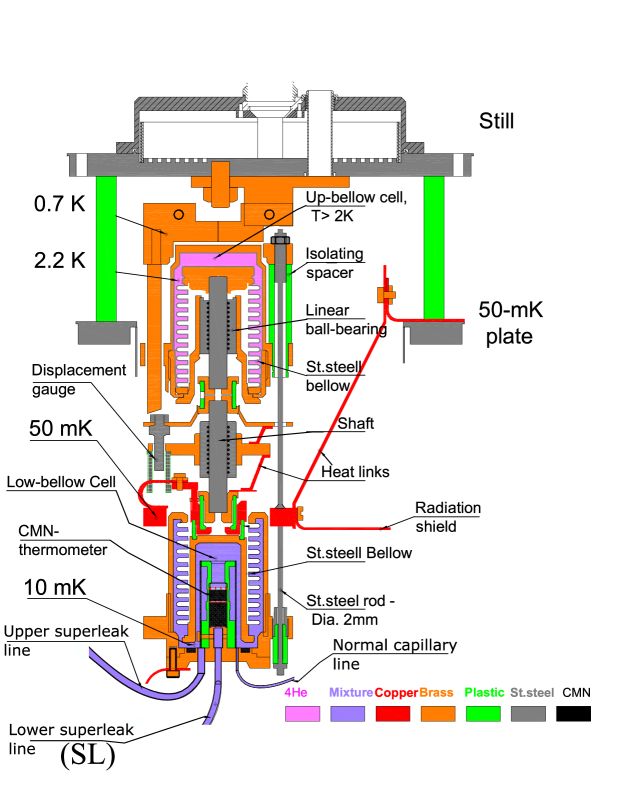
The cell superleak mentioned in Section 2.2 consisted of two pieces. The first one started from the main volume of the cell and ended up in the lower of the two bellows attached to the dilution refrigerator of the cryostat. This bellows system, shown in Fig. 2, was similar to that of the bellows in the thermal gate, but at larger size Sebedash_QFS . From the lower bellows, the second superleak piece continued to the still plate of the dilution refrigerator at . From there on, an ordinary capillary line continued towards room temperature, thermalized to and along the way (not shown in Fig. 2)
The still plate thermalization was made weak on purpose to allow us to warm-up the upper end of the superleak if needed. The melting curve of 4He is flat up to about , above which the pressure starts to increase. As the solid in the cell fixes the pressure in the system to a value slightly higher than this, the open upper-end of the superleak had to be warm enough to keep it free from solid, and available for 4He transport. It turned out that no additional heating was required, but the heat link itself was weak enough to keep the temperature sufficiently high. However, that also meant that we could not block the superleak easily at will, but to do so we had to increase the pressure enough to force crystallization at the upper end. The original intention was to allow the superleak to become blocked during the precooling of the cell to decrease heat load coming through it, but achieving it easily was thus not possible.
The purpose of the two-part superleak design was to isolate the experimental cell from any parts of the cryostat. Of special concern was preventing the fourth sound modes potentially generated at the high-temperature end of the superleak line from reaching the cell. Such sound modes can be generated in porous materials, at temperatures near 4He superfluid transition temperature , where there still is a finite amount of normal fluid component along with the superfluid. With this design, their propagation should terminate at the lower bellows and the possible heat generated would be absorbed to the dilution refrigerator at no detriment to the melting cell.
To grow the solid phase, 4He was introduced from a gas bottle at room temperature, and then pushed through a liquid nitrogen trap to the superleak and to the cell. The melting was performed by pumping the line with a scroll pump, or simply to an empty volume. The flow of 4He was measured using Bronkhorst F-111C-HA-33-V EL-FLOW flowmeter, calibrated against helium flow from a known volume storage tank at various pressure gradients. Accurate flow measurement was important as the amount of transferred 4He is directly proportional to the change in the amount of solid in the cell main volume.
The 4He transport carried out this way inherently had a connection from room temperature to the lowest temperature parts of the experiment. Even if there were several thermalizations and buffer volumes along the way, there were concerns about the heat leak this direct procedure could cause to the experiment. Hence, the actual purpose of the bellows system was to provide an alternate cell operation method without this direct room temperature path.
The lower bellows (Fig. 2) was filled with saturated 3He–4He mixture at 10 mK, and was monitored by a CMN-susceptibility thermometer, while the upper bellows had pure 4He kept at above 1 K. By changing the pressure in the upper bellows, the lower bellows could be compressed or depressed to provide flow to, or from, the main cell volume. This way the solid growth and melt would be isolated from room temperature by the isolation between the lower and upper bellows, and the flow in the superleak would only involve parts at temperatures at 10 mK or below. The areas of the bellows system were designed so that changing the upper bellows pressure between would utilize its entire range of motion without risking the formation of solid 4He there. A more detailed description of the bellows is also in Ref. Sebedash_QFS .
2.3 Quartz tuning fork
The main volume of the experimental cell was monitored by two quartz tuning fork resonators (QTFs): one in a tubular extension on the top half of the cell structure, and the other in the middle of the volume. The upper QTF was resonance frequency ECS Inc. ECS-.327-8-14X oscillator placed so that it would always be in the pure 3He phase acting as our main thermometer. The second QTF was resonance frequency EPSON C-2 26.6670K-P:PBFREE oscillator situated in the middle of the main volume and thus either in liquid 3He–4He mixture or frozen in solid 4He (and thus inoperable), depending on the amount of solid. The forks had different resonance frequencies to ensure that they did not interfere with each other.
The forks were operated by two separate circuits with excitation provided by a signal generator and the signal read with a combination of a pre-amplifier and a lock-in amplifier. The two parameters determined from the readout were the resonance frequency and its width (full-width at half-maximum). The circuits could be operated either in a full-frequency sweep mode, or a single-point tracking mode Pentti_Rysti_Salmela . The tracking mode assumes a Lorentzian lineshape and conservation of energy resulting in a constant resonance curve area. It is useful at small resonance widths to increase the data collection rate, because it circumvents the necessity to wait a time proportional to the inverse of the width after changing the frequency.
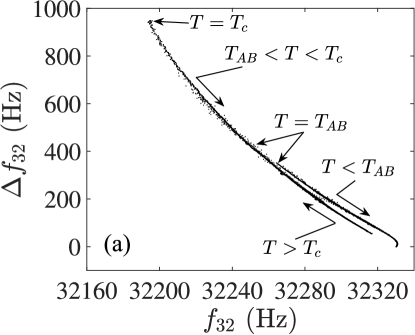
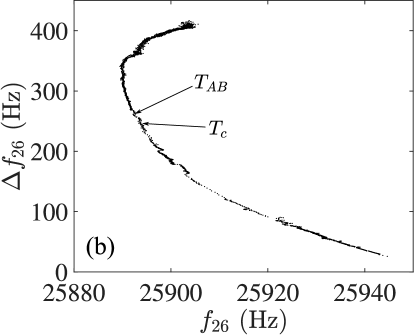
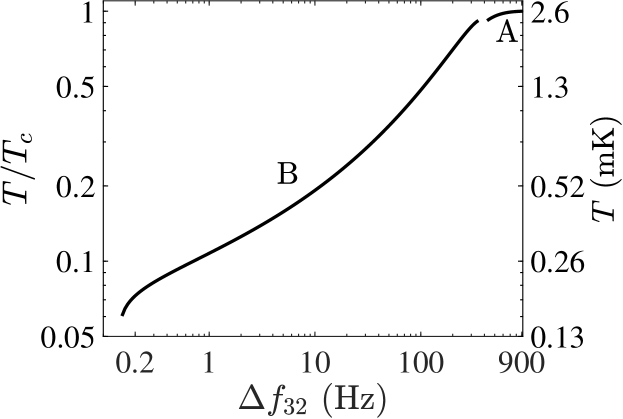
The response of each fork to temperature is illustrated in Fig. 3. As we approach the from above, the viscosity of normal fluid 3He increases with decreasing temperature (Fig. 3a), observed as increased width of the QTF. At the width is , after which the dissipation of the fork starts to decrease due to the now-superfluid nature of 3He. When we cooled to below the , liquid 3He tended to undercool before transitioning to superfluid state, and the width-at- value was determined during the warm-up instead. 3He is first an A-phase superfluid with the transition to B-phase occurring at Greywall1986 , indicated by a jump in the resonance width from to . As the temperature in the superfluid 3He is decreased, the number of quasiparticles decreases, and the mean-free path of the remaining particles increases. Eventually, it exceeds the dimensions of the experimental cell and we reach the ballistic regime. This occurs at , corresponding to about Todoshchenko2014 , below which the resonance frequency no longer changes significantly but the width still has temperature resolution down to about 0.3 mK, where it saturates to our minimum observed width .
The caveat regarding the QTF is that it was not in pure bulk 3He. Rather, since there was 4He present in the system, all available surface was covered by a superfluid 4He film. This included the surfaces of the “3He QTF” as well. In principle, deep in bulk superfluid 3He phase, we should be able to reach the vacuum resonance width of the QTF of order 10 mHz, as the superfluid-induced dissipation disappears. But, as said, the lowest observed resonance width was of order 100 mHz, leading us to believe that the 4He film coverage is responsible for the additional dissipation. The effect of the film starts to be meaningful when the width drops below . More discussion about such film influence on mechanical oscillators can be found in Refs. Riekki2019a ; Peshkov1975 ; Kim1993 ; Boldarev2011 ; Murakawa2012 .

The second QTF was immersed in the mixture phase, where the 3He component remained always in the normal state. Thus, the measured resonance width increased monotonically with decreasing temperature (Fig. 3b), saturating to 405 Hz at about . The main purpose of this QTF was to show the anticipated superfluid transition in mixture that would have resulted in sudden decrease in the resonance width. It could also be used as another thermometer down to its saturation. We performed one precool with small enough crystal to keep both forks available the entire time to cross-check their response to temperature. This is shown in Fig. 4 demonstrating congruent temperature response between them, and that there were no discernible temperature gradients within 3He and mixture phase down to 1 mK during this particular run.
The width of the 3He QTF was converted to temperature with a phenomenological formula defined piecewise in 3He-B, 3He-A, and normal fluid. For the normal fluid region, we combined the hydrodynamic tuning fork equations from Ref. Blaauwgeers , and the bulk 3He viscosity from Ref. Pentti_Rysti_Salmela to give
| (1) |
where and are the measured resonance frequency and width, respectively, is the vacuum resonance frequency, Kollar2000a is the density of liquid 3He at 4He crystallization pressure, and is a fitting parameter, determined from , and .
In the B-phase, we used as a fixed point, and the ballistic cross-over temperature as a “semi-free” point with temperature fixed to but with the width value adjustable between and . The calibration is least accurate below 1 Hz widths, when the 4He film covering the QTF started to affect the measurement. To the narrow region of A-phase, we fitted a simple exponential function that was continuous with the B-phase formula both in value and in the first derivative. We ended up with
| (2) | ||||
for 3He-B, and
| (3) |
for 3He-A, where is the ballistic cross-over width, the residual width, the width at the AB-transition, while are fitting parameters whose values are listed in Table 1. The exponents 0.3 and 1.4 in Eq. (2) were determined empirically to give credible behavior across the whole span of the B-phase. The conversion from resonance width to temperature below the is shown in Fig. 5.
2.4 Measurement procedure
| variable | value |
|---|---|
| 0.429 Hz | |
| kHz | |
| 391.0 Hz | |
| 1.250 | |
| 0.085 | |
| 129.5 Hz |
A successful melting run requires sufficient amount of good quality solid 4He, low enough precooling temperature, and a reasonable melting rate of the solid. In order to have solid phase of absolutely pure 4He, the crystal must always be kept below 50 mK, as temperatures above that allow 3He to start to dissolve into it Balibar2000 ; Balibar2002 ; Pantalei2010 . To ensure the quality of the solid, we performed the initial nucleation and growth to maximal size below 20 mK, and usually the crystals intended to be used to pursue the lowest possible temperatures were grown entirely below the 3He . At no point we observed any indication of, or had a reason to suspect, 3He inclusions in the solid phase.
Nucleation of the solid 4He phase in the main cell volume was not always straightforward, as it often tended to occur in the bellows volume, and sometimes even at the upper end of the superleak line. This was counterintuitive as the main cell resided below the bellows volume to have even gravity favor the nucleation there. During the experiment, we had to warm-up the setup to liquid nitrogen temperature three times, due to trouble with the 1 K pot. We used that as an opportunity to change the amount of 3He in the main cell volume, as the cell could be emptied at such a high temperature. We noted, that after each such thermal cycle, the nucleation of 4He in the cell became more and more difficult with no apparent reason. Eventually, to entice the nucleation in the cell, we had to warm up the bellows volume to above 100 mK, while the main volume was below the . In the end, we resolved to nucleate a new crystal as few times as possible. This resulted in increased uncertainty in the determined amount of solid, since the error in the 4He flow measurement accumulated when the solid was melted and grown repeatedly without a fresh start from zero.
The precooling of the main cell consisted of two stages: first the cooling after magnetization of the nuclear stage to the dilution refrigerator temperature, and then precooling by the demagnetization of the nuclear stage. After the initial nucleation and growth near the , the nuclear stage was magnetized, which resulted the temperature to increase near 50 mK followed by precool to dilution refrigerator temperature around 12 mK. Then, after demagnetization, it took approximately 24 hours for the main volume to reach the pure 3He .
When the temperature of the cell dropped below the , we melted the solid in the cell almost completely, leaving only a small nugget of a crystal to not have to perform a new nucleation. This procedure was deemed necessary as at the beginning of precool the crystal had been close to the temperatures where 3He would have been able to dissolve into it. When the solid phase was regrown to the maximal size below the , we demagnetized the nuclear stage further to reach precooling temperatures below 0.5 mK.
As the precooling proceeded, we allowed a small amount of flow out of the superleak line to ensure that it was fully open. We had observed that if the cell-side end of the superleak was blocked by solid, its removal would result a harmful heat pulse to the cell. Furthermore, at the ultimate precooling temperature, we would switch the pure 3He QTF from sweep mode to the tracking mode to enable us to receive datapoints more rapidly, with as small excitation as possible. Then, we would start to remove 4He from the cell via the superleak line, slowly increasing flow from zero to the desired value making sure that no heat spikes would occur on the way. Towards the end, as the solid was running out, we slowly decreased the flow back towards zero, but leaving a small outward flow in place () for couple of hours to ensure that there would be no flow into the cell during the post-melting warm-up period. Any flow into the cell would regrow the crystal, which would cause heating as pure 3He and mixture phases would separate. The melting process took anything from a few minutes to a couple of hours, depending on the melting rate. The warm-up period was observed for several hours, or at least until the quartz tuning fork reading became more reliable indicator of temperature again, i.e. the width was 1 Hz or above. Next, if the nuclear stage temperature was still low enough, crystal was regrown and precooled again for a new melt, and if not, a new magnetization was commenced.
3 Thermal model
Here, we will shift the focus to the computational model of the system, which was required for temperature evaluations in the regimes where the QTFs were no longer sensitive. The thermal model of our experimental setup has already been discussed in Ref. Riekki_kappa , but we will repeat the key considerations here.
The heat balance equation for the main cell volume is
| (4) |
Here is the temperature of the liquid helium in the main volume, its heat capacity containing both pure 3He and mixture contributions. A dot above a symbol indicates time derivative. Different heat contributions are evaluated as follows. We assume, that the Kapitza resistance can be treated using the power law , where is temperature, the surface area, and and are constants to be determined. In our analysis we have combined and into one constant to give , which is the heat transmitted between the cell liquid and the nuclear stage through the plain cell wall. Then
| (5) |
is the heat flowing between the main volume and sinter volume through the connecting channel, where is a parameter depending on the tube dimensions, and is the 3He thermal conductivity Riekki_kappa ; Greywall1984 . When solid 4He is grown, or melted, 3He is transferred between pure 3He and mixture phase with associated latent heat , where is the phase-transfer rate, and and are the entropies of pure and mixture phase per mole of 3He Riekki2019 , respectively. Below about , we can use the low temperature approximation . represents the flow-dependent heat leaks in the system, while is the generic background heat leak to the cell main volume ().
Next, the heat balance equation for the heat-exchanger volume reads
| (6) |
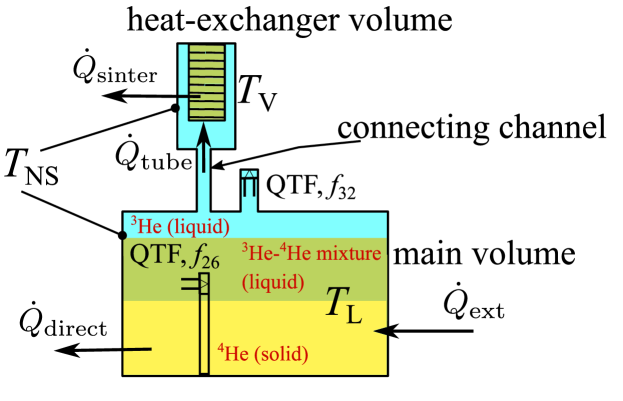
where is the temperature of the liquid in the sinter volume, and its heat capacity, while is the heat transferred between the liquid and the nuclear stage through the sinter Kapitza resistance and is from Eq. (5). Lastly, is the background heat leak arriving directly to the heat-exchanger volume, but it was immeasurably small and is omitted in the following. The heat flows and temperatures are illustrated in the simplified schematic of the cell in Fig. 6.
To finalize the computational model, we still need to determine the Kapitza resistance coefficients of the system (, , and ), the flow-rate dependent heating , as well as the background heat leak .
4 Kapitza resistances
4.1 Plain cell wall
The Kapitza resistance of the plain cell wall plays important role to the heat flow from the experimental cell to the nuclear stage at the beginning of the precooling process, whereas below the its contribution rapidly becomes negligibly small. At temperatures above the , we can simplify the cell main volume heat balance equation Eq. (4) to
| (7) |
since now it is safe to assume that the sinter volume is at the same temperature as the nuclear stage, 3He is in normal state everywhere, and because the amount of solid 4He usually does not change during precooling. Furthermore, we can ignore the background heat leak of order at these temperatures. Here W/(K m) Greywall1984 is the normal fluid 3He thermal conductivity.
We decreased the nuclear stage temperature stepwise and then observed the cooling of the cell main volume. To produce smoother derivative , we fitted an exponential () function to cell temperature data at each cooling step. Measured temperatures and these fits are shown in the inset of Fig. 7. Now, since we also know the properties of the connecting tube in the last term of Eq. (7), we are left with two parameters to be fitted: and . Comparison between the smoothed data and the data reproduced using the obtained Kapitza parameter values are shown in the main panel of Fig. 7, where the model calculation was performed using the original measured data (not the exponential fits).
Before the demagnetization begins, the independently measured and deviate from each other more than our thermal analysis suggests, which may be in part a result of inaccuracy in our nuclear stage PLM-thermometer calibration, or fork calibration, or both, at these high temperatures. If we scale up by 5% to match the readings, the recomputed Kapitza parameter values from left to right in Fig. 7 will read (, ), (, ) and (, ). It is evident that the unadjusted overestimates the Kapitza resistance while the constant scaling across the entire temperature range likely gives too low values. Therefore we took an average value of those as our final parameters. Furthermore, our approximations are no longer quite as good when we get closer to the , making the fit to the last precooling step the most unreliable of the three. After analyzing five more similar datasets as in Fig. 7, we ended up with average values and , where the confidence bounds were determined as the standard error of the fitted parameter values. The estimated cell wall area is giving us as the area-scaled constant . The exponent is close to the theoretical value 3 from the acoustic mismatch model, while the prefactor is about 1000 times larger than typically found in sintered heat-exchangers Voncken_sinter .
4.2 Sinter
To study the Kapitza resistance parameters of the sinter ( and ), we grew, or melted, a small amount of solid 4He periodically below the and observed the relaxation of the system across a certain temperature span at an approximately constant nuclear stage temperature , example of which is shown in Fig. 8. By changing the amount of solid 4He, we altered the amount of 3He–4He mixture in the main volume of the cell. Since mixture is the main contributor to the total heat capacity of the cell well below the , this gives us an opportunity to map the Kapitza parameters over a large span of thermal loads.
The fitting process is not as straightforward as in Section 4.1 for the plain cell wall Kapitza coefficients, because the thermal conductivity of the channel connecting the two cell volumes Riekki_kappa now also plays a more important role, and the heat-exchanger volume temperature can no longer be assumed to be equal to the nuclear stage temperature. Thus, we simulated the entire system using equations of Section 3 and varied the Kapitza coefficients. During the fitting, we first chose , and then adjusted trying to make computed cell temperature match the measured one. The boundary condition during the fitting process was that each combination of and should result a constant Kapitza resistance value at the upper limit of our range of interest, 10 mK. This restriction made the fitting process more straightforward, and it ensured that the computational model kept behaving consistently above the . The result of the analysis is shown in Figs. 9 and 10.
Figure 9 relates to the measurement of Fig. 8, where Fig. 9a illustrates how changing either only the exponent , or the coefficient (without the 10 mK restriction) affects the simulated cooldown time. Next, Fig. 9b shows the fits with adjusted for each , demonstrating that is the most appropriate choice across the whole dataset. Another element in the analysis is the somewhat variant external heat leak to the experimental cell, effect of which is illustrated in Fig. 9c. Since the computed slope spread with typical range of is of same order as in the fits of Fig. 9b, we conclude that anything within and is acceptable by adjusting the heat leak accordingly. This provides the confidence bounds to our fitted parameters: and .
Figure 10 shows how these Kapitza parameters suit with two more measurements at other temperature spans. The data of Fig. 10a was obtained during stepwise melting run, and Fig. 10b during another stepwise growth run. The cooldown rates in Fig. 10a are reproduced slightly better with than with 1.7, which is as good as the other displayed options for Fig. 10b. The temperature range in Fig. 10a is already quite close to the saturation limit of our QTF thermometer, and thus is likely the least reliable of the presented datasets.

We should also acknowledge that the sinter Kapitza coefficient values are likely not the same throughout the entire temperature range. This was examined by analyzing the cooldown behavior close to the by plotting the time it took to cool from the to the with varying amounts of 3He in the system, illustrated in Fig. 11. Here, superfluid 3He still provides a significant contribution to the total heat capacity of the system. Each datapoint in Fig. 11 represents average time, taken over multiple precools with maximal 4He crystal sizes. They are compared against computed values, calculated by assuming that there is no mixture in the system, that the nuclear stage is at constant temperature, and that the background heat leak is constant . At these temperatures, the heat leak is small compared to the heat flow through the sinter and thus did not significantly affect the computed cooling times. As we chose here to keep the exponent unchanging, we found the best correspondence to the data with slightly reduced value. Nevertheless, the adjusted value is still within the limits of our confidence bounds. Since our region of interest lies mainly below 1 mK, we chose not to include any temperature dependence in to our computational model. Rather, we used the value when analyzing all our low temperature procedures, and kept an option to use a slightly smaller value while treating data near the .
| us | (mix)Oh1994 | (mix)Voncken_sinter | (3He-B)Voncken_sinter | (3He-B)Ahonen1978 | |||||
|---|---|---|---|---|---|---|---|---|---|
| 1.6 | 80 | 1 | 700 | 1 | 1100 | ||||
| 2 | 10..30 | 2 | 6.5 | 2 | 0.5 | ||||
| 1.8 | 20 | 3 | 0.0029 | 3 | |||||
| (2) | (12) | ||||||||
The determined , with sinter surface area, corresponds to the area-scaled prefactor . To enable comparison with the measurements made by others, we can round our determined Kapitza exponent to the closest integer value (2), and scale to maintain the constant Kapitza resistance at 10 mK to get . Oh et al. Oh1994 determined at 1 MPa that the Kapitza resistance between their sinter and saturated mixture followed exponent with the coefficient between depending on the magnetic field of their experiment. Voncken et al. Voncken_sinter , on the other hand, measured the Kapitza resistance of saturated mixture and sinter in situation where the phase-separation boundary was within the sinter, receiving either or 3, with or , respectively. The comparison is summarized in Table 2 which also includes the Kapitza resistances in 3He-B from Refs. Voncken_sinter and Ahonen1978 . Our heat-exchanger volume is mostly filled by pure 3He, but since there is 4He readily available in the system, all available surfaces are covered by it. This naturally includes the sinter, which is why our observed Kapitza resistance parameters are more in line with mixture parameters determined by others than with the values in 3He-B.
5 Helium isotope proportions
Throughout the experiment, we kept log of the total amount of 3He in the system, and how it was split between the different volumes. Initially, we had total of 700 mmol of 3He, but learned that about 1 mol was needed to have sufficiently large pure 3He phase both in the cell main volume and in the lower bellows placed within the dilution refrigerator.
Of the total 3He, 200-400 mmol was in the bellows volume to ensure that the mixture there was always at saturation. The heat-exchanger and the connecting channel required about 190 mmol of 3He to completely fill the open volume, and, based on the Kapitza resistance analysis of the previous section, we assume that the pores of the sinter were completely filled with saturated mixture. Since we had 11 g of sinter, with density and filling factor 0.5, we had 90 mmol of saturated (8.1%) mixture in trapped in the sinter, meaning we had additional 7 mmol of 3He stored in the heat-exchanger volume. The rest resided in the main volume of the experimental cell. It is not clear whether the mixture trapped in the sinter should be exactly at the bulk saturation concentration, but we deemed it a reasonable approximation.
The optimal amount of 3He in the main volume was about 400 mmol. Below that, at small 4He crystal sizes, the 3He QTF also became immersed in mixture, thus making it rather useless as a thermometer. Conversely, if there were a lot more than 400 mmol of 3He in the main volume the solid 4He phase could not have been grown to maximal size, as now the pure 3He phase took so much space.
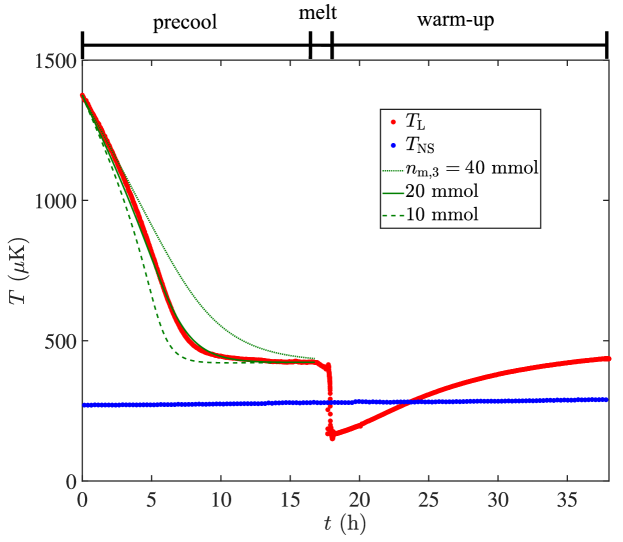
When the solid phase is present at millikelvin temperatures, the pressure of the system is fixed at , and the molar volumes of the phases are constant. The size of the solid phase was determined by tracking the total amount of 4He added to (or removed from) the cell through the superleak line starting from the nucleation. If 4He is transferred at rate , the solid is changing size at rate Riekki2019 . Since the total volume of the cell is known as well, the volume that is left, after solid 4He and pure 3He, can be assumed to be filled by saturated 3He–4He mixture. Below , when the entropy of pure 3He has become small compared to mixture, we can cross-check the mixture amount by observing the relaxation of the cell temperature toward the nuclear stage temperature. In Fig. 12, we illustrate how even a small assumed change in the mixture amount significantly alters the computed time constant of the process. When we had sufficiently undisturbed relaxation period, we could determine the mixture amount within the accuracy of . If we again take the total 3He amount as given, then the mixture amount fixes the solid 4He amount, enabling us to cross-check it against the amount determined from the 4He flow measurement. These two were always consistent within about 10%.
The relaxation time gives the total heat capacity, and thus entropy of the system, which is critically important in determining the lowest temperature obtained in the melting process. This is, of course, true within the confines of our QTF temperature calibration. If temperatures change across the board, the heat capacities and the helium amounts in different phases deduced from them naturally change as well.
6 Melting the solid
6.1 Analysis
To calculate the temperature of the liquid in the main volume of the cell, in situations where the QTF thermometer had become insensitive, we need to solve the system of differential equations Eqs. (4)-(6) for the sinter volume temperature , and the main volume temperature as a function of time. The initial value for was the reading given by the QTF thermometer, while the initial value was attained recursively starting from the mean value between the measured and .
In the following discussion, we focus on 6 precool–melt–warm-up runs that meet the following criteria: 1) the time between final crystal growth and start of the melt was sufficiently long so that we could determine the amount of mixture in the system from the relaxation time as in Fig. 12, as well as the pre-melting background heat leak from in the end, 2) the precooling temperature was low enough to make an attempt at sub-100 K temperatures viable, 3) melting process started without heat pulse caused by the removal of solid from the cell-side superleak end, and 4) the follow-up time after the melt was observed for long enough period to see the saturation temperature of the system and the post-melting background heat leak (again based on ), and the nuclear stage temperature was stable during this time. Figure 12 showed an example of a dataset fulfilling these criteria with different stages of the operation labeled. The precool stage is only the final precooling period, after the solid 4He was grown to maximal size.
Additionally, as further examples, we show 4 melts done above, or near, the , one melting done with the thermal gate operated as originally intended, one example of a melting performed using the bellows system, as well as one cyclical melting/growing process showing an asymmetric behavior between growing and melting the solid.
6.2 Heat leak during melting

(a) , , ,
(b) , , ,
(c) , , ,
(d) , , ,

(e) , , ,
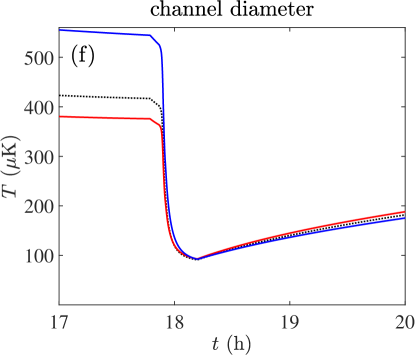
(f) , , ,
Heat leak, along with the melting rate and the amount of mixture prior to melting, are the most important quantities in determining the final temperature. The Kapitza resistance of the plain cell wall is so high at these temperatures that heat flow through it is practically zero. The heat flow through the sinter of the heat-exchanger volume is still notable, but the thermal conductivity of the connecting channel becomes so small that the main volume of the cell becomes effectively decoupled from the heat-exchanger volume as the melting is carried out.
The background heat leak will have two different values: the value before melting determined from the difference between and at the end of the precool, and the value after melting deduced from it long after the melting is done. The ratio of these two background heat leaks varied from 0.5 to 1.8.

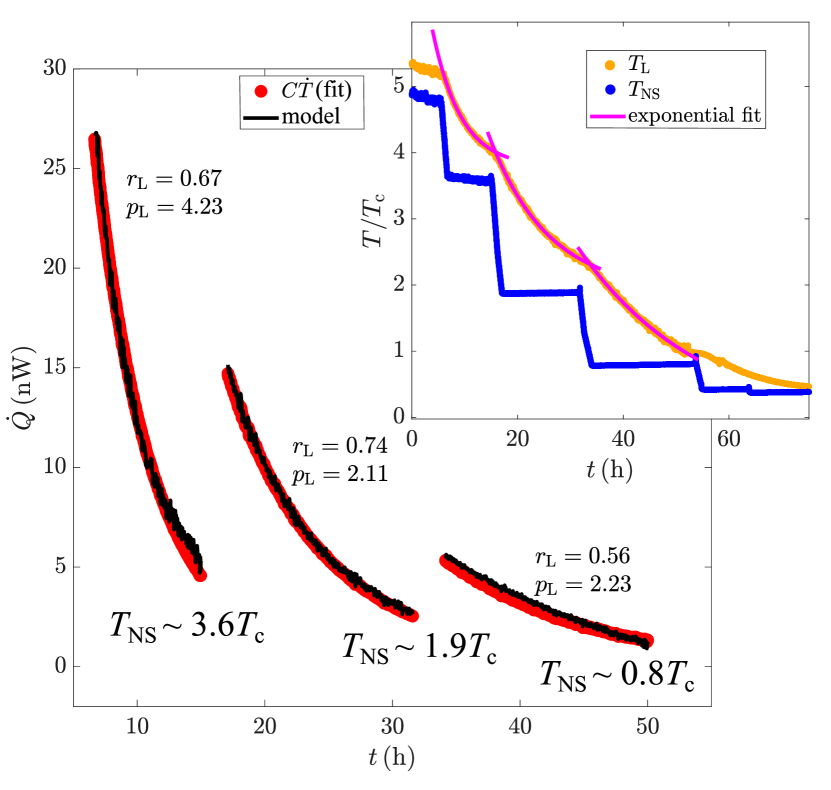
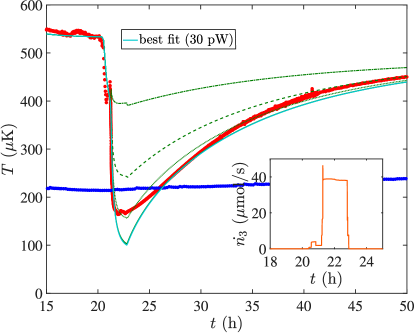
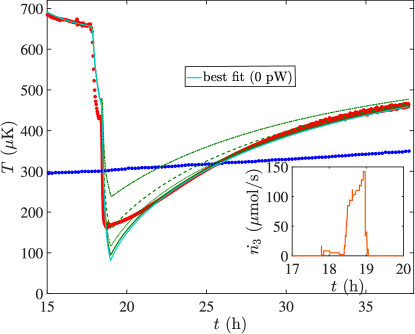
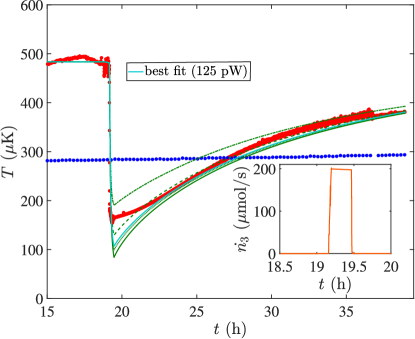
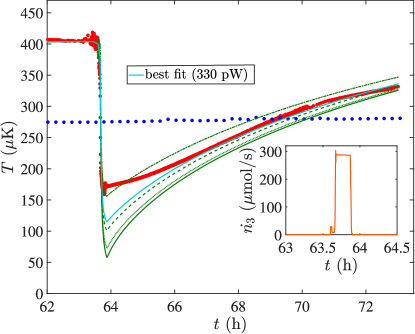
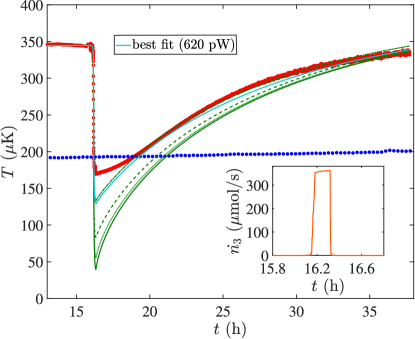
To deduce the relation between the melting rate and the heat leak in Eq. (4), the assumed value for was allowed to vary between 0 and 700 pW to find the best correspondence with the experimental data. The resulting collection of computed data are shown in Fig. 13, with the six melts fulfilling the criteria discussed in Section 6.1. The full solution to Eqs. (4)-(6) also includes the heat-exchanger volume temperature , but we omitted it from the figures for clarity. We sought value that would make the post-melting warm-up rate match with the QTF measured behavior. As said, at lowest temperatures, the QTF response was saturated and only around the reading became reasonably reliable once again. The criterion for the “best fit” was that the computed would not cross the measured value during the warm-up, but would approach it asymptotically at the earliest possible time.
When is below about no additional heat leak during the melt is resolved; in fact the heat leak can even appear to be less than the after-melting value. Then above the heat leak is rapidly increased ending up to more than with the highest phase-transfer rate of in Fig. 13e. The highest phase-transfer rate the superleak could sustain by 4He extraction was about , but the test run using that was not performed under appropriate conditions to be included in this analysis.
By subtracting the post-melting heat leak value from the “best fit” value during the melt, we get the heat leak identified as . Figure 14 shows as a function of the 3He phase-transfer rate , where the data falls on a third power dependence. The indicated uncertainty was in , and in . Only the parts of the error bars of the low melting rate data are visible on the logarithmic scale, while the measurements from Fig. 13c and 13e fall right on top of each other. The reason for the data to follow dependence is not understood. If the origin of this heat leak were viscous losses, it should follow behavior instead.
Now that we have evaluated the heat leaks, we can calculate the total heat load to the system at ultra-low temperatures (from the right side of Eq. (4)). We ignore the heat flow through the plain cell wall due to its massive Kapitza resistance, and as the superfluid 3He thermal conductivity in the connecting channel is already rather small. The graph in Fig. 15 is drawn with , the average of the post-melting heat leak values from Fig. 13, while
| (8) |
is based on Fig. 14, and we have Riekki2019 . Net positive values correspond to cooling in the system, and give the lowest achievable temperature around with 3He phase-transfer rate.
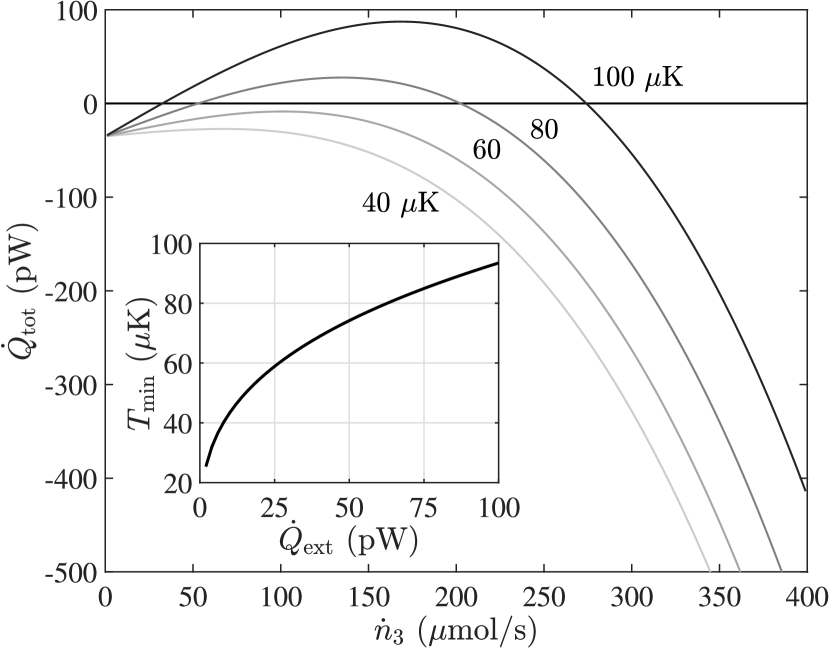
Below that rate, the cooling from the melting/mixing process is not enough to overcome the background heat leak, while above it the losses due to the flow rate become inefficiently large. At the optimal 3He phase-transfer rate
| (9) |
the minimum temperature is given by
| (10) |
and is shown in the inset of Fig. 15 as a function of the background heat leak . As a side note, the 3He phase-transfer rate and 4He extraction rate through the superleak are related by Riekki2019 .
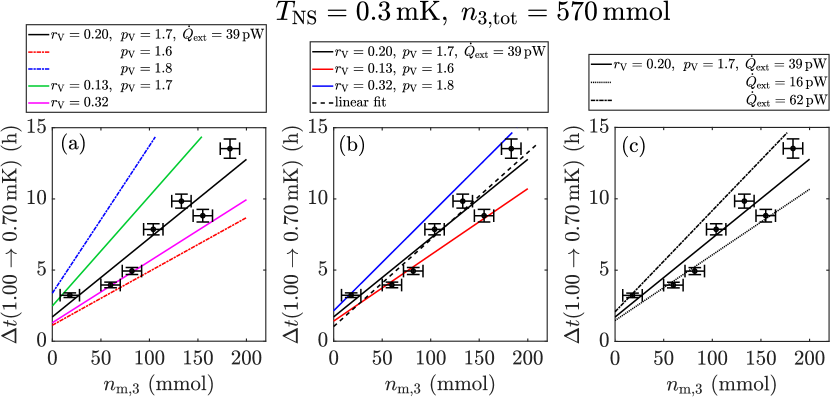
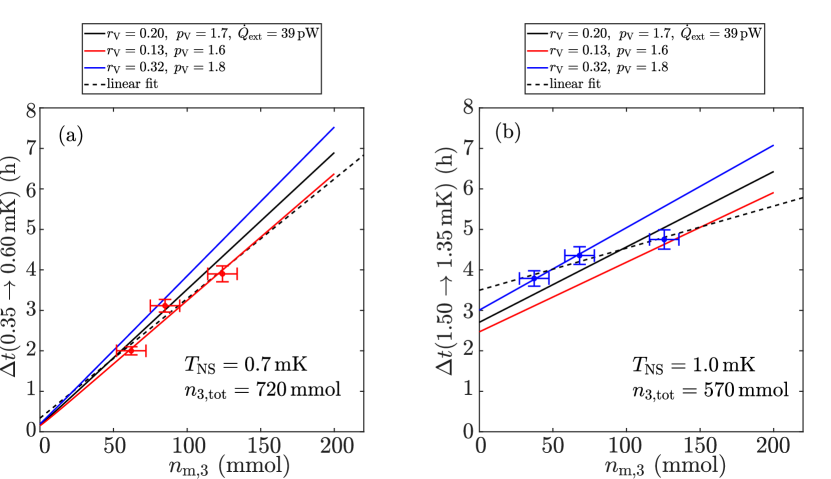
Unfortunately, the optimal set of conditions with regards to the total 3He amount, low precooling temperature and residual heat leak, as well as optimal melting procedure never met in the actual experiment. Instead, in attempts to compensate for the background heat leak, most of our melts gravitated towards using as high rates as reasonably possible, which now, in retrospect, after full analysis of the system, was not the optimal approach. As Fig. 15 clearly demonstrates, of range would have been the most beneficial.

(a) , , , ,
(b) , , , ,
(c) , , , ,
(d) , , , ,
(e) , , , ,
(f) , , , ,
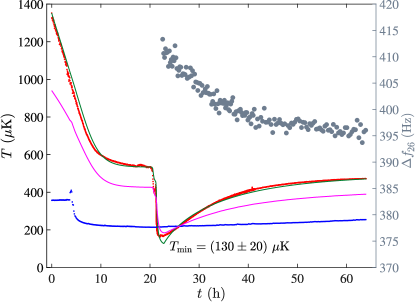
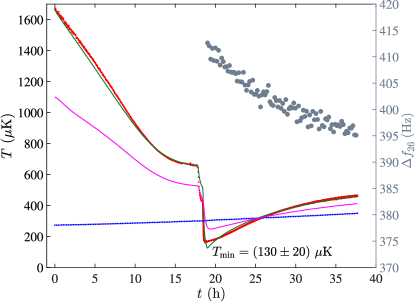
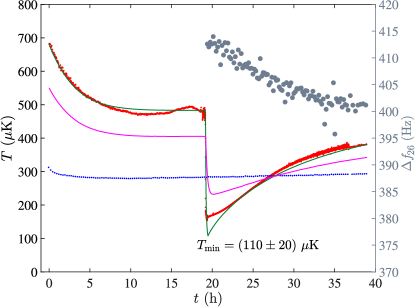
6.3 Lowest temperatures
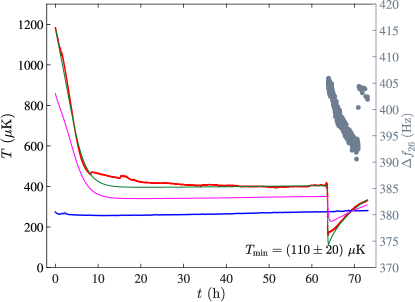
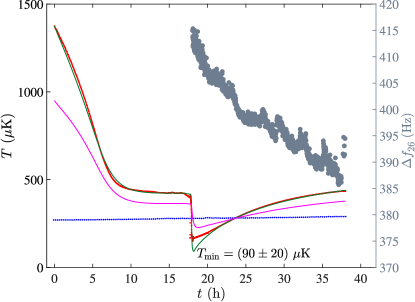
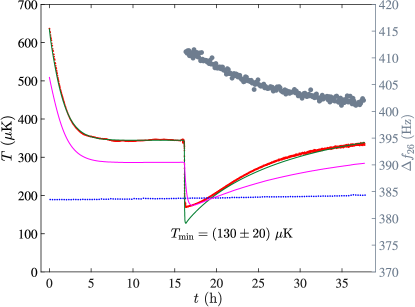
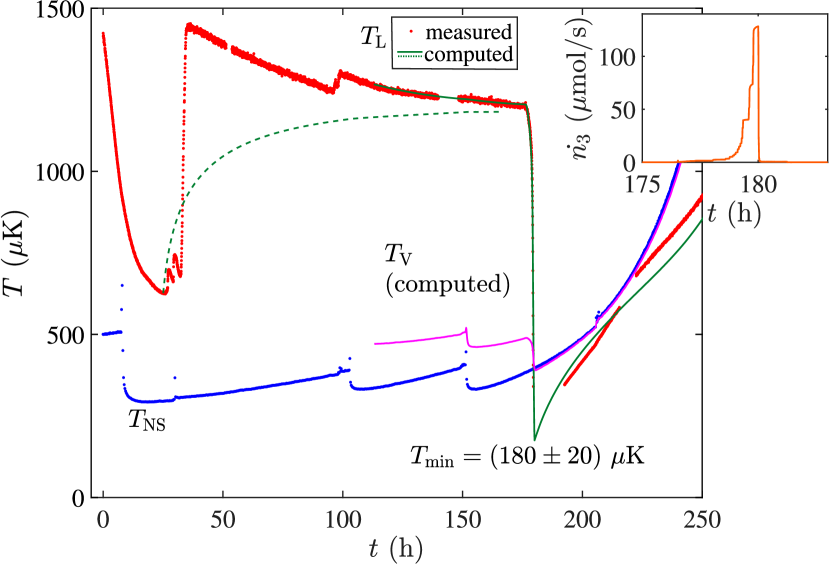
Having now all needed parameters, we can proceed to calculate the lowest temperatures obtained in the actual melts. These are shown in Fig. 16, where the subfigures correspond to the melts in Fig. 13. This time we present the data starting from the time when the final solid 4He growth was completed. Furthermore, the figure shows the calculated heat-exchanger volume temperature , and behavior of the mixture phase QTF as it emerges from solid at about the midpoint of the melt.
Comparing the lowest temperature achieved in Fig. 16a, with low melting rates to Fig. 16d and 16f, at high rates, we see that the increased phase-transfer rate did not result in a lower temperature, even with notably better precooling conditions due to the increased heat leak . The lowest temperature we obtain is in Fig. 16e with the phase-transfer rate of about . The confidence bounds in the temperature include the uncertainties in the helium amounts in different phases, in the temperature calibration of QTF, heat leaks, melting rate, and in the thermal transfer parameters of the system. Out of these, the initial amount of mixture and the heat leak were the most significant.
The response of the mixture fork as it emerges from the solid during the melt, and thus when the temperatures are at their lowest, is shown on the right y-axes of Fig. 16. The points displayed are five-point averages from the measured values. In Figs. 16d-e, the mixture QTF was measured mostly in the tracking mode Pentti_Rysti_Salmela , resulting in more datapoints. But as the jump in 16d illustrates, as we switch from tracking to full-spectrum sweeps, the tracking parameters determined several days earlier, when the QTF was still out from solid, are no longer dependable. This is caused predominantly by drifting background signal beneath the resonance response. During the other runs, we used full sweeps to provide more reliable data, and between Figs. 16a-c and Fig. 16f, we decreased the number of sampling frequencies per sweep to improve data gathering rate.
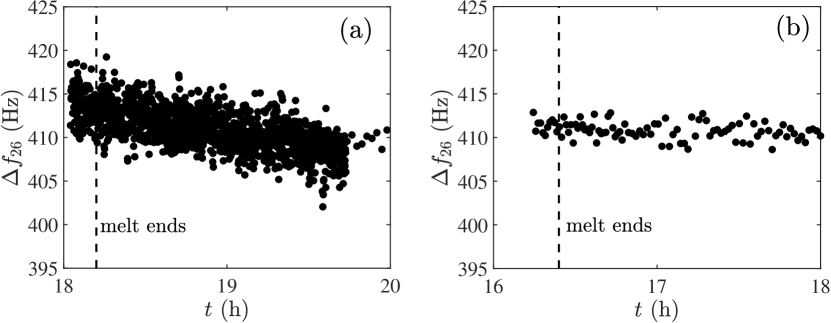
Figure 17 takes a close-up look of the mixture QTF data from Figs. 16e-f, except that the data presented now is not averaged. In Fig. 17a the data was obtained by the tracking mode, while in Fig. 17b it was received from narrow-span frequency sweeps. The QTF response shows no indication of the superfluid phase in mixture. When the QTF is released from solid and becomes measurable, the width stays approximately constant during the melt, starting to change only after it is over. Initially, the QTF is in its saturation regime (cf. Fig. 3) and does not respond to changes in temperature. But after the melt, when temperature has increased enough, some sensitivity is recovered. The slope in Fig. 17a may have been affected by the mentioned drift in the signal background during tracking. The unexciting response is in agreement with the determined lowest temperatures, as the mixture superfluid transition is expected to occur only at around Effective_3He_interactions . To reach that, the background heat leak should be below 8 pW, as given by Eqs. (9) and (10), and the optimal phase-transfer rate would be about .

In Fig. 18, we show the entropy of the system during an experimental run. In this example, we have used the computed temperature from Fig. 16e. During precool, the entropy deviates from the pure 3He entropy, as there is finite amount of mixture present, and its proportional entropy is the main contributor to the total entropy of the system below Riekki2019 . As the melt is started, the entropy initially follows the adiabatic behavior going horizontally away from the pure 3He curve towards the mixture curve. But, below , the heat leaks force the system to stay at an elevated temperature. At the end of the melt, there is still pure 3He phase present, which means that the actual entropy curve stops short of the mixture-only curve, but goes parallel with it during the warm-up period.
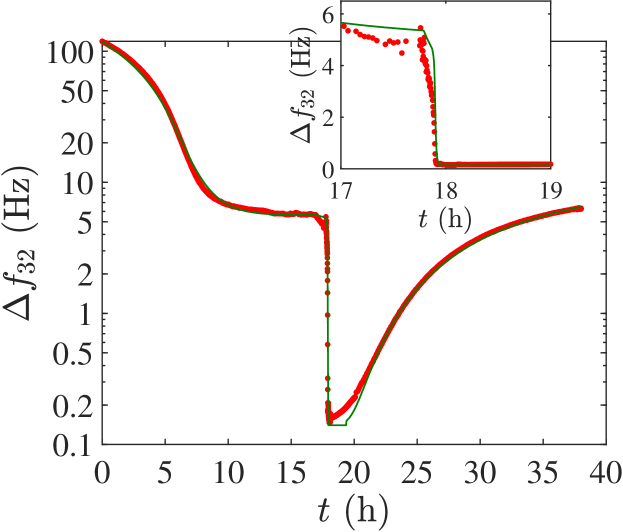
Finally, to provide further cross-check between the computed and measured temperature, Fig. 19 compares the measured resonance width of the pure 3He QTF to the value converted from the simulated cell main volume temperature (cf. Fig. 16e) using the calibration from Section 2.3. Note, that the residual width in the calibration was assumed to be 140 mHz which results the flat region in the computed values at the lowest temperatures. The maximum difference between the measured and calculated width is of order 1 Hz (20%), which occurred at the start of the melt. This can be due to the 4He film covering the QTF shifting, since we disturb the equilibrium by initiating 4He flow through the superleak. During the other melts discussed in Figs. 13 and 16 the maximum difference is of the same order.
6.4 Melts at higher temperatures


,
(a) , ,
(b) , ,
(c) , ,
(d) , ,
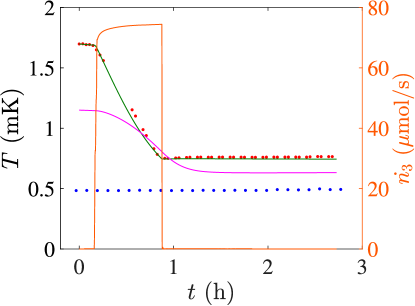
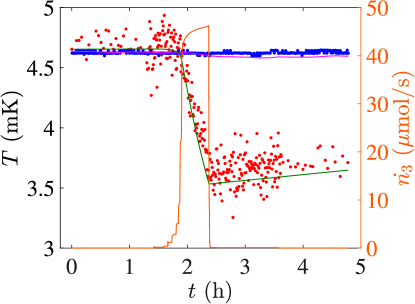
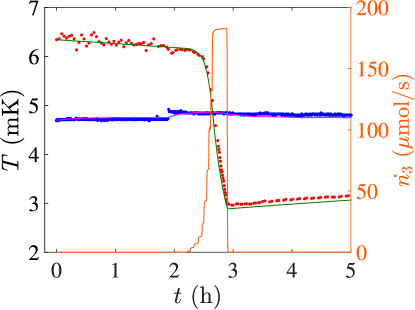
Figure 20 illustrates the correspondence between measured and computed temperatures in melts where the QTF-thermometer was still completely in reliable reading range. At these temperatures, the background heat leak of order tens of picowatts is practically irrelevant, so we simply chose to use largest value from Fig. 16. In some cases we needed to adjust the amount of solid before the melting from our logbook values, but the adjustment was always 10% or less. Also, the quality of the QTF measurement varies in these examples, because we tried different measurement methods in preparation for lower temperature operations. For example, in Fig. 20b, we used alternating full spectrum sweeps between 3He QTF and the mixture QTF, and tracking mode with as low excitation as possible in Fig. 20c. In Fig. 20d, we used the method that we found to work best: full sweeps right until melting, tracking mode during melt, and then full sweeps again after. All across the board, we could reproduce the measured within reasonable accuracy.
6.4.1 Thermal gate operation
As the experiment was planned, the thermal gate was supposed to be used at the end of the precool to isolate the main volume of the cell from the heat-exchanger volume in effort to minimize all heat leaks during the melting process (cf. Section 2.2.1). We learned, however, that the gate did not work as intended, which is demonstrated in Fig. 21. When the gate is open, from 0 to 25 h, the precooling proceeds towards sub-500 K temperature, as usual. But as soon as we start to close the gate by increasing pressure in its bellows, heating spikes appear in the main cell volume that become more severe as the gate is further shut off. We attribute this behavior to friction that occurs when the bellows operated stainless-steel ball is pressed against its saddle, either due to vibrations, or due to imperfect alignment. Furthermore, the volume of the TG bellows is small, and there were two lines connected to it; one was an ordinary capillary, while the other was a superleak line. This could make it possible for a sound mode to oscillate between the lines and cause mechanical vibrations in the system. In attempt to eliminate this possibility, we filled the TG bellows with 3He–4He mixture, to have the normal 3He component to dampen the modes, but to no avail.
The second shortcoming of the thermal gate idea was that its operation would only prevent heat leaks arriving to the heat-exchanger volume ( in Eq. (6)) from reaching the main volume, but would do nothing to the direct heat leaks there ( in Eq. (4)). The dashed green line in Fig. 21 illustrates the simulated temperature behavior under the assumption of no extra heating caused by closing of the gate. It is clear that the behavior calculated this way does not represent the actual course of events, as the temperature does not jump up enough. On the other hand, the value of the new equilibrium temperature is explained well by our computational model, as closing the thermal gate basically removes the contribution to Eq. (4) (in our calculations we reduced the conductivity of the channel in the closed state by a factor 15).
Closing the gate thus only removes a small contribution to total heat load of the main volume, an advantage lost because of the large extra heating caused by the operation of the gate.
6.4.2 Melting with the bellows system
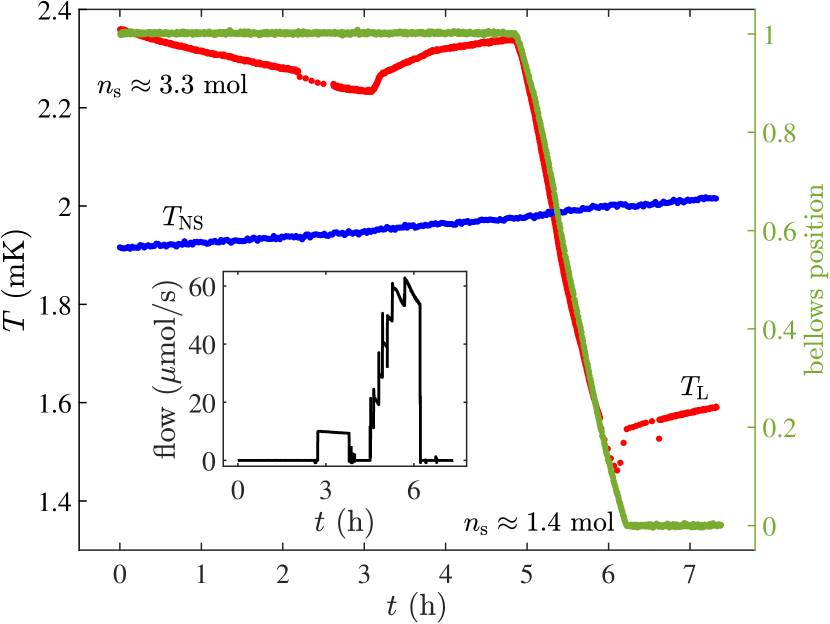
An alternative method to carry out the melting procedure was to use the bellows system placed within the dilution refrigerator of the cryostat, as described in Section 2.2.2. The idea behind it was that the bellows would separate the melting cell from anything above the dilution refrigerator temperature (), as now the 1 K end of the superleak line could be blocked with solid 4He, as it was no longer needed. However, we encountered several problems that made the utilization of the bellows challenging, which are illustrated in Fig. 22.
The first problem was that the bellows could not be moved enough to accommodate melting of the entire 4He crystal. The maximum initial solid amount was usually slightly over 3 mol, and even by fully using the range of the bellows we could melt only 60% of it. Secondly, when the bellows was near the limits of its movement range, it caused heating in the main volume of the experimental cell. In Fig. 22, when we began to pump the upper bellows near 3 h mark, the cell main volume immediately showed warming up, even if the bellows was not even moving. As the bellows eventually started to move, the solid was melted and the liquid in the cell cooled down as intended. When the bellows reached the other end of its range, another heat pulse in was observed. Since the heating was already a problem at 2 mK range, at sub-1 mK, as the cooling power of the melting process decreases rapidly, its effect would be even more detrimental. So, in order to avoid extra heating, we would have to keep the bellows from reaching either end of its movement capacity, but that would make the first problem even worse, i.e., we could melt even less of the total solid. The third, and final problem was that by using the bellows we sacrifice the ability to determine the amount of solid accurately, as then we cannot use the flow measurement to determine the extracted amount of 4He. We can, of course, convert the movement of the bellows to melted solid amount, but that would introduce more uncertainty in the estimations.
In conclusion, the drawbacks of the bellows operation outweighed the potential advantages, which is why we focused our efforts to perform the melts by pumping the superleak from room temperature.
6.4.3 Extra heating during solid growth
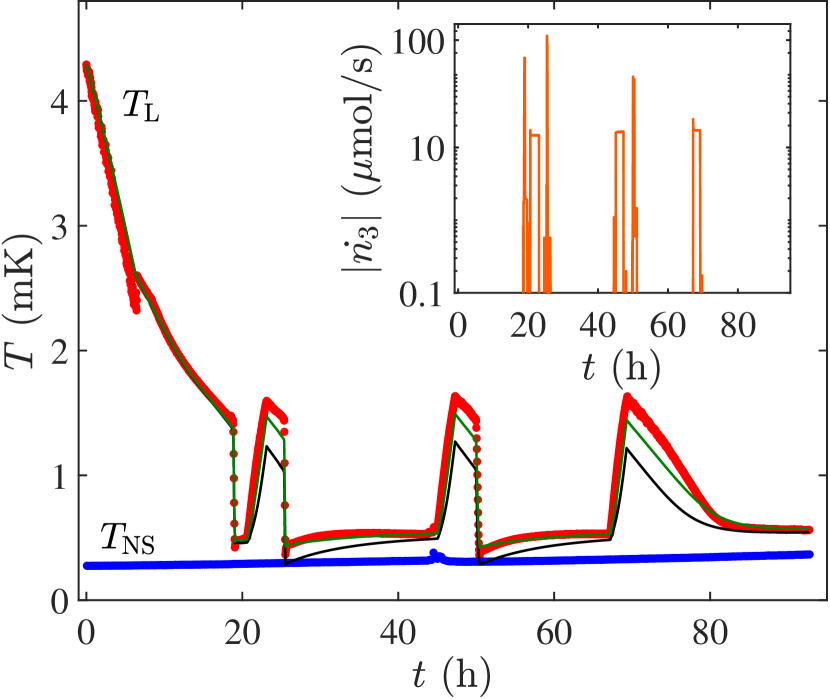
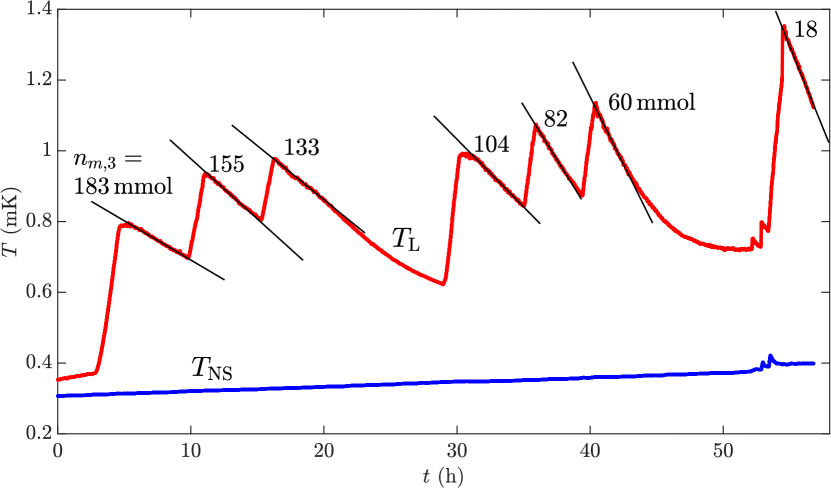
As we have described in the previous sections, our computational model can reproduce precools and melts throughout the entire temperature range. But during the growths of the solid 4He, it requires further tuning. As an illustrative example of this, in Fig. 23 we have first a precool from 4 mK to 1.5 mK, followed by a partial melt bringing temperature to about 0.5 mK. Almost immediately after, we grew the solid phase back to the initial amount, then observed the precool for a short while before melting the solid once again. After recording the post-melting warm-up period, the sequence was repeated. Then, after the third growth, we chose to observe the post-growth precool period longer instead. The solid amount before the melts was about 2.9 mol, and 1.2 mol at their ends.
Our initial attempt to replicate the measured temperature with the computational model resulted the black line in Fig. 23. The background heat leak was 50 pW, determined from the post-melting relaxation, and as the flow-dependent heat leak we used , from Eq. (8). During growths, the latent heat from the transfer of 3He from mixture to pure phase plus are not sufficient to cause to increase enough to meet the measured values. On the other hand, during the melts, the computed temperature falls below the measured values.
To make the temperatures match, we found it necessary to add more heating to the growth periods. This turned out to be a balancing act, as extra heating during growths caused the calculated temperature at the end of the melt to be increased as well (due to the increased starting temperature, naturally). We could not make both the initial and final temperatures match perfectly, but the best attempt is shown as the green line in Fig. 23, where additional of heating is added to the growth periods. The additional heating seemed not to relate to the growth rate, as did , discussed in Section 6.2. But rather, it appeared to depend on the crystal size — when there was just a small amount of solid, this additional heating was larger than when the crystal was big. This suggests that surface energies are involved, although the detailed account for this effect remains an open question. Treiner Treiner1993 found, using the theoretical framework of Ref. Pavloff1991 , that a single 3He atom introduced to a partly solidified 4He system would preferably bind on the first liquid 4He layer on the surface of the solid 4He phase. How this applies to a system, where plenty of 3He is available needs further considerations, but if there is excess 3He on the solid surface, that might play a role in the observed asymmetric behavior between growing and melting the crystal.
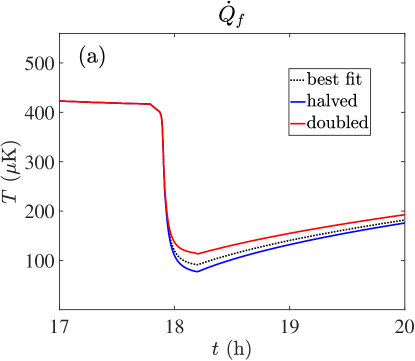
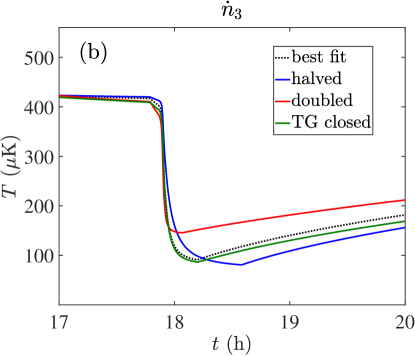
6.5 Simulations with modified parameters
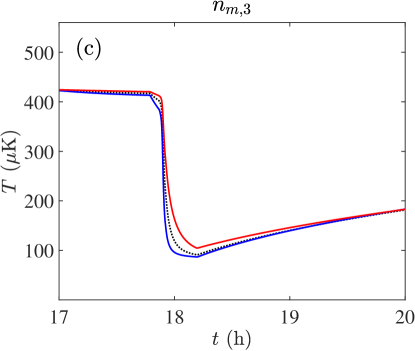
Finally, we take a look at how modifying certain experimental details would affect the computed melting behavior. We focus on the melt presented in Fig. 16e, as it resulted the lowest calculated temperature so far. The main source of heat was the flow-dependent heat leak . In Fig. 24a, we have halved or doubled the numerical prefactor in , resulting in approximately decrease, or increase in the lowest temperature, respectively. Next, in Fig. 24b, we have kept the original numerical prefactor, but modified the phase-transfer rate . The plot was constructed keeping the final solid amount constant, which is why the double-rate melt takes less time than the original one, and opposite for the half-rate melt. Doubling has dramatic adverse effect to the ultimate temperature, as the flow-dependent heat leak rapidly increases. In fact, having halved the rate would have resulted in about lower temperature. The additional line in Fig. 24b demonstrates the melting behavior under the assumption that the thermal gate could be closed right before initiating the melt without additional heating. Since the majority of the heat leak () arrives to the main volume of the cell, closing off the heat-exchanger volume does not significantly decrease the total heat load to the melting process, and the lowest temperature is thus almost unchanged. Then, Fig. 24c shows that even decreasing the amount of initial mixture does not help to bring the final temperature down as long as the relatively large is in place. Increasing mixture, on the other hand, would further hamper the performance, because then the before-melting state would contain additional entropy.
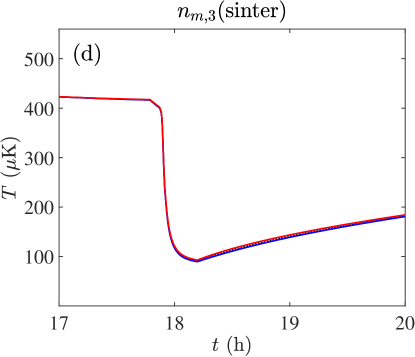
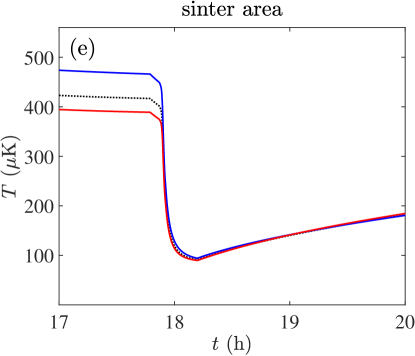
Figures 24d-f demonstrate parameters that do not have much effect on the ultimate temperature. Since the amount of mixture in the heat-exchanger volume is small (7 mmol), and the volume is separated from the main volume by the poor thermal conductivity of the connecting channel, its alteration results in only minuscule effect at the lowest temperatures. In the last two subfigures, we alter the thermal connection between the nuclear stage and the experimental cell by changing the amount of sinter (Fig. 24e), or modifying the dimensions of the connecting channel (Fig. 24f). Better thermal contact results in decreased precooling temperature, as expected. But, during the melt, the heat flow from nuclear stage to the cell is also increased resulting in almost no net change in the lowest achievable temperature. The same outcome, but in reversed order, is true for reduced thermal contact.
Thus, the most critical aspect in improving the setup is to take care of the heat leaks. The most important is the background external heat leak , and not the flow-dependent heat leak , even if it currently was the most significant contribution to the total heating. If we were able to significantly reduce, or even completely remove, , we could melt the crystal at low enough rate for to have less effect. Since at present, was still significant, we were led to combat it by increasing the melting rate, which ended up causing further heating problems. In reality we can never completely get rid of , so the solution is two-pronged; reduce the background heat leak as much as possible, while at the same time improve the superleak performance in hopes to reduce . After that, if the heat leaks were under control, the next step is to reduce the amount of mixture in the state before the melt. Improving the precooling temperature comes in question only if there is a reliable, non-heating, way to isolate the heat-exchanger volume from the main volume.
7 Conclusions and suggestions for future improvements
We studied a novel cooling method that operates with mixture of 3He and 4He, at the 4He crystallization pressure Pentti_Thermometry at the 3He saturation molar concentration Pentti_etal_solubility motivated by the search for the coveted superfluid transition of 3He in dilute 3He–4He mixture Effective_3He_interactions . The heart of the experimental setup consisted of a large melting cell (), and a separate sinter-filled heat-exchanger volume ( and surface area), with a pressure operated thermal gate in between.
In the method, the isotopes are first separated by growing solid 4He in the experimental cell, followed by a precool with an adiabatic nuclear demagnetization refrigerator to below . Then, the solid is melted, allowing 3He and 4He to mix in a heat absorbing process Riekki2019 . The final temperature depends on the initial entropy of the system, and on the heat leak during the melting process.
The major challenge in the data-analysis was that the quartz tuning fork resonators (QTFs) that were used for thermometry became insensitive at the lowest temperatures. Thus, we had to resolve in constructing a computational model of the system to determine the achieved temperatures. We showed that the Kapitza resistance of the plain cell wall followed with the exponent , and coefficient , while for the sinter the corresponding parameters were and .
The main factor limiting the lowest temperatures turned out to be the heat leak to the experimental cell during the melting procedure. We learned that it constituted of two parts: generic background heat leak, and the flow-rate dependent (and thus melting-rate dependent) contribution, of which the latter was most dominant at the melting rates employed. We concluded that the optimal 3He phase-transfer rate would have been around (corresponding to 4He extraction rate), and that during the experiment, we often used somewhat too large values. The lowest temperature obtained was ( Pentti_Thermometry ) with about phase-transfer rate, which would still correspond to record-low temperature obtained in 3He–4He mixture, and in pure 3He as well. But, we did not observe any indication of 3He superfluidity in the 3He–4He mixture phase.
We analyzed how changing different parameters would affect the performance of the setup, and came to a conclusion that to reduce the final temperature further the most essential thing is to reduce the heat load to the cell during the melting. To do that, we suggest to simplify the experimental setup further by removing the thermal gate completely. As we demonstrated, it did not live up to its purpose in reducing the heat leak to the main volume of the cell, since the majority of the background heat load was going directly to the main volume of the experimental cell, rather than was coming from the nuclear stage through the sinter. We showed, in fact, that the decreasing thermal conductivity of the connecting channel during the melt alone is sufficient to decouple the main volume and the heat-exchanger volume sufficiently from each other.
Another component to simplify would be the bellows system, since it did not provide a valid method to carry out the melting due to the excessive heating its movement caused, and since its range of motion did not allow us to melt the entire crystal. In place of the complicated bellows system, we should simply have a buffer volume at the dilution refrigerator temperature () to isolate the low-temperature section of the superleak from the high-temperature one. It may be beneficial to add a second buffer volume to the nuclear stage temperature () to isolate the melting cell from anything above the 3He . This would mean that the superleak line would then be made of three parts instead of two, adding a layer of complexity to the setup. But since the goal is to get rid of as much of the heat leak as possible, that option should be explored. As another note, the high-temperature end of the superleak should have a better thermalization to the still temperature () to enable us to block it with solid 4He more easily.
If the heat leak can be brought under control, the secondary aspect to take care of is minimizing the amount of mixture at the state before the melting, because the final temperature can be reduced in proportion to the reduction in the initial entropy. We could place the cell-side end of the superleak higher to enable us to grow more crystal, and reduce the volume of the pure 3He phase. We need only enough 3He in the main volume to saturate all the 4He released from solid, plus the amount required to keep the 3He QTF always in the pure phase. We could also move the mixture QTF higher in the main volume to have it become measurable sooner, as currently it was available only after half of the solid was already melted. An additional QTF could be installed to the heat-exchanger volume to monitor its temperature, which would enable us to gather more information on the thermal conductivity of the connecting channel.
In general, the thermometry is challenging when performing experiments at such ultra-low temperatures. A small step forward could be to have a 3He QTF with smaller dimensions that would improve the sensitivity to fluid damping. However, it appeared that the residual width is not solely caused by the intrinsic properties of the QTF, but by the 4He film covering it Riekki2019a , which presumably cannot be remedied by altering the QTF size. Even in the best case, a new oscillator would only postpone the QTF thermometry problem, as any mechanical oscillator will become insensitive near . It is out of the question to measure the liquid temperature by a PLM thermometer, because it is too slow to follow the rapid changes of the fluid temperature during melts. A plausible technique would be to utilize the quadratic temperature dependence of the crystallization pressure in mixture Pentti_Thermometry ; Rysti2014 ; Sebedash2006 . This would require a pressure gauge with about 1 mPa resolution at 2.5 MPa pressure, placing extreme demands on the stability and readout of the arrangement. Finally, another solution would be to use a magnon BEC thermometer that could, in principle, be used down to much lower temperatures than mechanical oscillators Autti2012 ; Heikkinen2013 ; Pete_thesis . To set it up, the experimental cell would need to have a non-metallic section to house the magnon sample and the NMR coils, introducing more complexity, and possibly heat leak sources, to the setup.
Regarding the thermal model, we also mentioned the peculiar asymmetric behavior between growing and melting the solid. We had to assume increased heating during growing periods to make the computations match with measured data. It tells us that some element is still missing from our model that warrants further study.
To reach the target range of temperatures , the background heat leak should be suppressed to below 10 pW, which does not appear as an entirely impossible task.
Acknowledgements.
This work was supported by the Jenny and Antti Wihuri Foundation Grant No. 00180313, and it utilized the facilities provided by Aalto University at OtaNano - Low Temperature Laboratory. The authors thank J. Rysti and J. T. Mäkinen for insightful discussions.———————
References
- (1) J. Bardeen, L.N. Cooper, J.R. Schrieffer, Phys. Rev. 108, 1175 (1957)
- (2) C.A. Ebner, Theory of dilute solutions of liquid in at low temperatures. Ph.D. thesis, University of Illinois (1967)
- (3) J. Bardeen, G. Baym, D. Pines, Phys. Rev. 156(1), 207 (1967). DOI 10.1103/physrev.156.207
- (4) M.K. Al-Sugheir, H.B. Ghassib, B.R. Joudeh, Int. J. Mod. Phys. B 20(18), 2491 (2006). DOI 10.1142/s0217979206034844
- (5) A. Sandouqa, B. Joudeh, M. Al-Sugheir, H. Ghassib, Acta Phys. Pol. A 119(6), 807 (2011). DOI 10.12693/aphyspola.119.807
- (6) J. Rysti, J.T. Tuoriniemi, A.J. Salmela, Phys. Rev. B 85, 134529/1 (2012). DOI 10.1103/PhysRevB.85.134529
- (7) J.J. Kinnunen, G.M. Bruun, Phys. Rev. A 91(4) (2015). DOI 10.1103/physreva.91.041605
- (8) F. Chevy, Phys. Rev. A 91(6) (2015). DOI 10.1103/physreva.91.063606
- (9) M. Delehaye, S. Laurent, I. Ferrier-Barbut, S. Jin, F. Chevy, C. Salomon, Phys. Rev. Lett. 115(26) (2015). DOI 10.1103/physrevlett.115.265303
- (10) R. Onofrio, Physics-Uspekhi 59(11), 1129 (2016). DOI 10.3367/ufne.2016.07.037873
- (11) I. Ferrier-Barbut, M. Delehaye, S. Laurent, A.T. Grier, M. Pierce, B.S. Rem, F. Chevy, C. Salomon, Science 345, 1035 (2014)
- (12) R. Roy, A. Green, R. Bowler, S. Gupta, Phys. Rev. Lett. 118(5), 055301 (2017)
- (13) M.D. Nguyen, A.M. Zimmerman, W.P. Halperin, Phys. Rev. B 99(5) (2019). DOI 10.1103/physrevb.99.054510
- (14) Y.M. Bunkov, J. Low Temp. Phys. 175(1-2), 385 (2013). DOI 10.1007/s10909-013-0933-3
- (15) Y.M. Bunkov, R.R. Gazizulin, Appl. Magn. Reson. 45(11), 1219 (2014). DOI 10.1007/s00723-014-0584-9
- (16) D.D. Osheroff, R.C. Richardson, D.M. Lee, Phys. Rev. Lett. 28(14), 885 (1972). DOI 10.1103/physrevlett.28.885
- (17) D.D. Osheroff, W.J. Gully, R.C. Richardson, D.M. Lee, Phys. Rev. Lett. 29(14), 920 (1972). DOI 10.1103/physrevlett.29.920
- (18) I. Pomeranchuk, Zh. Eksp. Teor. Fiz 20, 919 (1950)
- (19) Y.D. Anufriev, JETP 1, 155 (1965)
- (20) G.H. Oh, Y. Ishimoto, T. Kawae, M. Nakagawa, O. Ishikawa, T. Hata, T. Kodama, S. Ikehata, J. Low Temp. Phys. 95(3-4), 525 (1994). DOI 10.1007/bf00751787
- (21) A.P. Sebedash, JETP Lett. 65(3), 276 (1997). DOI 10.1134/1.567360
- (22) A. Sebedash, Physica B: Condensed Matter 284-288, 325 (2000). DOI 10.1016/s0921-4526(99)02678-2
- (23) J. Tuoriniemi, J. Martikainen, E. Pentti, A. Sebedash, S. Boldarev, G. Pickett, J. Low Temp. Phys. 129(5/6), 531 (2002). DOI 10.1023/a:1021468614550
- (24) A.P. Sebedash, J.T. Tuoriniemi, S.T. Boldarev, E.M.M. Pentti, A.J. Salmela, J. Low Temp. Phys. 148, 725 (2007). DOI 10.1007/s10909-007-9443-5
- (25) E. Pentti, J. Tuoriniemi, A. Salmela, A. Sebedash, J. Low Temp. Phys. 146(1/2), 71 (2007). DOI 10.1007/s10909-006-9267-8
- (26) S. Balibar, T. Mizusaki, Y. Sasaki, J. Low Temp. Phys. 120(5/6), 293 (2000). DOI 10.1023/a:1004669102741
- (27) S. Balibar, J. Low Temp. Phys. 129(5/6), 363 (2002). DOI 10.1023/a:1021412529571
- (28) C. Pantalei, X. Rojas, D.O. Edwards, H.J. Maris, S. Balibar, J. Low Temp. Phys. 159(3-4), 452 (2010). DOI 10.1007/s10909-010-0159-6
- (29) E.M. Pentti, J.T. Tuoriniemi, A.J. Salmela, A.P. Sebedash, Phys. Rev. B 78, 064509 (2008). DOI 10.1103/PhysRevB.78.064509
- (30) T.S. Riekki, A.P. Sebedash, J.T. Tuoriniemi, Phys. Rev. B 99(5) (2019). DOI 10.1103/physrevb.99.054502
- (31) A. Sebedash, S. Boldarev, T. Riekki, J. Tuoriniemi, J. Low Temp. Phys. 187, 588 (2017). DOI 10.1007/s10909-017-1755-5
- (32) T.S. Riekki, J. Rysti, J.T. Mäkinen, A.P. Sebedash, V.B. Eltsov, J.T. Tuoriniemi, J. Low Temp. Phys. 196(1–2), 73 (2019). DOI 10.1007/s10909-018-02141-y
- (33) T.S. Riekki, J.T. Tuoriniemi, A.P. Sebedash, arXiv:1907.05197 (2019)
- (34) F. Pobell, Matter and Methods at Low Temperatures, 3rd edn. (Springer, 2007)
- (35) O.V. Lounasmaa, Experimental Principles and Methods Below 1K (Academic Press Inc. (London), 1974)
- (36) S. Balibar, H. Alles, A.Y. Parshin, Rev. Mod. Phys. 77(1), 317 (2005). DOI 10.1103/revmodphys.77.317
- (37) E. Pentti, J. Rysti, A. Salmela, A. Sebedash, J. Tuoriniemi, J. Low Temp. Phys. 165(3-4), 132 (2011). DOI 10.1007/s10909-011-0394-5
- (38) D.S. Greywall, Phys. Rev. B 33(11), 7520 (1986). DOI 10.1103/physrevb.33.7520
- (39) I. Todoshchenko, J.P. Kaikkonen, R. Blaauwgeers, P.J. Hakonen, A. Savin, Rev. Sci. Instrum. 85(8), 085106 (2014). DOI 10.1063/1.4891619
- (40) V.P. Peshkov, JETP Lett. 21(6), 162 (1975)
- (41) D. Kim, M. Nakagawa, O. Ishikawa, T. Hata, T. Kodama, Phys. Rev. Lett. 71(10), 1581 (1993)
- (42) S.T. Boldarev, R.B. Gusev, S.I. Danilin, A.Y. Parshin, Instrum. Exp. Tech. 54(5), 740 (2011). DOI 10.1134/s0020441211050101
- (43) S. Murakawa, M. Wasai, K. Akiyama, Y. Wada, Y. Tamura, R. Nomura, Y. Okuda, Phys. Rev. Lett. 108(2) (2012). DOI 10.1103/physrevlett.108.025302
- (44) R. Blaauwgeers, M. Blazkova, M. Človečko, V.B. Eltsov, R. de Graaf, J. Hosio, M. Krusius, D. Schmoranzer, W. Schoepe, L. Skrbek, P. Skyba, R.E. Solntsev, D.E. Zmeev, J. Low Temp. Phys. 146(5-6), 537 (2007). DOI 10.1007/s10909-006-9279-4
- (45) M. Kollar, D. Vollhardt, Phys. Rev. B 61(22), 15347 (2000). DOI 10.1103/physrevb.61.15347
- (46) D.S. Greywall, Phys. Rev. B 29(9), 4933 (1984). DOI 10.1103/physrevb.29.4933
- (47) A.P.J. Voncken, D. Riese, L.P. Roobol, R. Konig, F. Pobell, J. Low Temp. Phys. 105(1/2), 93 (1996). DOI 10.1007/BF00754629
- (48) A.I. Ahonen, O.V. Lounasmaa, M.C. Veuro, J. Phys. Colloq. 39(C6), C6 (1978). DOI 10.1051/jphyscol:19786117
- (49) J. Treiner, J. Low Temp. Phys. 92(1-2), 1 (1993). DOI 10.1007/bf00681869
- (50) N. Pavloff, J. Treiner, J. Low Temp. Phys. 83(5-6), 331 (1991). DOI 10.1007/bf00683631
- (51) J. Rysti, M.S. Manninen, J. Tuoriniemi, J. Low Temp. Phys. 175(5-6), 739 (2014). DOI 10.1007/s10909-014-1154-0
- (52) A. Sebedash, J.T. Tuoriniemi, S. Boldarev, E.M. Pentti, A.J. Salmela, AIP Conf. Proc. (2006)
- (53) S. Autti, Y.M. Bunkov, V.B. Eltsov, P.J. Heikkinen, J.J. Hosio, P. Hunger, M. Krusius, G.E. Volovik, Phys. Rev. Lett. 108(14) (2012). DOI 10.1103/physrevlett.108.145303
- (54) P.J. Heikkinen, S. Autti, V.B. Eltsov, J.J. Hosio, M. Krusius, V.V. Zavjalov, J. Low Temp. Phys. 175(1-2), 3 (2013). DOI 10.1007/s10909-013-0946-y
- (55) P.J. Heikkinen, Magnon bose-einstein condensate as a probe of topological superfluid. Ph.D. thesis, Aalto University (2016)