Modeling and analysis of medium-
resolution integrated-light spectra of
globular clusters in dwarf galaxies
Abstract
The study of ages, helium mass fraction (Y) and chemical composition of globular clusters in dwarf galaxies is important for understanding the physical conditions at the main evolutionary stages of the host galaxies and for constraining the build-up histories of large galaxies. We present the analysis of integrated-light spectra of 8 extragalactic and 20 Galactic globular clusters (GCs) using our population synthesis method. We calculate synthetic spectra of GCs according to the defined stellar mass functions using model atmospheres and stellar parameters (, , and ) set by theoretical isochrones. The main advantage of our method is the ability to determine not only chemical composition but also the age and mean Y in a cluster by modelling and analysis of Balmer absorption lines. The knowledge of Y and anomalies of light elements in star clusters is one of the key points for understanding the phenomenon of multiple stellar populations.
keywords:
galaxies: individual (M31, M33) - galaxies: dwarf: individual (NGC147, KKs3, ESO269-66) - galaxies: star clusters: abundances1 About our method
We use integrated-light spectra of globular clusters (GCs) and the method of model stellar atmospheres to derive ages, Y and chemical composition of the studied objects ([Sharina et al. (2018), Sharina et al. 2017] and references therein). Synthetic integrated-light spectra calculation is based on the plane-parallel, hydrostatic stellar atmosphere models by [Castelli & Kurucz (2003), Castelli & Kurucz (2003)]. The lists of atomic and molecular lines are taken from the R.L. Kurucz web site (http://kurucz.harvard.edu/linelists.html). In this work we use stellar evolutionary isochrones by [Bertelli et al. (2008), Bertelli et al. (2008)]. The calculated synthetic spectra of individual stars are summed according to the mass function by [Chabrier (2005), Chabrier (2005)]. Comparison of the shapes and intensities of the observed and the model Balmer line profiles allows us to derive the age, Y, and horizontal branch (HB) type of a GC. The influence of Y and age on the H lines is not equivalent. The temperatures of main-sequence turnoff stars become higher with the decreasing age. This means that the depths of the cores and wings of the Balmer lines simultaneously strengthen. Increasing of Y results in higher luminosities of hot HB stars and in the increasing of the depth of the cores and wings of the Balmer lines in their spectra. In hotter stellar atmospheres pressure broadening and H-continuum opacity non-synchronously diminish. As a result, the depths of the wings and cores of Hδ, Hγ, and Hβ change differently with the change of Y, because hot HB stars contribute mainly the blue part of the spectrum.
| Object | |||
|---|---|---|---|
| CBF 98 | 10.050.05 0 | 0.30 0 | -1.400.15 0 |
| 10.040.05 1 | – | -1.300.10 1 | |
| CBF 28 | 10.00.05 0 | 0.23 0 | -1.550.15 0 |
| KKs3 GC1 | 10.10.1 2 | 0.300.03 2 | -1.50.2 2 |
| ESO269-66 GC1 | 10.10.1 2 | 0.300.03 2 | -1.50.2 2 |
| SD09 GC7 | 10.00.1 3 | 0.300.03 3 | -1.80.1 3 |
| 9.90.12 4 | – | -1.50.2 4, -1.80.3 5 | |
| MayallII | 10.150.05 3 | 0.260.02 3 | -1.000.05 3 |
| 10.18 6, 10.08 7 | – | -0.950.09 6, -1.080.09 8 | |
| MGC 1 | 10.00.05 3 | 0.300.03 3 | -2.200.1 3 |
| 9.70.1 9 | – | -2.14 10 | |
| Bol 298 | 10.00.1 3 | 0.300.03 3 | -1.850.1 3 |
| 10.30.1 9, 10.13 11 | – | -2.14 10, -2.070.18 11 |
Notes:
0this work; 1Sharina et al. 2010; 2Sharina et al. 2017; 3Sharina et al. 2018;
4Sharina & Davoust
2009; 5Veljanoski et al. 2013; 6Meylan et al. 2001; 7Ma 2009;
8Huchra et al. 1991; 9Ma 2012; 10Mackey et al. 2007; 11Fan et al. 2011.
2 Results
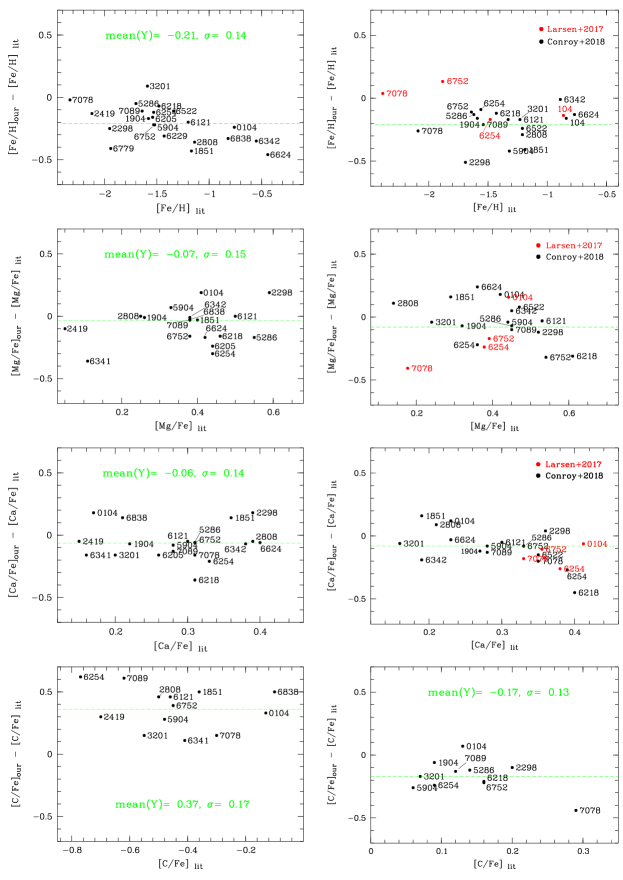
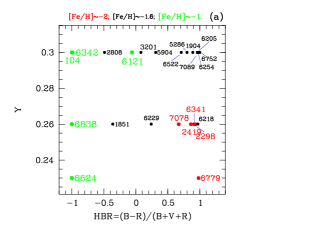
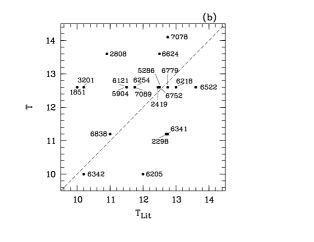
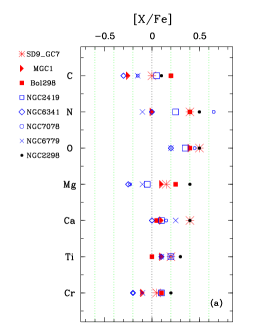
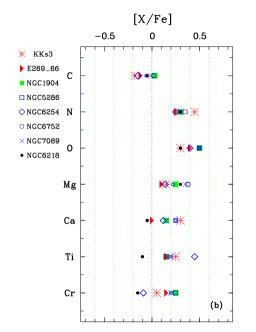
We use high signal-to-noise () medium-resolution (Å) integrated-light spectra of globular clusters in a wide spectral range (3900-5500Å) (e.g. [Sharina et al. (2017), Sharina et al. 2017]). The method is tested using spectra of Galactic GCs observed with the CARELEC spectrograph at the 1.93-m telescope of the Haute-Provence observatory and the spectra from [Schiavon et al. (2005), Schiavon et al. (2005)]. The results are shown in Fig. 1 and Fig. 2 (panels a and b). It can be seen that there is a systematic difference dex between the carbon abundances determined using our method and those from high-resolution spectroscopic studies (left panel of Fig. 1). Note that this difference disappears if we compare our measurements of with the corresponding values determined using integrated-light spectra (right panel of Fig. 1). We suggest that this difference is the result of the stellar evolution ([Sharina et al. (2017), Sharina et al. 2017]). Fig. 2 (panels a and b) shows that most of the clusters with high Y have blue horizontal branches and that for most of the studied objects the estimated ages agree with the literature values within Gyr.
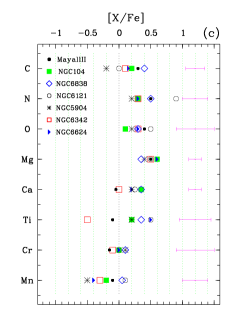
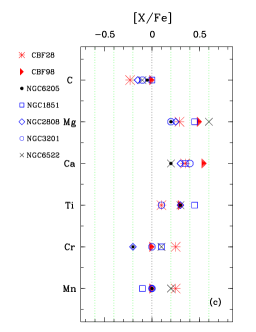
Table 1, Fig. 2 (panel c) and Fig. 3 present the results of the determination of ages, Y and elemental abundances for the studied extragalactic GCs. Elemental abundances for Galactic GCs of similar metallicities are shown for comparison in Fig. 2 (panel c) and Fig. 3. One can see that on average the chemical patterns look similar for massive extragalactic and Galactic GCs of similar metallicity.
|
|
|
|
|
|
Acknowledgements. This work is supported by the RFBR grant No. 18-02-00167 a.
References
- [Bertelli et al. (2008)] Betelli G., Girardi L., Marigo P., & Nasi E. 2008, A&A, 484, 815
- [Castelli & Kurucz (2003)] Castelli F. & Kurucz R.L 2003, in: Piskunov N. et al. (eds.), Modeling of Stellar Atmospheres, Proc. IAU Symposium No.210 (Dordrecht: Kluwer), p. A20
- [Chabrier (2005)] Chabrier G. 2005, in: Corbelli E., Palle F., (eds.), The Initial Mass Function 50 Years Later, Astrophysics and Space Science Library, 327 (Berlin: Springer-Verlag), p. 41
- [Conroy et al. (2018)] Conroy C., Villaume A., van Dokkum P. G., & Lind K. 2018, ApJ, 854, 139
- [Fan et al. (2011)] Fan Z., Huang Y.-F., Li J.-Z. et al. 2011, Research in Astronomy and Astrophysics, 11, 1298
- [Harris (1996)] Harris W.E. 1996, AJ, 112, 1487 (2010 edition)
- [Huchra et al. (1991)] Huchra J.P., Brodie J.P., Kent S.M. 1991, ApJ, 370, 495
- [Kurucz (1994)] Kurucz R.L. 1994, CD-Room No. 19–22. Smithsonian Astrophysical Observatory (Cambridge)
- [Larsen et al. (2017)] Larsen S. S., Brodie J. P., Strader J. 2017, A&A, 601, 96
- [Ma et al. (2009)] Ma J. et al. 2009, Research in Astronomy and Astrophysics, 9, 641
- [Ma et al. (2012)] Ma J. et al., 2012, Research in Astronomy and Astrophysics, 12, 115
- [Mackey et al. (2007)] Mackey A.D., Huxor A., Ferguson A.M.N., et al. 2007, ApJ, 655, L85
- [Meylan et al. (2001)] Meylan G., Sarajedini A., Jablonka P., et al. 2001, AJ, 122, 830
- [Pritzl et al. (2005)] Pritzl B.J., Venn K.A., Irwin M. 2005, AJ, 130, 2140
- [Roediger et al. (2014)] Roediger J.C., Courteau S., Graves G., Schiavon R.P. 2014, ApJS, 210, 10
- [Schiavon et al. (2005)] Schiavon R.P., Rose J.A., Courteau S., MacArthur L.A. 2005, ApJS, 160, 163
- [Sharina et al. (2018)] Sharina M.E., Shimansky V.V. 2018, Astrophysical Bulletin, 73, 318
- [Sharina et al. (2017)] Sharina M.E., Shimansky V.V., Kniazev A.Y. 2017, MNRAS, 471, 1955
- [Sharina et al. (2009)] Sharina M.E., Davoust E. 2009, A&A, 497, 65
- [Sharina et al. (2010)] Sharina M.E., Chandar R., Puzia T.H., Goudfrooij P., Davoust E. 2010, MNRAS, 405, 839
- [Veljanoski et al. (2013)] Veljanoski J., Ferguson A. M. N., Mackey A. D., et al. 2013, ApJ, 768, L33