Turbulent cascade, bottleneck and thermalized spectrum in hyperviscous flows
Abstract
In many simulations of turbulent flows the viscous forces are replaced by a hyper-viscous term in order to suppress the effect of viscosity at the large scales. In this work we examine the effect of hyper-viscosity on decaying turbulence for values of ranging from (regular viscosity) up to . Our study is based on direct numerical simulations of the Taylor-Green vortex for resolutions from to . Our results demonstrate that the evolution of the total energy and the energy dissipation remain almost unaffected by the order of the hyper-viscosity used. However, as the order of the hyper-viscosity is increased, the energy spectrum develops a more pronounced bottleneck that contaminates the inertial range. At the largest values of examined, the spectrum at the bottleneck range has a positive power-law behavior with the power-law exponent approaching the value obtained in flows at thermal equilibrium . This agrees with the prediction of Frisch et al. [Phys. Rev. Lett. 101, 144501 (2008)] who suggested that at high values of , the flow should behave like the truncated Euler equations (TEE). Nonetheless, despite the thermalization of the spectrum, the flow retains a finite dissipation rate up to the examined order, which disagrees with the predictions of the TEE system implying suppression of energy dissipation. We reconcile the two apparently contradictory results, predicting the value of for which the hyper-viscous Navier-Stokes goes over to the TEE system and we discuss why thermalization appears at smaller values of .
pacs:
47.10.A,47.11.Kb,47.15.kiI Introduction
Most planetary and astrophysical flows are highly turbulent. As a result, for a wide range of scales, the viscosity has no direct effect on the flow and so the flow evolves as if it were inviscid. Nonetheless viscosity cannot be neglected because it acts effectively at the smallest scales, converting the coherent energy of the flow into heat. It is thus essential in numerical simulations to resolve all scales: from the large scales, where energy is injected and which follow inviscid dynamics, to the smallest scales, where dissipation takes place. However, even with today’s computational power it is still impossible to achieve a resolution which is sufficient to simulate most atmospheric flows. Various methods have therefore been devised to model the small-scale dissipation in order to follow the inviscid dynamics of the large-scale flows while correctly capturing the dissipation rate at small scales. A popular model for spectral codes is the use of hyper-viscosity, meaning that the Laplacian of the standard viscous term is replaced by a higher power of the Laplacian. In this way the portion of the spectral resolution devoted to simulating the viscous wavenumbers is reduced, leaving a larger range of wavenumbers that evolve almost inviscidly. Indeed, hyperviscosity models have been shown to reproduce the turbulent evolution of the large scales, manifesting the Kolmogorov energy spectrum
| (1) |
where is the energy spectrum, is the wavenumber, is the energy dissipation rate and is the Kolmogorov constant.
However, the statistics of turbulent flows are not unaffected by this change of the dissipation term and various studies have been devoted to analyzing these undesirable effects of hyper-viscosity Borue and Orszag (1995, 1996); L’vov et al. (1998); Haugen and Brandenburg (2004); Lamorgese et al. (2005); Frisch et al. (2008); Spyksma et al. (2012). In particular, at small scales close to the dissipation range, hyper-viscosity is known to produce an aggravated bottleneck effect. The bottleneck effect is an accumulation of the cascading energy at wavenumbers just below the dissipation range, leading to a change in the power-law behavior of the energy spectrum. The bottleneck effect exists even for ordinary viscosity and has been the subject of many studies in turbulence (Falkovich, 1994; Lohse and Müller-Groeling, 1995; Martinez et al., 1997; Donzis and Sreenivasan, 2010; Küchler et al., 2019). With the use of hyper-viscosity, the bottleneck becomes more pronounced, even leading to a non-monotonic behavior of the energy spectrum. In fact it has been conjectured by Frisch et al. Frisch et al. (2008) that for sufficiently high order of hyper-viscosity, the bottleneck will take the form of a thermalized absolute equilibrium state discussed by Kraichnan (Kraichnan, 1973) in which energy is equally distributed among all Fourier modes, leading to an energy spectrum proportional to . This thermalized spectrum is realized in the truncated Euler equations, for which the Euler equations are solved in Fourier space while keeping only a finite number of Fourier modes. This system conserves exactly the inviscid quadratic invariants of the system. The argument of Frisch et al. (2008) for the appearance of the thermalized energy spectrum in hyper-viscous flows is that as the order of the hyper-viscosity is increased to very large values, it suppresses all energy above a wavenumber (determined by the value of the hyper-viscous coefficient) while leaving unaffected all wave numbers below. It thus acts as a Galerkin truncation, similarly to the truncated Euler equations. This result was verified with the use of the EDQNM approximation and for the one-dimensional Burgers equation. However, it has not been verified for the three-dimensional hyper-viscous Navier-Stokes equations.
In this work, we explore further the effect of hyper-viscosity carrying out high-resolution Direct Numerical Simulations (DNS) of the decay of a Taylor-Green vortex. Taking advantage of the symmetries of the Taylor-Green flow Brachet et al. (2013) and using a slaved time-stepping method Frisch et al. (1986) we have been able to perform many simulations at different orders of hyper-viscosity, reaching values that are sufficiently high to test the thermalisation conjecture.
II Definition of the system
II.1 Basic definitions
We consider the 3D hyper-viscous incompressible Navier-Stokes equations that control the evolution of the velocity field defined in and in a time interval :
| (2) |
where incompressibility is assumed, is the pressure, is the order of hyper-viscosity, and a hyper-viscosity coefficient. The periodicity of allows us to use the (standard) Fourier representation
| (3) | |||||
| (4) |
The kinetic energy spectrum is defined as the sum over spherical shells
| (5) |
and the total energy is
| (6) |
The dissipation rate of energy is given by
| (7) |
As increases, the dissipation is concentrated at increasingly large wavenumbers. We calculate the dissipation rate as the finite difference , since summing the expression (7) would multiply the small error in by a large factor .
II.2 Taylor-Green vortex
The initial condition we consider is the Taylor-Green (TG) vortex Taylor and Green (1937), which is given by
| (8) |
so that the total energy is given by . We non-dimensionalize by and , setting these to 1. Time is scaled by the advective time ().
The TG vortex is closely related to the von Kàrmàn (VK) swirling flow that has been the subject of many experimental studies Douady et al. (1991); Fauve et al. (1993); Maurer et al. (1994). The VK flow and the TG vortex have the same basic geometry: both consist of a shear layer between two counter-rotating circulation cells. The TG vortex, however, is periodic with impermeable free-slip boundaries (present as mirror symmetries) while the experimental flow takes place between two counter-rotating coaxial impellers and is confined inside a cylindrical container. The TG vortex also obeys a number of additional rotational symmetries.
The symmetries of the TG initial conditions (8) are preserved by the time evolution. These are, first, rotations by around the axes and , and by around the axis . A second set of symmetries corresponds to planes of mirror symmetry: , and . On the symmetry planes, the velocity and the vorticity are (respectively) parallel and perpendicular to these planes that form the sides of the so-called impermeable box which confines the flow. It is demonstrated in Brachet et al. (1983) that these symmetries imply that the Fourier expansion coefficients of the velocity field in (4) vanish unless are either all even or all odd integers. This can be used to reduce memory storage and speed up computations Lee et al. (2008); Pouquet et al. (2010) by a factor of 8. If this symmetry is not imposed, round-off errors can break the symmetries as the flow evolves. However, this bifurcation occurs significantly later than the times considered in the present study.
To simulate the evolution of the Taylor-Green flow we used the TYGRS (TaYlor-GReen Symmetric), a pseudospectral parallel code which enforces the symmetries of the TG vortex in 3D hydrodynamics within the periodic cube of length . Details of the code can be found in Brachet et al. (2013).
II.3 Choice of parameters
As the value of is varied, the value of must be adjusted accordingly. To attain high Reynolds numbers, should be as small as possible, subject to the constraint that the simulation be well resolved. To insure adequate resolution, we measured the energy spectrum at the time of maximum energy dissipation and verified that at large it follows an exponential law with the dissipation wavenumber such that . Here is the maximum wavenumber given by due to de-aliasing. The exponential law implies that the grid size is smaller than the hyper-viscous Kolmogorov lengthscale (where ) i.e. that . This in turn implies that for a fixed grid size, should be chosen to have an exponential dependence on given by . If we define the Reynolds number to be inversely proportional to the hyper-viscosity as then the value that can be achieved for a given resolution is
| (9) |
The high value of imposes additional demands on the time-integration scheme. Because of this, we used a modified exponential method, also called the slaved method Frisch et al. (1986), which is described in detail in Appendix A.
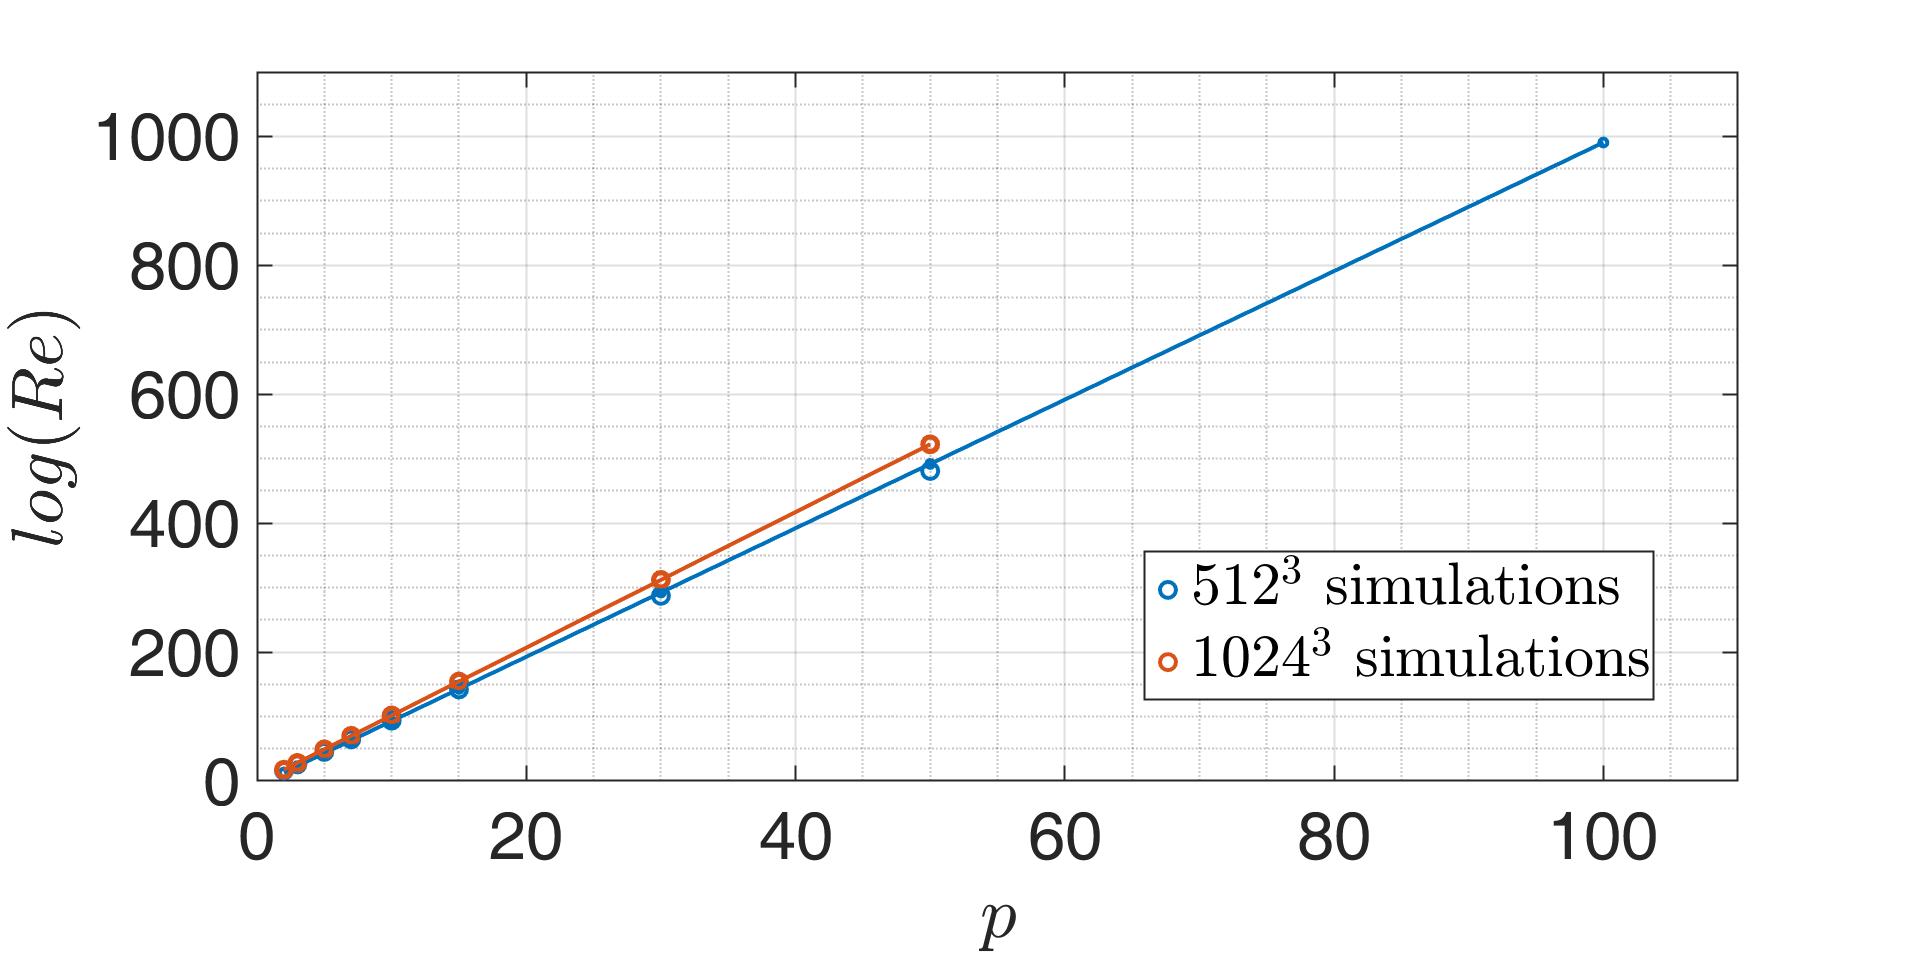
In the present study, we carry out two series of simulations, one with resolution , and another with resolution , in which we varied the value of from 1 to 100 or from 1 to 50, respectively. The scaling (9) of the parameters for our runs is shown in figure 1 for the two resolutions. In addition, we performed a simulation with at , which serves as a baseline case with which to compare our hyper-viscous runs.
III Results
III.1 Global Dynamics
The top panel of figure 2 shows the evolution of the energy as a function of time from the simulations at resolution . The bottom panel shows the energy dissipation rate. In both panels, the results are compared with the results from the simulation with ordinary viscosity and the higher numerical resolution .
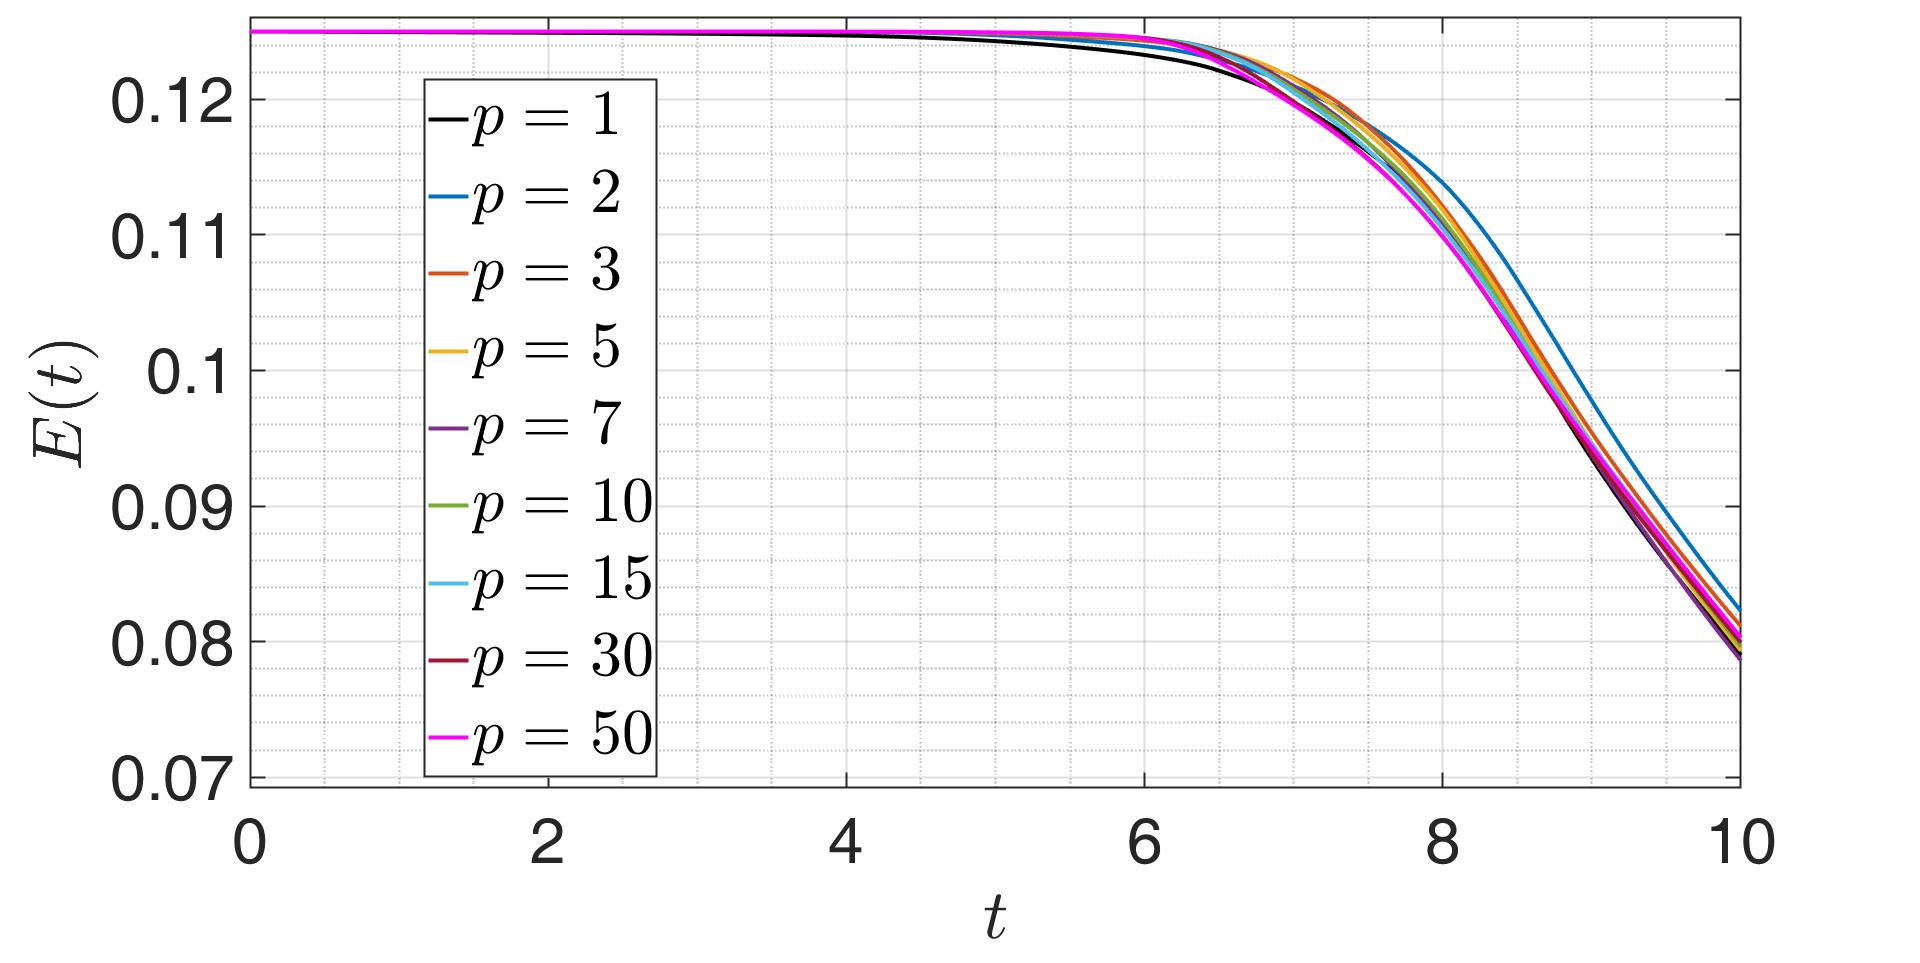
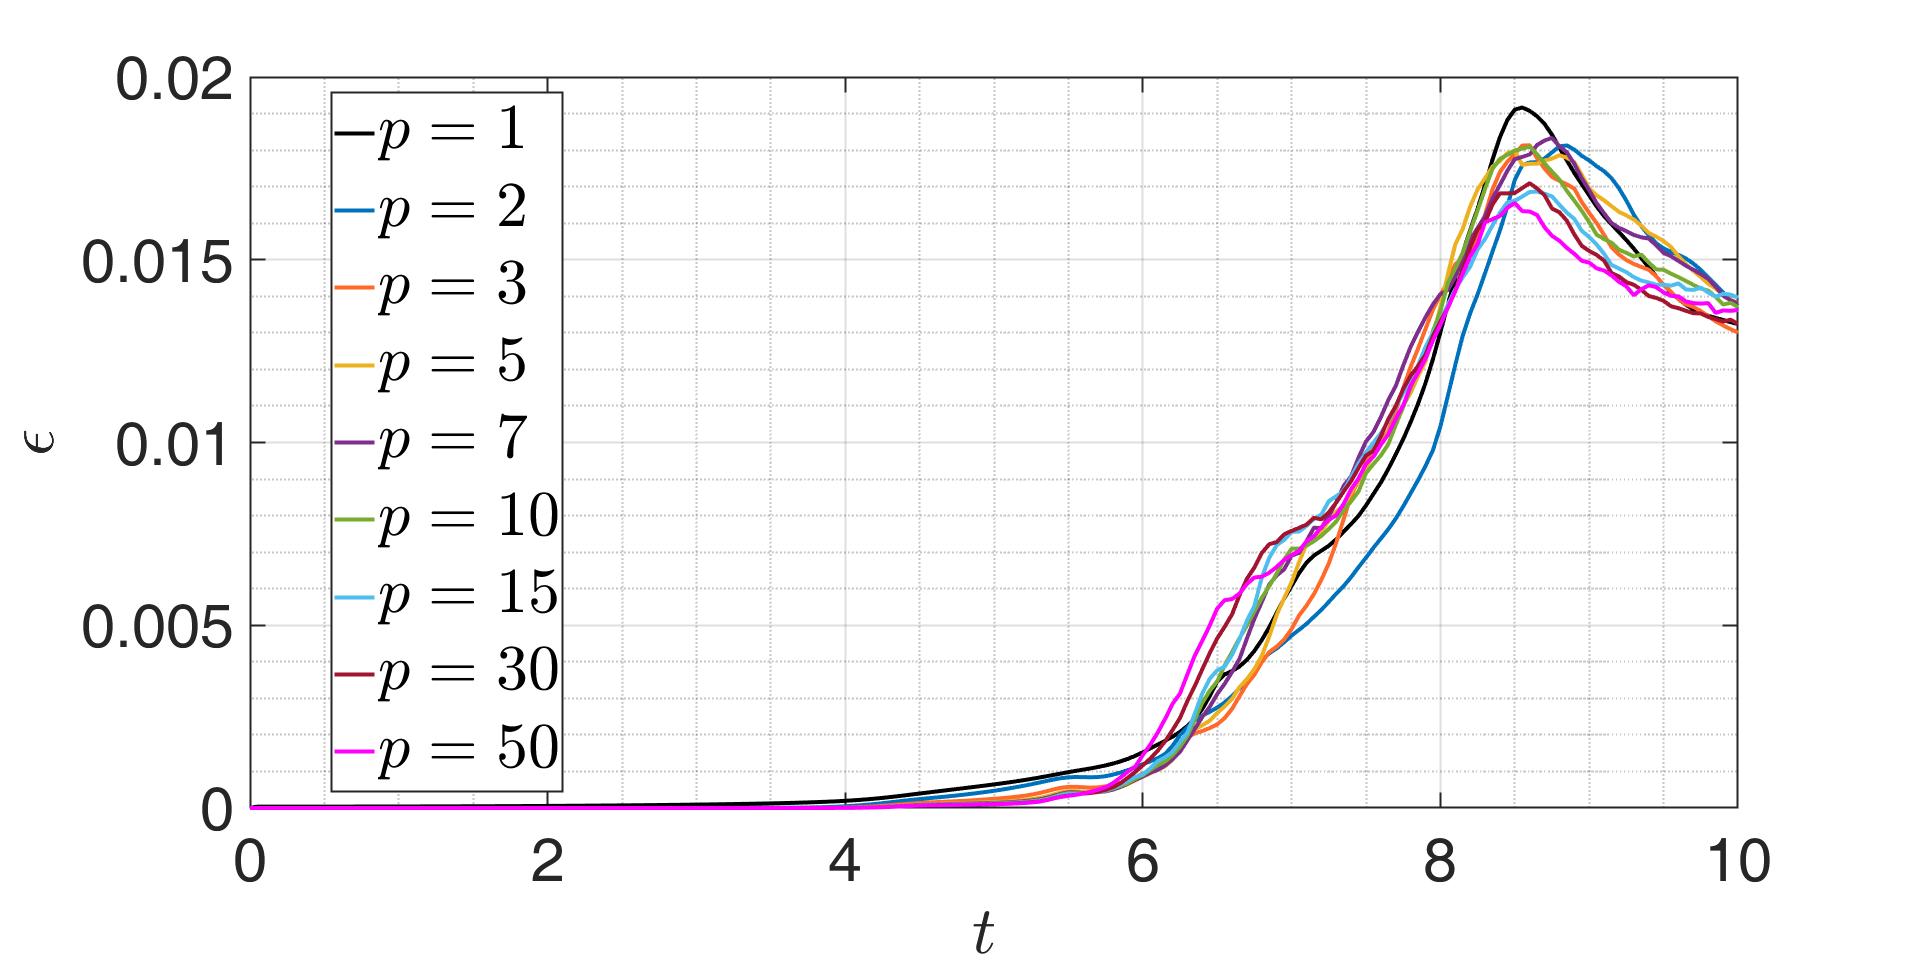
Surprisingly, even for the largest values of used, both the energy and the energy dissipation rate are very close to those of the high-resolution run with ordinary viscosity, with the peak dissipation occurring at . Thus, despite the very different mechanisms used to dissipate the energy, the global dynamics of the system have not been altered. This indicates that at this resolution, the rate that energy is dissipated is controlled by the large scale dynamics and the energy cascade and not the exact dissipation mechanism.
III.2 Energy Spectra
The global dynamics alone do not, however, guarantee that hyperviscosity correctly models the effect of turbulence at the larger scales. In figure 3, we show in the top panel the energy spectra from the simulation with ordinary viscosity and resolution at eight different times, and in the bottom panel the energy spectra from the simulation at resolution .
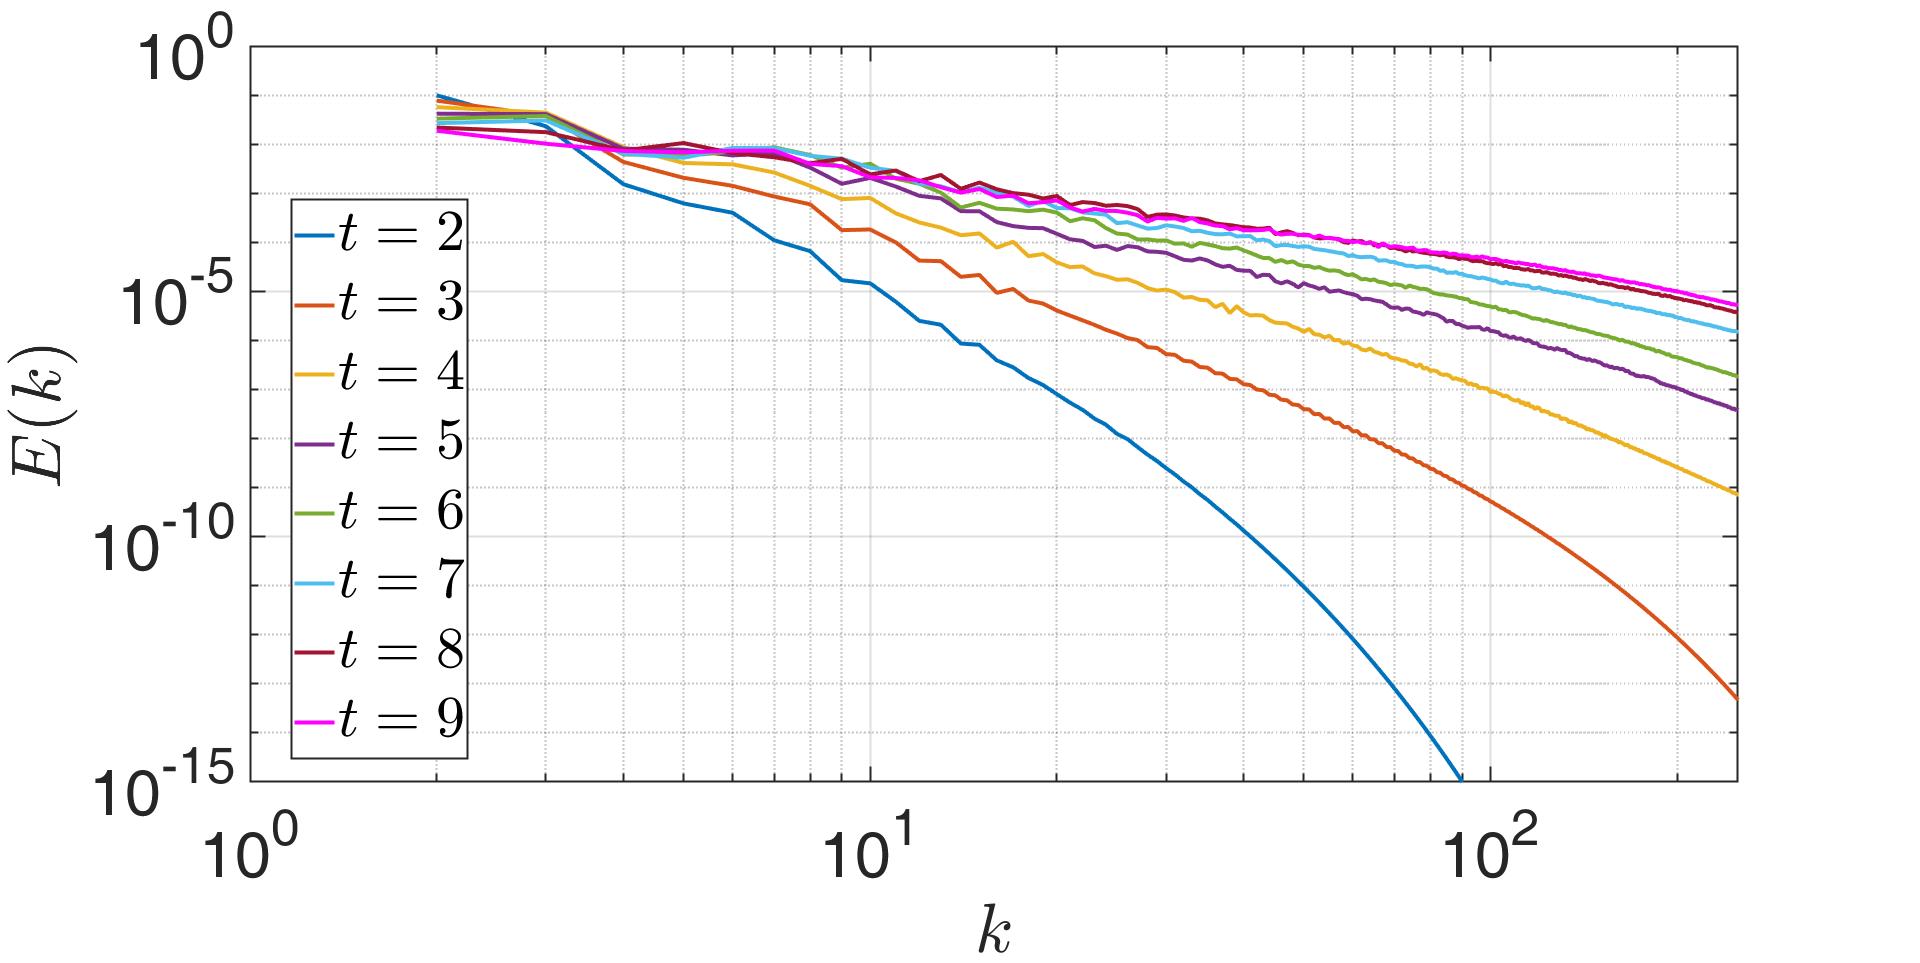
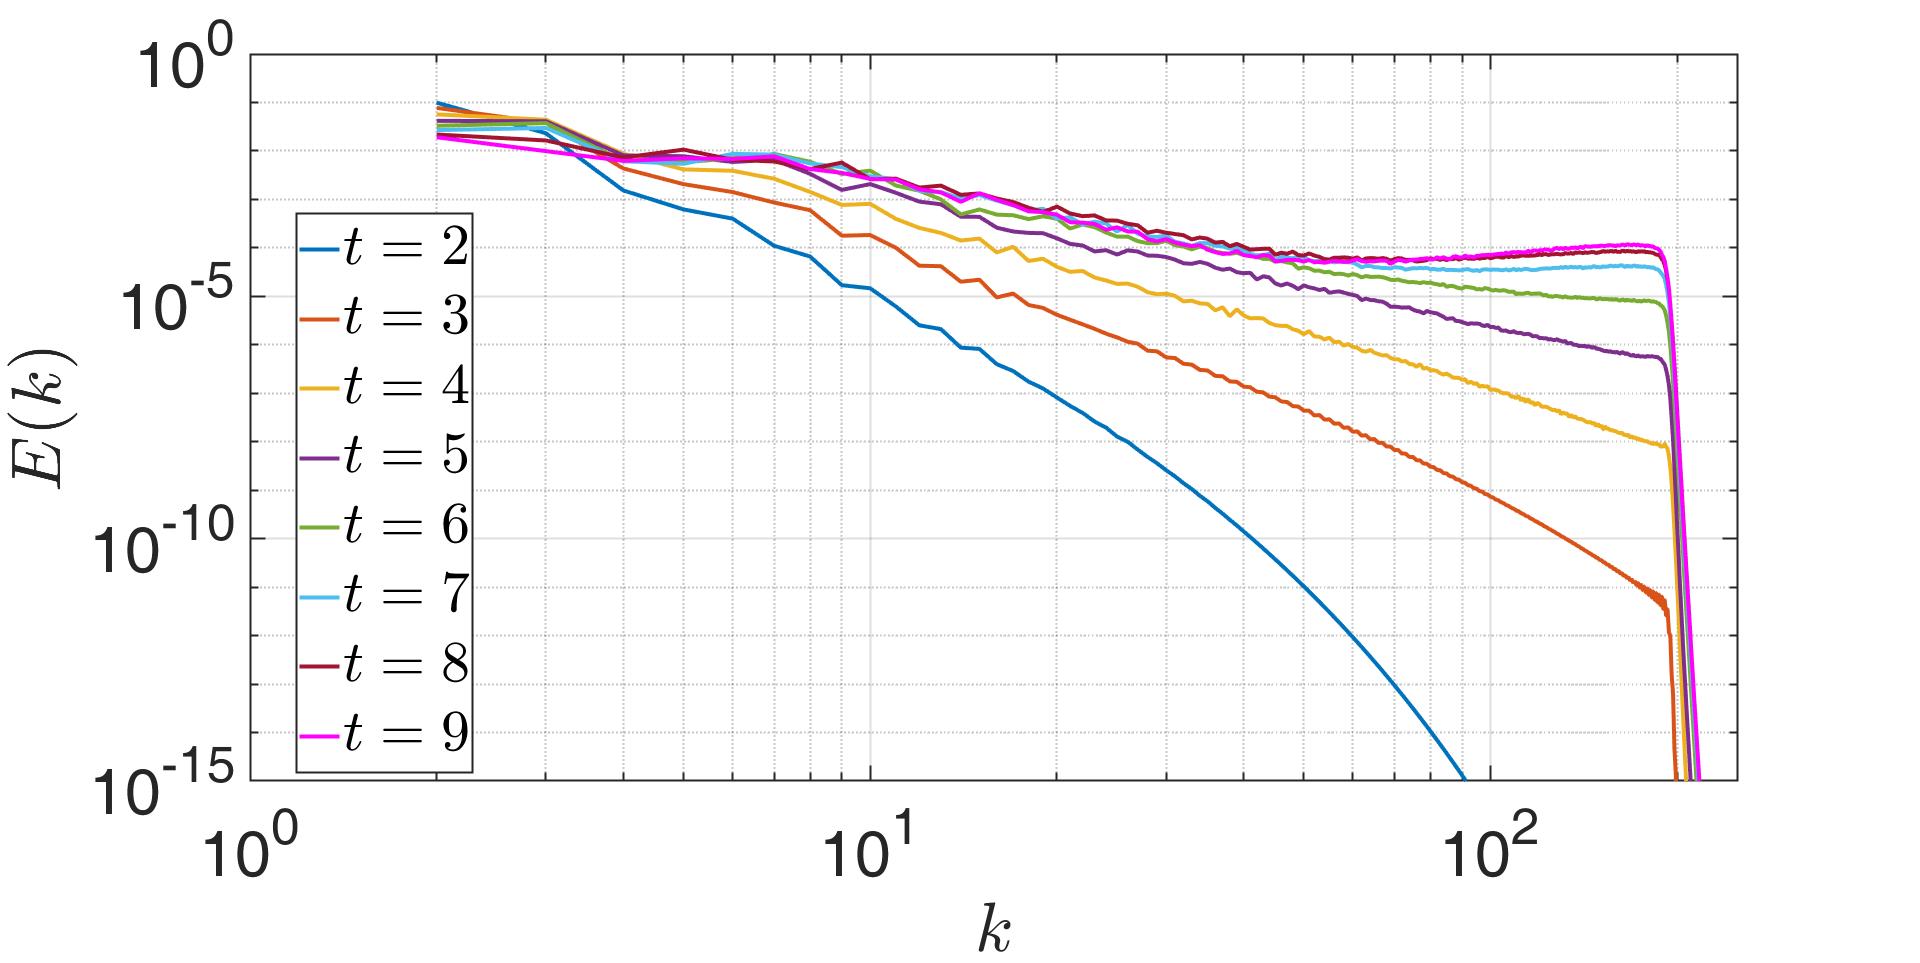
The main and intentional effect of hyperviscosity is clear: there is a very rapid fall-off of the spectrum for . Looking at the spectrum for , the two cases have very similar spectra for times smaller than , for which dissipation effects are negligible, At later times, however, the runs show an excess of energy at high wavenumbers that becomes more apparent as the peak of the energy dissipation at is approached.
In figure 4 we focus on the time of maximum dissipation and show the energy spectra at this instant for different values of . The top panel shows the spectra from the resolution numerical simulations while the bottom panel shows the results from the simulations. The spectra have been multiplied by so that a Kolmogorov spectrum would appear as flat.
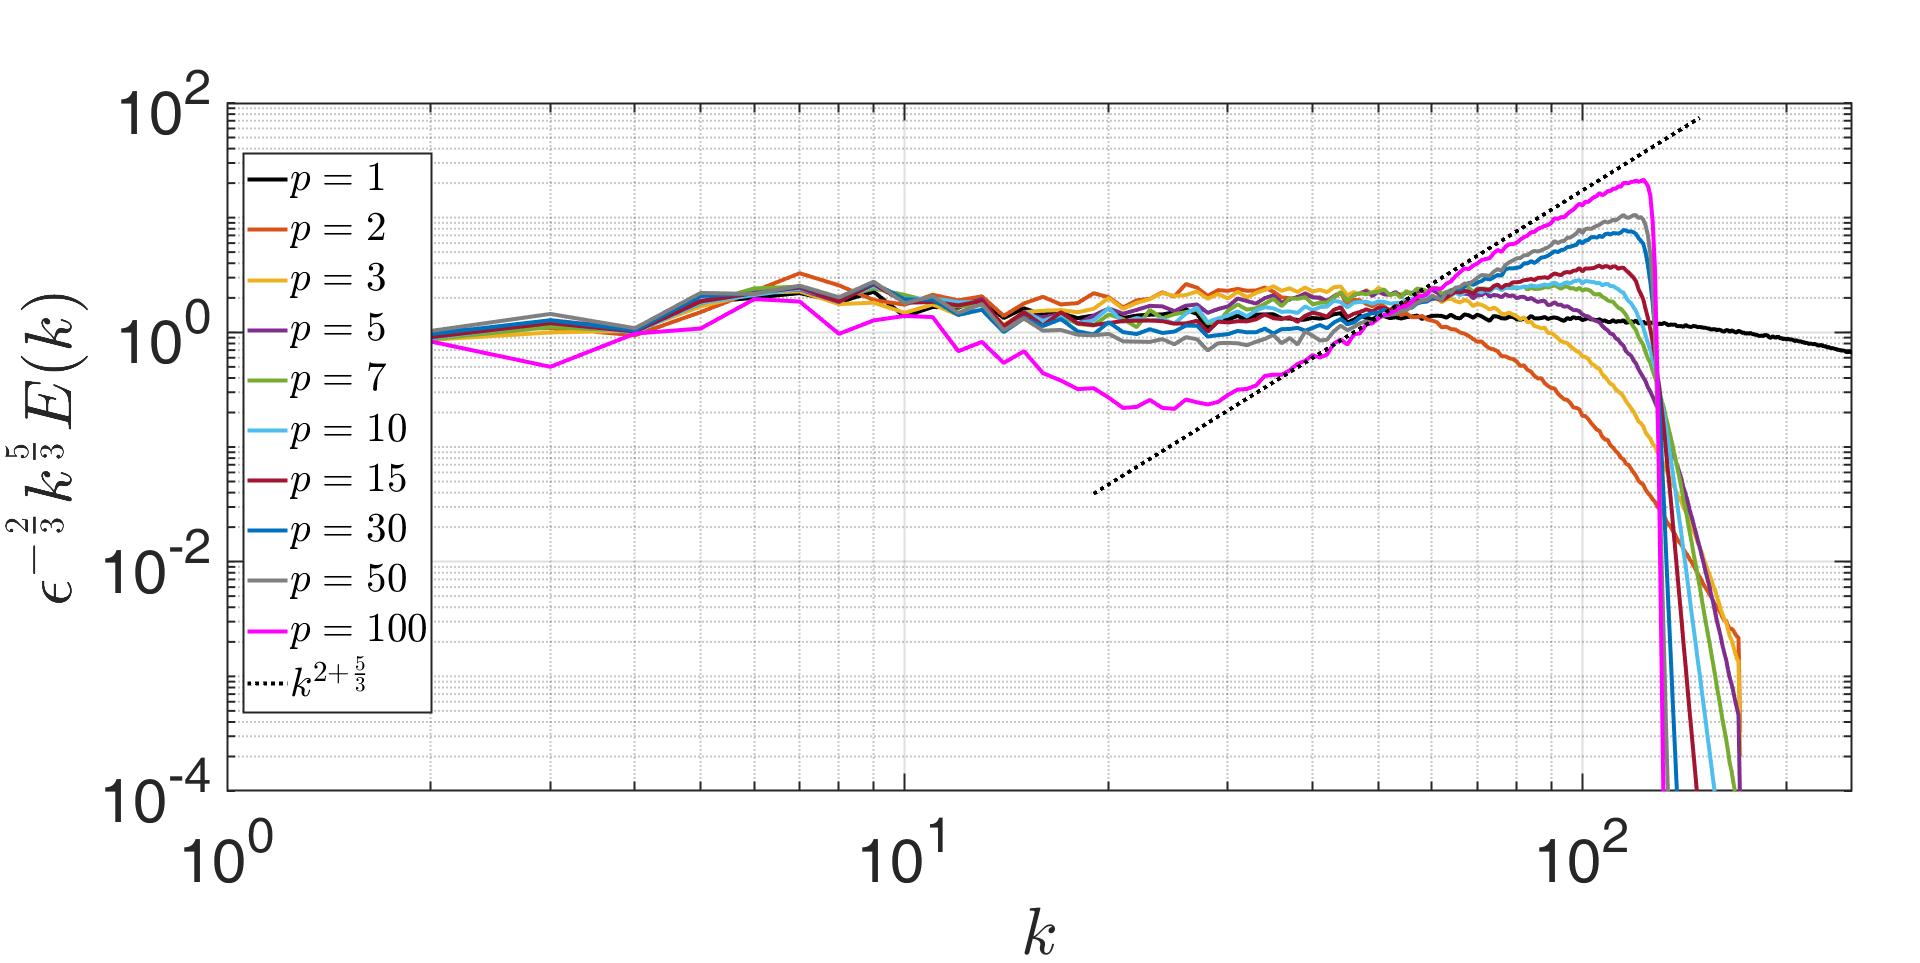
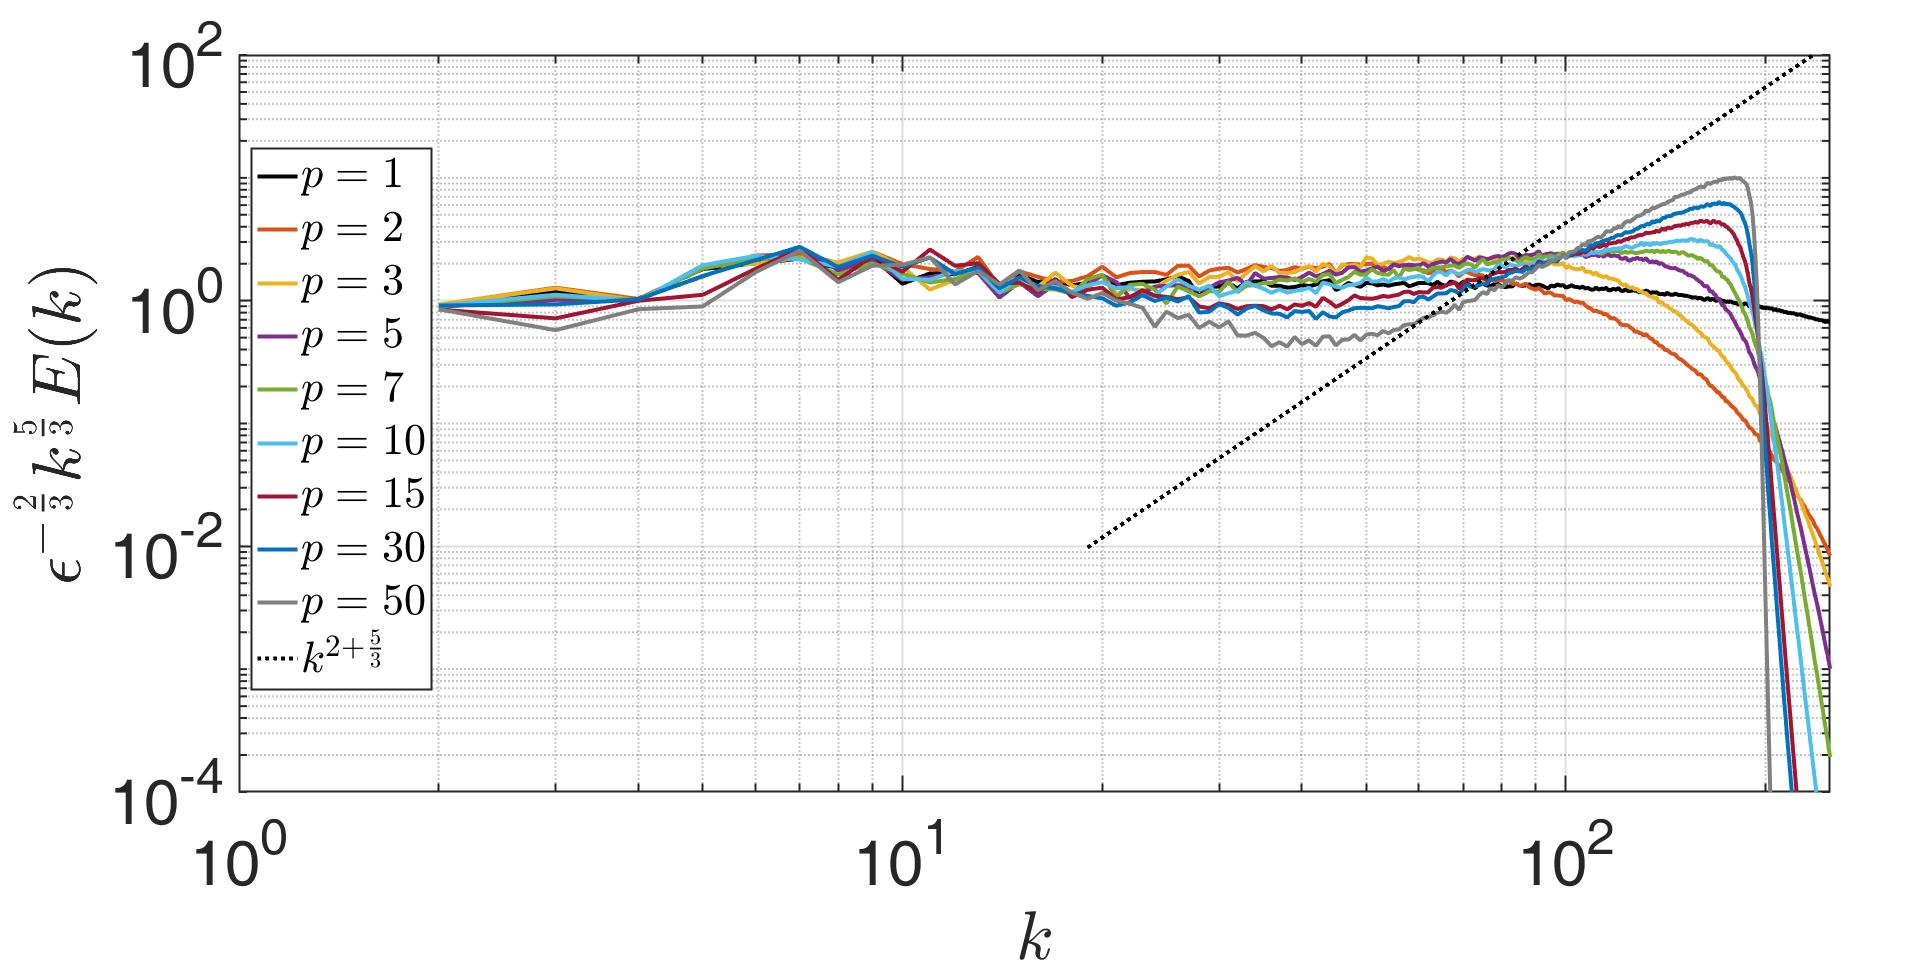
The spectra are surprisingly insensitive to the value of . For all , the spectra fall off for for resolution and for for resolution . The spectra appear close to flat for wavenumbers smaller than . For larger wavenumbers, we observe a dip in the spectrum followed by a bottleneck, which becomes stronger as the order of the hyper-viscosity is increased. For large values of , this bottleneck takes the form of a power-law that increases with .
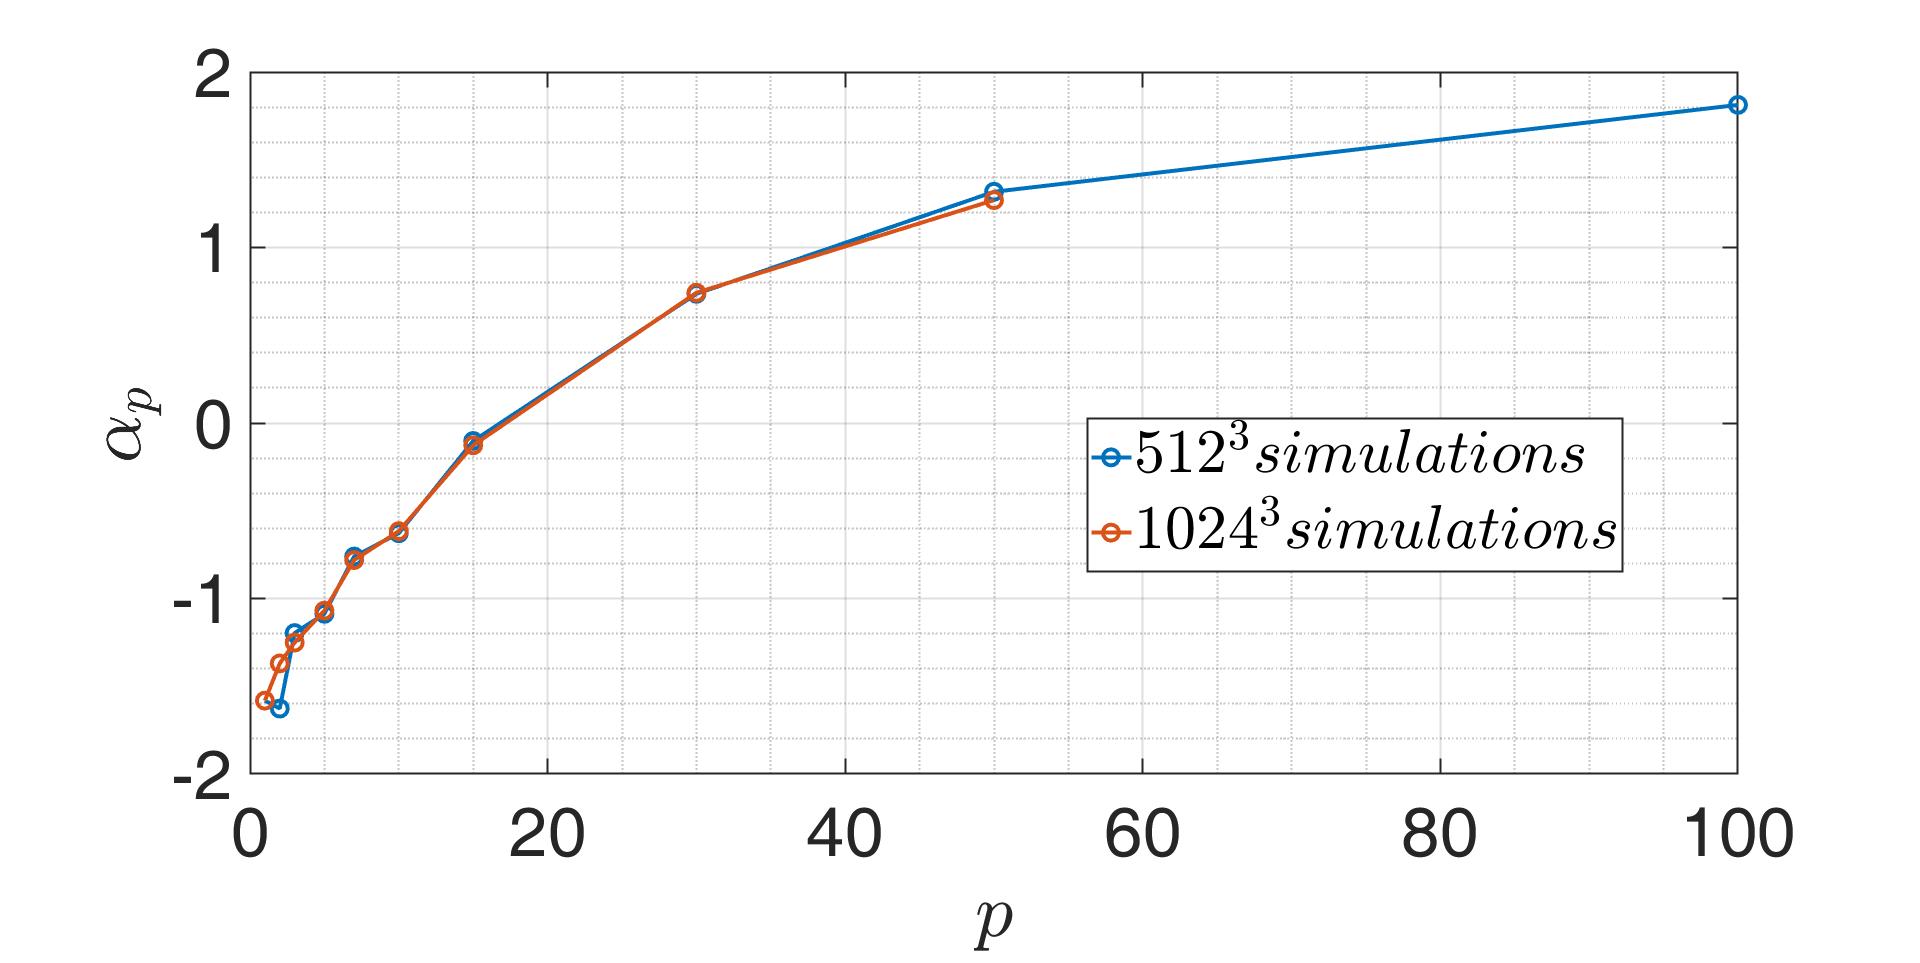
The dashed line indicates the prediction from thermalization . For each , we obtained the value of the exponent by fitting the spectrum over the increasing portion of the bottleneck, i.e. for in the range 50-70 in the simulations and 90-110 in the simulations. In figure 5 we show the value as a function of . We see that as becomes large, the exponent approaches the thermalized value as predicted in Frisch et al. (2008).
III.3 Spatial Structures
a)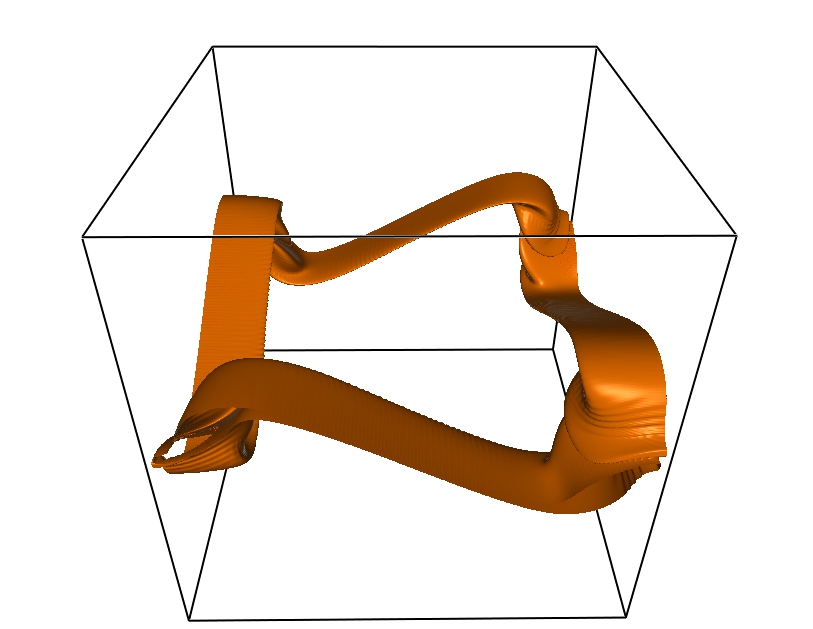 b)
b)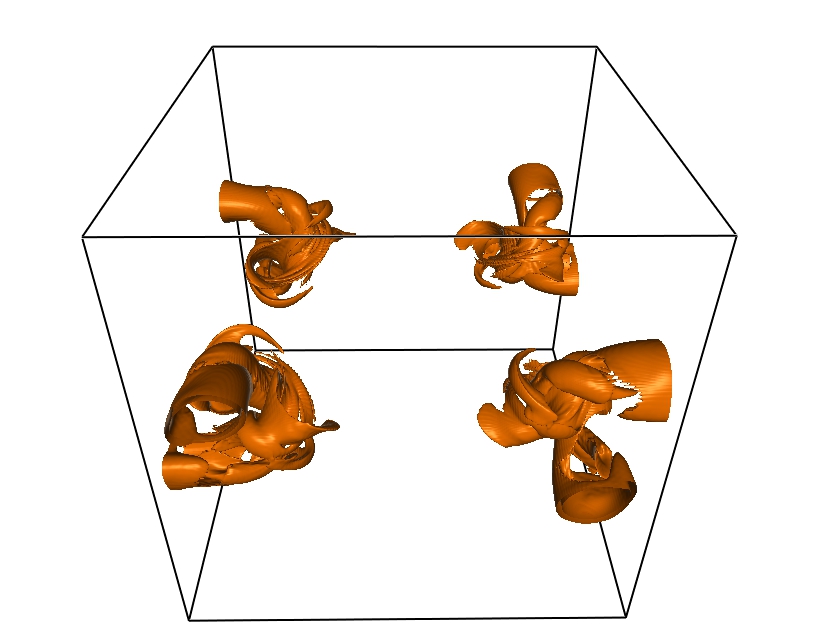
c) 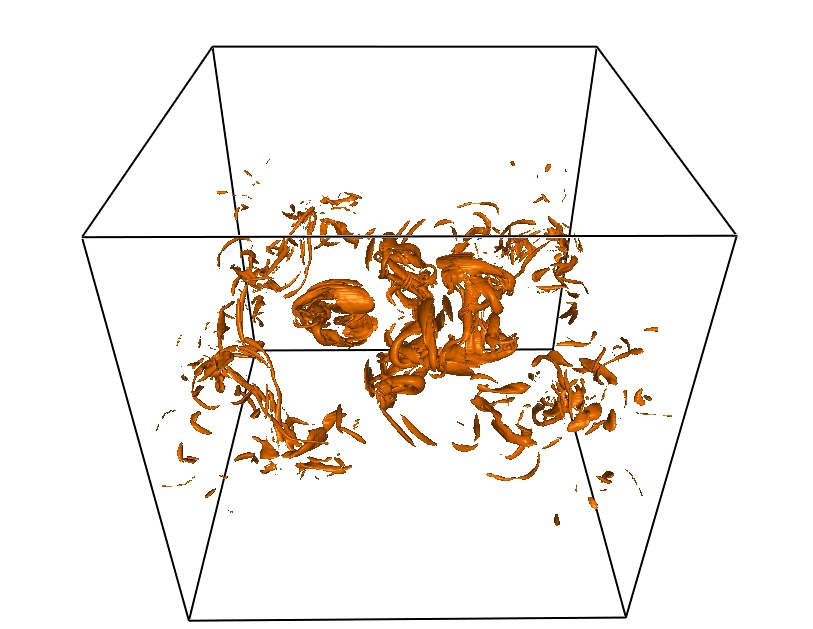 d)
d)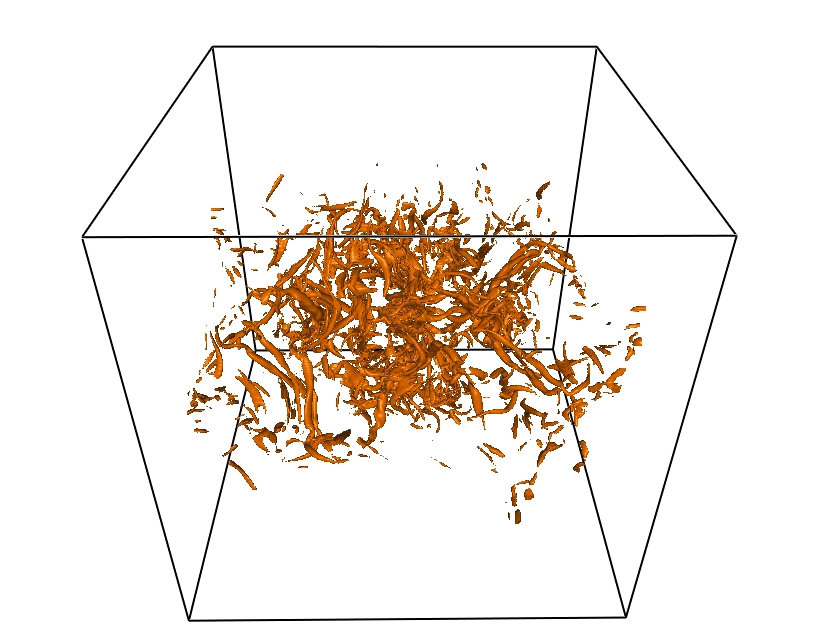
a)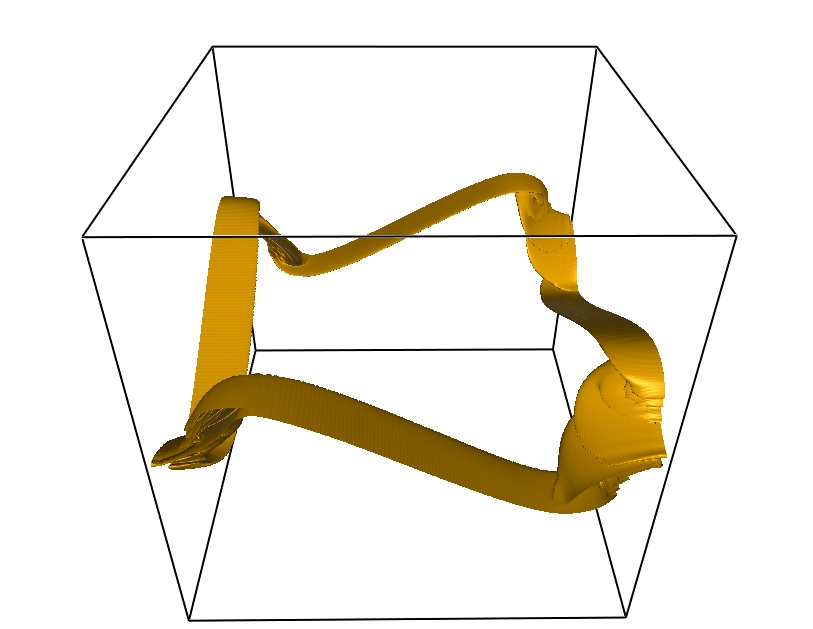 b)
b)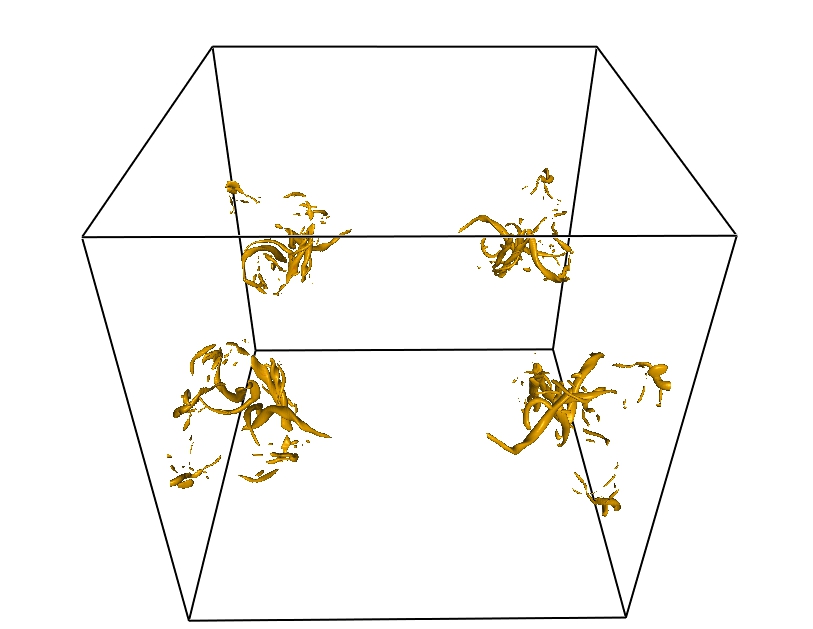 c)
c)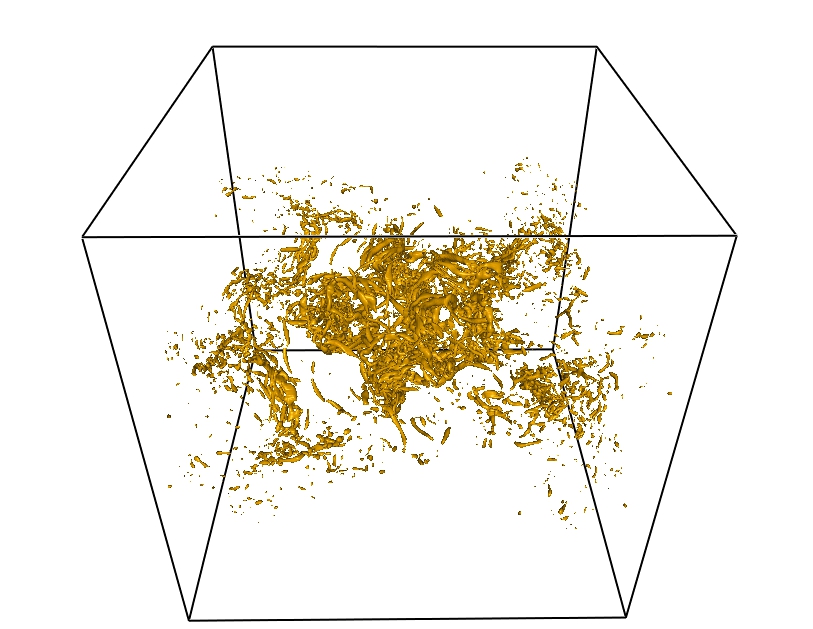 d)
d)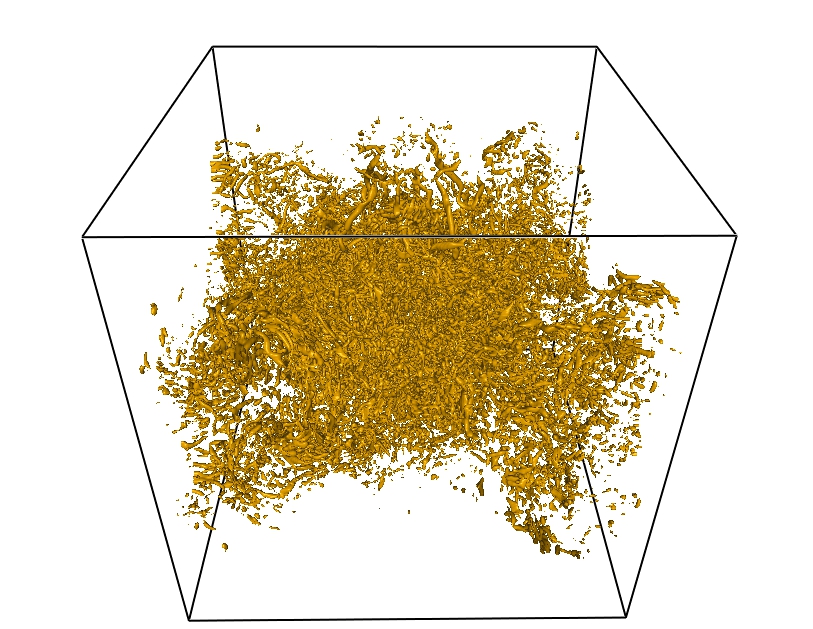
a)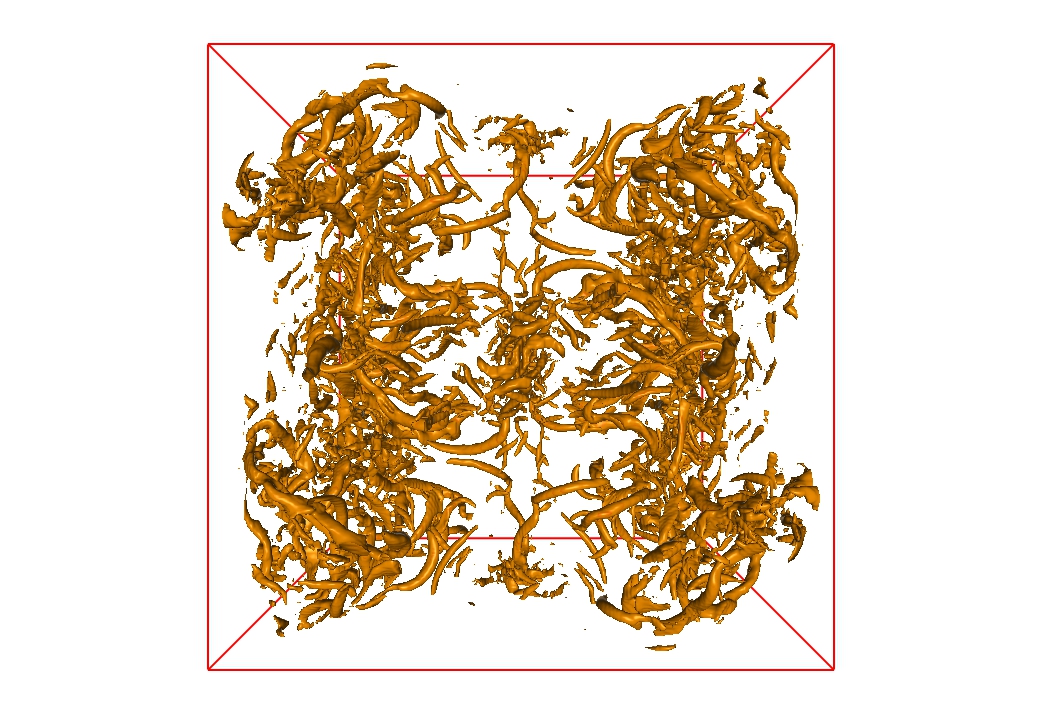 b)
b)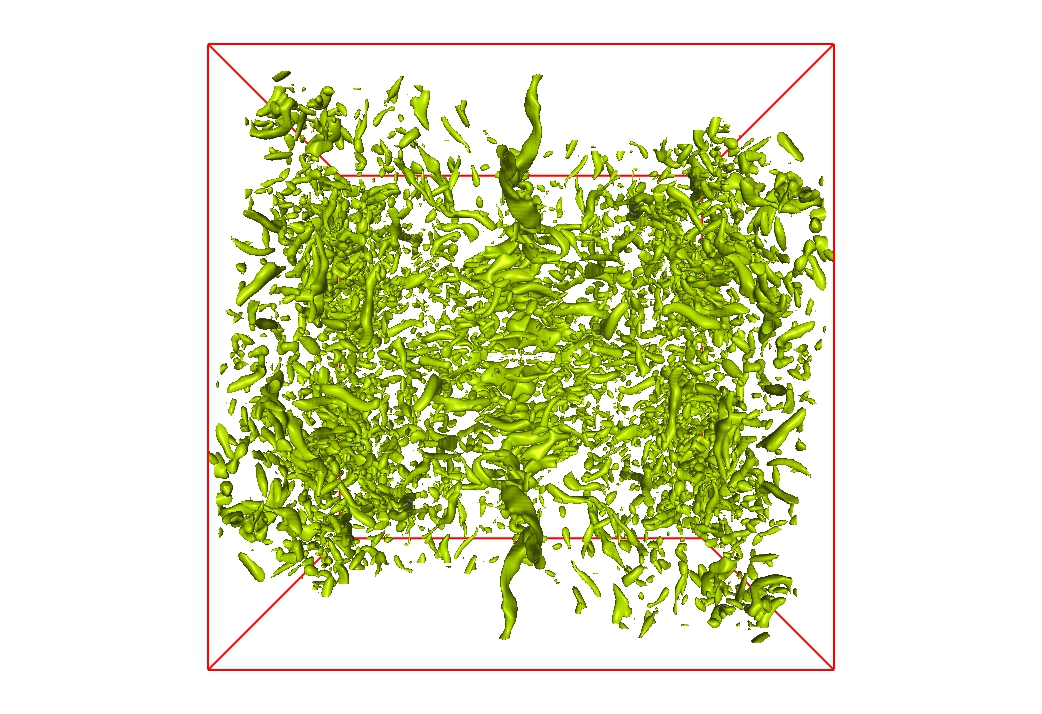
We now examine the spatial structure of the flows computed with ordinary and with hyper viscosity. We first recall that the mirror symmetries of the TG vortex with respect to the planes , , and confine the flow inside the impermeable box formed by these planes. The additional rotational symmetries of angle around the axes , , and are such that the early-time dynamics can be understood on and near the faces of the impermeable box. Computation of the flow shows that most of the dynamics of the flow for early-to-moderate times () occurs near these faces. Simple dynamical considerations determine the behavior of the flow on the faces of the impermeable box, resulting in the rapid build-up of a vortex sheet. These considerations determine the dominant features of the flow correctly for times up to about . A simple model of this phenomenon is given in appendix D of Brachet et al. Brachet et al. (1983). Because of the high Reynolds numbers considered in the present work, for all values of considered, the dynamics until is the same and essentially controlled by the inviscid dynamics.
For the standard () NS equation, when increases beyond , local vorticity maxima develop away from the walls of the impermeable box, suggesting the formation of new daughter vortices in the interior and a complicated flow structure, as displayed using VAPOR Clyne et al. (2007) in Fig. 6. Similar visualizations obtained at are displayed in Fig. 7. Comparing and , we see that at the two visualizations are markedly different; the video in the supplemental material shows that the difference can be seen starting at around . At later times, when thermalization occurs, the vortex tubes of Fig. 6d are dominated by fluctuations that take the form of point blobs, less elongated vorticity structures, as seen in Fig. 7d. This change of structure is best seen in Fig. 8, which shows visualizations of runs at resolution at in a cubic subregion of width centered at for for (a) and (b). The vortex tubes that are clearly the dominant structure in the case coexist in the case with point blobs that resemble the structures that appear in visualizations of the truncated Euler equations in Alexakis and Brachet (2019a).
III.4 Thermalization and finite dissipation
Looking at the previous sections we have two apparently contradictory results. On the one hand, based on figure 2 there is finite energy dissipation that is independent of the value of used. This indicates that this is an out-of-equilibrium dissipating system. On the other hand, the energy spectrum and structures resemble those of the thermalized absolute equilibrium state Kraichnan (1973). As discussed in the introduction, the thermalized state is realized in the truncated Euler equations, where a finite number of modes is kept and the energy is exactly conserved. Thus, if indeed there was a transition from the hyper-viscous Navier-Stokes equation to the truncated Euler equations, one would expect to see a suppression of the energy dissipation that is not observed here.
To resolve this discrepancy we recall the arguments in Frisch et al. (2008), in which the energy dissipation term in Fourier space is written as
| (10) |
where and is a wavenumber in the dissipation range chosen off-lattice so that no wavenumber is exactly equal to . The limit is then taken while keeping fixed. This is similar to the procedure followed here where we tuned so that the maximum of the dissipation spectrum is smaller but close to the maximum wavenumber allowed by our grid. In this case it is clear that, as , wavenumbers smaller than will not feel the effect of viscosity while wavenumbers larger than will be suppressed. The whole system will thus resemble the truncated Euler system with acting as the truncation wavenumber. However for a finite (if the Fourier wavenumbers are sufficiently dense) there will be wavenumbers close to that will be effective at dissipating energy. To estimate the width of wavenumbers that effectively dissipate energy we consider the dissipation spectrum given by and assume that, at large , the energy spectrum takes the form . Therefore , the integral of which gives the energy dissipation rate . For large values of , the dissipation spectrum is highly concentrated around a wavenumber and the integral can be estimated by writing
| (11) |
and using the steepest descent method. Expanding the argument of the exponential around its maximum value at with , we see that the dissipation spectrum can be approximated as
| (12) |
where , i.e. as a Gaussian centered at of width
| (13) |
In our simulations, we tuned so that the maximum of the dissipation spectrum at remained fixed and close to the maximum wavenumber . Therefore, the wavenumbers that dissipate effectively are those that are approximately within a distance of away from .
For the dissipation to be suppressed, the width must be smaller than the spacing between two neighboring shells that contain at least one wavenumber in the discrete wavenumber space . In three dimensions, the spacing between neighbouring spherical shells of radius is of the order . (To illustrate this point, we note that the closest spherical shell to the shell containing the wavenumber is that which contains the wavenumber and has norm .) Equating obtained from the steepest descent method with we obtain that the system will behave like the truncated Euler equations and energy dissipation will be suppressed when which implies that
| (14) |
Given that is our simulations is of the order for the and for the simulation, it is clear why energy dissipation still persists in this system: the order would have to be around to see a strong suppression of the energy dissipation. At of order and , the system can still effectively dissipate energy since there are many wavenumbers inside the dissipating shell.
What does change, however, as is increased is the number of triads of interacting wavenumbers that can transfer energy inside the dissipating shell. This number is decreased drastically as becomes smaller. In contrast, the number of triads that redistribute energy among all wavenumbers and lead to the thermalized state remains fixed. The ratio of the two therefore becomes smaller as is increased (because is decreased). This leads the system to a quasi-equilibrium state, in which the mean forward flux of energy (caused by the triads that transfer energy to the dissipating wavenumber shell) is subdominant to the fluctuations caused by the remaining triads that redistribute energy among modes leading to a thermalized state. This behavior has been observed recently by two of the authors Alexakis and Brachet (2019b), who showed that the thermalized behavior can appear in forced and dissipated flows for the truncated Navier-Stokes system. It was shown that for a given injection rate as the viscosity is reduced, the system makes a transition to a quasi-equilibrium, with the appearance of a thermal spectrum, provided that . A similar situation occurs in the present system, not because of the reduction in viscosity, but because the dissipation is limited to wavenumbers inside a thin spherical shell.
IV Conclusion
In this work we have examined decaying turbulence initiated by a Taylor-Green vortex using hyper-viscous numerical simulations for a wide range of orders of the hyper-viscous parameter . We have shown that it is possible to integrate the Navier-Stokes equations with hyper-viscosity of order of 50 or 100, much higher than the values of 2 to 8 that have been previously studied Borue and Orszag (1996, 1995); Haugen and Brandenburg (2004); Lamorgese et al. (2005); Spyksma et al. (2012); L’vov et al. (1998). For all values of that we examined, the evolution of the total energy and its dissipation rate remained unaffected by the hyperviscosity and close to those of high-resolution runs. The spectra and the structures remain unaltered up to , where almost inviscid dynamics are followed. At later times, however, the structures and the spectra diversify with the order of . Even at these later times, the low-wavenumber portion of the spectra is surprisingly insensitive to the value of even for high values of , but the inertial range (the part of the spectrum that displays a scaling) does not extend to indefinitely high . As the order is increased, a stronger bottleneck forms and the spatial structures change from vortex tubes to a mixture of vortex tubes and point blobs. Further studies would shed light on the nature of high- hyper-viscosity, now that we have demonstrated its practical feasibility.
The main focus of this work was on the turbulent behavior at increasingly large values of and attempted to make the connection between the bottleneck effect that is present in the usual Navier-Stokes equation and the thermalization of the flow that develops in the truncated Euler equations. We showed that, as the hyper-viscosity order is increased, the energy spectrum approaches that of the thermalized state of the truncated Euler equations of Kraichnan Kraichnan (1973). This transition was predicted in Frisch et al. (2008) by arguing that the hyper-viscous Navier-Stokes equations approach the truncated Euler equations as goes to infinity. This is the first time that this transition has been demonstrated in simulations of three-dimensional turbulence.
Nonetheless for the hyper-viscous flow a finite dissipation rate independent of the value of persists, contrary to the situation for the truncated Euler system. We argued that this behavior is due to the fact that for our grid resolutions and values of , energy dissipation in Fourier space is concentrated in a spherical shell of width that is thin but still much wider than the spacing between spherical wavenumber shells. Suppression of the energy dissipation was estimated to occur at much larger values of .
In conclusion, a relationship has been established between the bottleneck in turbulence and flows in thermal equilibrium. Our work has also demonstrated a continuous way to pass from the Kolmogorov spectrum to a thermalized spectrum. Unlike other systems that have demonstrated such a transition Alexakis and Brachet (2019b); Shukla et al. (2019), this path does not involve a discontinuous Galerkin truncation. Future work could include the forced Taylor-Green vortex for which long statistical averages can be performed.
V Acknowledgments
The numerical simulations were performed using high performance computing resources provided by the Institut du Developpement et des Ressources en Informatique Scientifique (IDRIS) of the Centre National de la Recherche Scientifique (CNRS), coordinated by GENCI (Grand Equipement National de Calcul Intensif) through grants A0050506421 and A0062A01119. This work was also granted access to the HPC resources of MesoPSL financed by the Region Ile de France and the project Equip@Meso (reference ANR-10-EQPX-29-01) of the programme Investissements d’Avenir supervised by the Agence Nationale pour la Recherche. This work was also supported by the Agence Nationale pour la Recherche via ANR DYSTURB project No. ANR-17-CE30-0004.
Appendix A Time-integration scheme
We use an explicit second-order Runge-Kutta method to integrate the nonlinear advective terms of the Navier-Stokes equations. The linear viscous terms are often integrated via an implicit method, in order to increase the timestep from that imposed by the viscous stability requirement. As the Reynolds number increases, this constraint becomes less important than that imposed by the integration of the advective terms, and hence explicit timestepping is sometimes used for high Reynolds number simulations. However, the use of hyperviscosity poses a greater constraint on the timestep than ordinary viscosity. An analogous problem occurs in integrating the Kuramoto-Sivashinsky equation, which contains a fourth-order spatial derivative and has led to the formulation of a modified exponential scheme called the slaved scheme Frisch et al. (1986). Here we compare explicit timesetepping with exponential and modified exponential timestepping for treating the hyperviscous terms.
To describe the exponential methods, we write the evolution equation for a mode with wavenumber schematically as
| (15) |
where includes both the advective terms and the pressure projection. Equation (15) can be rewritten as an integral equation
| (16) |
A first approximation, called time-splitting and used in both methods, is , where is the result of integrating from initial condition , in practice by the second-order Runge-Kutta scheme.
The exponential method further approximates the exponential in the integrand by 1, its value at the left endpoint, so that the integral becomes
| (17) |
leading to the exponential scheme
| (18) |
The modified exponential, or slaved, method approximates the exponential in the integral by its average value
| (19) |
leading to the slaved scheme
| (20) |
where the fraction in (20) is evaluated as 1 if is less than . Unlike the exponential scheme (18), the slaved scheme (20) is exact for all in the special case that is a constant :
| Exact solution/Slaved method | ||||
| (22) | ||||
| Exponential method | ||||
| (23) | ||||
For , the exact solution and the result of the slaved method is , while the solution obtained by the exponential method is zero. A generalization of this argument shows that if varies slowly compared with the timescale , then scheme (20) is accurate even for large . Thus, this scheme yields correct results both for and while making some error for .
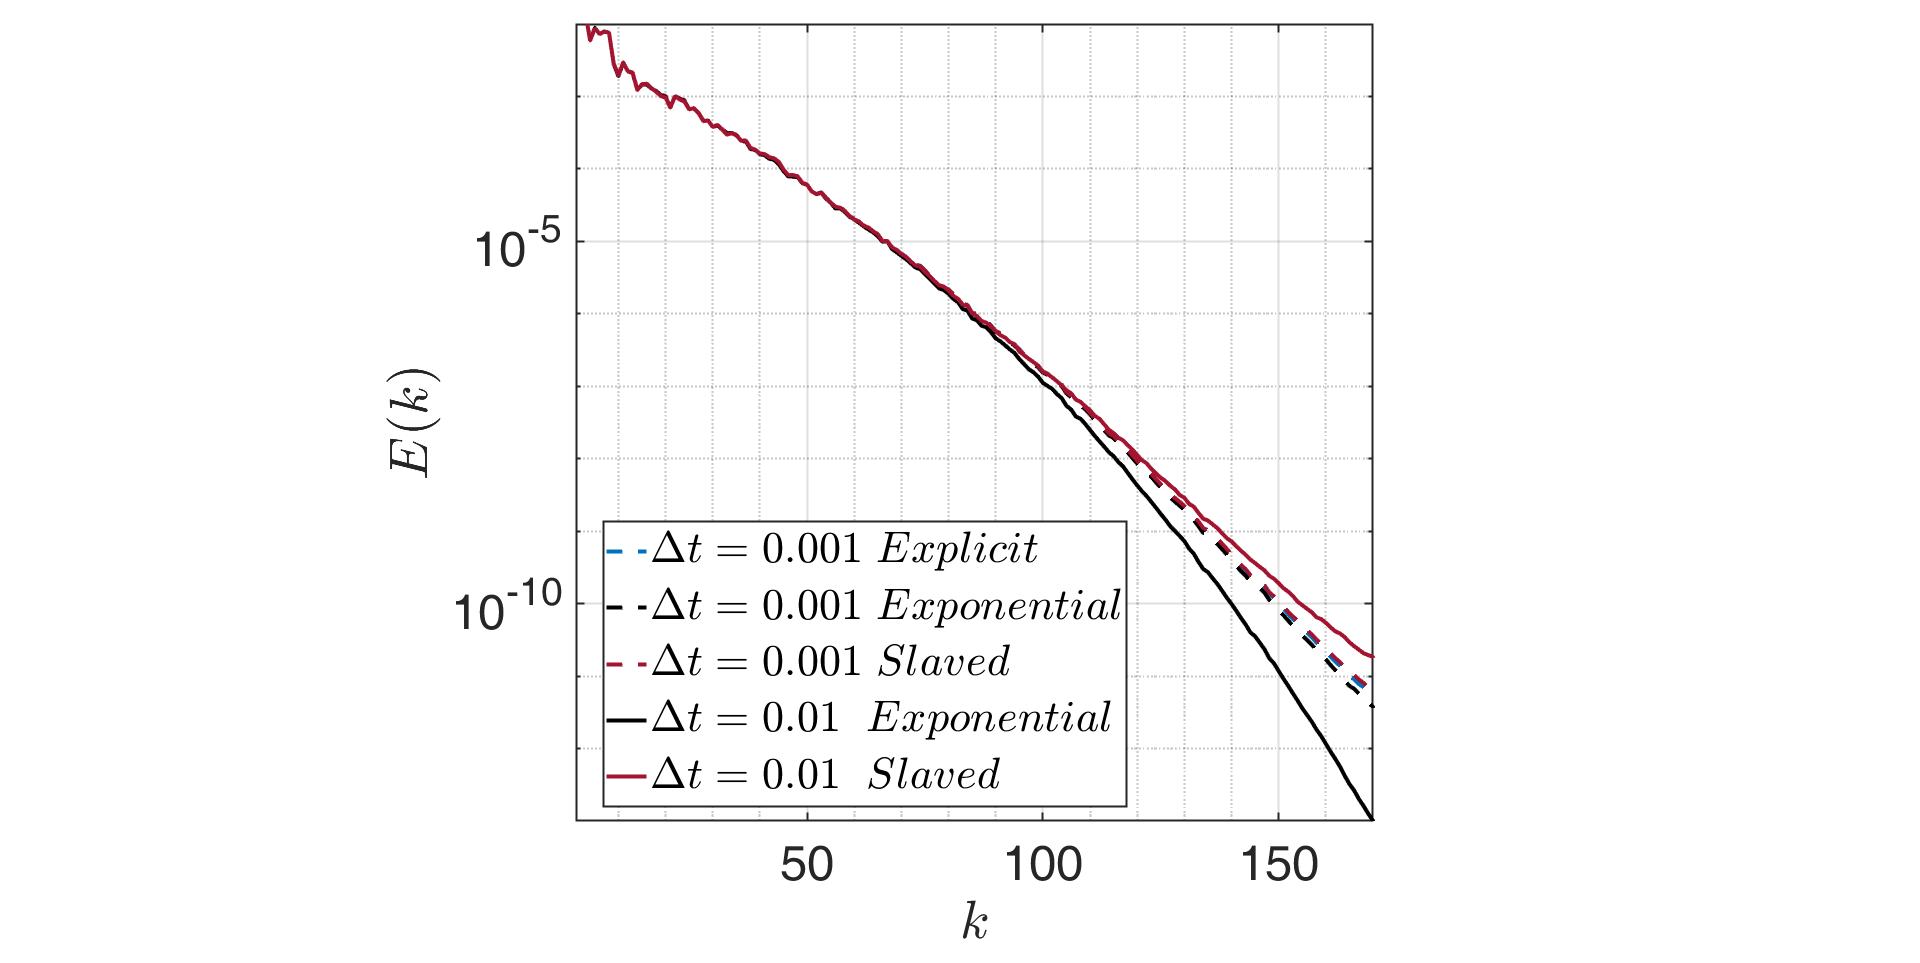
Figure 9 compares the energy spectrum that results from using these three schemes for a case with mild hyperviscosity , spatial resolution , Reynolds number , for two times, and . For , all three schemes give satisfactory results. For , the explicit scheme diverges, while the slaved scheme yields a spectrum that is more accurate than the exponential scheme, i.e. the spectrum is closer to that obtained for .
References
- Borue and Orszag (1995) Vadim Borue and Steven A Orszag, “Forced three-dimensional homogeneous turbulence with hyperviscosity,” Europhys. Lett. 29, 687 (1995).
- Borue and Orszag (1996) Vadim Borue and Steven A Orszag, “Numerical study of three-dimensional Kolmogorov flow at high Reynolds numbers,” J. Fluid Mech. 306, 293–323 (1996).
- L’vov et al. (1998) Victor S L’vov, Itamar Procaccia, and Damien Vandembroucq, “Universal scaling exponents in shell models of turbulence: viscous effects are finite-sized corrections to scaling,” Phys. Rev. Lett. 81, 802 (1998).
- Haugen and Brandenburg (2004) Nils Erland L Haugen and Axel Brandenburg, “Inertial range scaling in numerical turbulence with hyperviscosity,” Phys. Rev. E 70, 026405 (2004).
- Lamorgese et al. (2005) A.G. Lamorgese, D.A. Caughey, and SB Pope, “Direct numerical simulation of homogeneous turbulence with hyperviscosity,” Phys. Fluids 17, 015106 (2005).
- Frisch et al. (2008) Uriel Frisch, Susan Kurien, Rahul Pandit, Walter Pauls, Samriddhi Sankar Ray, Achim Wirth, and Jian-Zhou Zhu, “Hyperviscosity, Galerkin truncation, and bottlenecks in turbulence,” Phys. Rev. Lett. 101, 144501 (2008).
- Spyksma et al. (2012) Kyle Spyksma, Moriah Magcalas, and Natalie Campbell, “Quantifying effects of hyperviscosity on isotropic turbulence,” Phys. Fluids 24, 125102 (2012).
- Falkovich (1994) Gregory Falkovich, “Bottleneck phenomenon in developed turbulence,” Phys. Fluids 6, 1411–1414 (1994).
- Lohse and Müller-Groeling (1995) Detlef Lohse and Axel Müller-Groeling, “Bottleneck effects in turbulence: Scaling phenomena in r versus p space,” Phys. Rev. Lett. 74, 1747 (1995).
- Martinez et al. (1997) D.O. Martinez, S Chen, G.D. Doolen, R.H. Kraichnan, L.P. Wang, and Y Zhou, “Energy spectrum in the dissipation range of fluid turbulence,” J. Plasma Phys. 57, 195–201 (1997).
- Donzis and Sreenivasan (2010) D.A. Donzis and K.R. Sreenivasan, “The bottleneck effect and the Kolmogorov constant in isotropic turbulence,” J. Fluid Mech. 657, 171–188 (2010).
- Küchler et al. (2019) Christian Küchler, Gregory Bewley, and Eberhard Bodenschatz, “Experimental study of the bottleneck in fully developed turbulence,” J. Stat. Phys. 175, 617–639 (2019).
- Kraichnan (1973) Robert H Kraichnan, “Helical turbulence and absolute equilibrium,” J. Fluid Mech. 59, 745–752 (1973).
- Brachet et al. (2013) M. E. Brachet, M. D. Bustamante, G Krstulovic, Pablo Daniel Mininni, A Pouquet, and D Rosenberg, “Ideal evolution of magnetohydrodynamic turbulence when imposing Taylor-Green symmetries,” Phys. Rev. E 87, 013110 (2013).
- Frisch et al. (1986) Uriel Frisch, Zhen Su She, and Olivier Thual, “Viscoelastic behaviour of cellular solutions to the Kuramoto-Sivashinsky model,” J. Fluid Mech. 168, 221–240 (1986).
- Taylor and Green (1937) G.I. Taylor and A.E. Green, “Mechanism of the production of small eddies from large ones,” Proc. Roy. Soc. A 158, 499–521 (1937).
- Douady et al. (1991) S. Douady, Y. Couder, and M. E. Brachet, “Direct observation of the intermittency of intense vorticity filaments in turbulence,” Phys. Rev. Lett. 67, 983–986 (1991).
- Fauve et al. (1993) S Fauve, C Laroche, and B Castaing, “Pressure-fluctuations in swirling turbulent flows,” J. Physique II 3, 271–278 (1993).
- Maurer et al. (1994) J Maurer, P Tabeling, and G Zocchi, “Statistics of turbulence between two counter-rotating disks in low-temperature helium gas,” Europhys. Lett. 26, 31–36 (1994).
- Brachet et al. (1983) M. E. Brachet, Daniel I. Meiron, Steven A. Orszag, B. G. Nickel, Rudolf H. Morf, and Uriel Frisch, “Small–scale structure of the Taylor-Green vortex,” J. Fluid Mech. 130 (1983).
- Lee et al. (2008) E. Lee, M. E. Brachet, A. Pouquet, P. D. Mininni, and D. Rosenberg, “Paradigmatic flow for small-scale magnetohydrodynamics: Properties of the ideal case and the collision of current sheets,” Phys. Rev. E 78, 066401 (2008).
- Pouquet et al. (2010) A. Pouquet, E. Lee, M. E. Brachet, P. D. Mininni, and D. Rosenberg, “The dynamics of unforced turbulence at high Reynolds number for Taylor-Green vortices generalized to MHD,” Geophys. Astrophys. Fluid Dyn. 104, 115–134 (2010).
- Clyne et al. (2007) J. Clyne, P. Mininni, A. Norton, and M. Rast, “Interactive desktop analysis of high resolution simulations: application to turbulent plume dynamics and current sheet formation,” New J. Phys. 9, 301 (2007).
- Alexakis and Brachet (2019a) Alexandros Alexakis and M. E. Brachet, “On the thermal equilibrium state of large-scale flows,” J. Fluid Mech. 872, 594–625 (2019a).
- Alexakis and Brachet (2019b) Alexandros Alexakis and M. E. Brachet, “Energy fluxes in quasi-equilibrium flows,” arXiv preprint arXiv:1906.02721 (2019b).
- Shukla et al. (2019) Vishwanath Shukla, Bérengère Dubrulle, Sergey Nazarenko, Giorgio Krstulovic, and Simon Thalabard, “Phase transition in time-reversible Navier-Stokes equations,” Phys. Rev. E 100, 043104 (2019).