Correlated Feature Selection for Tweet Spam Classification
Abstract
The identification of spam messages on social networks is a very challenging task. Social media sites like Twitter & Facebook attracts a lot of users and companies to advertise and attract users of personal gains. These advertisements most of the time leads to spamming, which in return leads to poor user experience. The purpose of this paper is to undertake the analysis of spamming on Twitter. To classify spams efficiently, it is necessary to first understand the features of the spam tweets as well as identify attributes of the spammer. We extract both tweet based features and user-based features for our analysis and observe the correlation between these features. This step is necessary as we can reduce the training time if we combine the highly correlated features. Our proposed approach uses a classification model based on artificial neural networks to classify the tweets as spam or non-spam giving the highest accuracy of 97.57% when compared with four other standard classifiers namely, SVM, K Nearest Neighbours, Naive Bayes, and Random Forest.
1 Introduction
Online social networking platforms such as Twitter, Facebook, Instagram, etc. allow people to meet, discuss, and work together by collaborating on projects with just a click. The combined number of users just on Facebook, Linkedin, Instagram, and Twitter stands at 3200 million as of September 2017 111https://www.statista.com/statistics/282087/number-of-monthly-active-twitter-users/. Twitter has generated a lot of interest among netizens recently due to its widespread use by influential people like the Presidents and the Prime Ministers of powerful countries. As per the latest reports, approximately 330 million active users are on Twitter .
One of the interesting properties of Twitter is the ability to follow any other user with a public profile. Media organizations, politicians, and celebrities are reaching millions of followers every day. It is interesting to note that in many cases, the number of actual followers is not genuine Ghosh et al. (2012). In a recent incidence in India, some of the leading national newspapers published headline news on Oct 21, 2017, with the title being ”Bots behind the rise in XXXX Twitter popularity?” when one of his tweets received 30,000 re-tweets.
Fake Twitter followers and Robot driven accounts being used for re-tweets are not new phenomena. There are several softwares in the market such as Twitter bots that use Twitter APIs to control Twitter accounts. These software bots can be used to send tweets, re-tweets, follow, unfollow, and increase the number of likes on a tweet Thomas et al. (2011b). Varol et al. Varol et al. (2017) in his paper states that as many as 48 million accounts on Twitter are actually bots. This means that approximately 15% of the profiles are fake. The growth in popularity of Twitter in recent years has led to a large number of spammers who exploit and manipulate these numbers to misuse the whole medium for unwanted gains. Spamming is not a new concept. Initially, the term was associated with bulk email which was unsolicited. Lots of research has been done to overcome this problem and now we have fairly accurate filters that keep on segregating spam mails into a separate folder.
The internet society in 2015 estimated that 85% of the global emails are spam 222https://www.internetsociety.org/policybriefs/spam. Considering that decades of research has been done in the area of email filtering, Tweet spam filtering needs significant contribution from the academic research community. Twitter defines spam as unsolicited, repeated actions that negatively impact other people. Examples of the aforementioned could be, posting harmful links of phishing sites, using automated bots for mass following, abusing, creating multiple handles, posting, or re-tweeting on trending topics unnecessarily.
Twitter has its own mechanism of spam detection however it is still in its infancy and the academic research community should provide its support. On average Twitter is able to detect roughly 3.2 million suspicious accounts per week 333http://www.dailymail.co.uk/sciencetech/article-4931430/Twitter-reveals-closes-3-2m-spam-accounts-WEEK.html. The primary issue that needs attention is to understand how harmful these spams can be. To figure out a solution to this problem, we note that the US intelligence community released a report in January 2017 highlighting the role that Russia Today (RT) might have played in influence the 2016 U.S. Elections. This is a big allegation and which is still under investigation; however, it still shares the influence of online platforms particularly Twitter for such big events Bessi and Ferrara (2016) .
In section 2, we will review related spam detection research. In section 3, we will explain our process of data collection and preprocessing. In section 4, we will discuss our proposed approach for feature selection which is further divided into 2 sub-sections for the analysis of Tweet-based features and User-based features. In section 5, we detail our experiments and comparisons with our spam detection model. Section 6 concludes this research with directions to future work.
2 Related Work
Twitter continues to gain popularity among the various social networks currently available and thus attracts spammers who would try to abuse the system by manipulating existing features to gain undue advantage Thomas et al. (2011b). There have been numerous studies that have proposed machine learning and artificial intelligence techniques for detecting spammers. Existing studies have focussed on classification algorithms to distinguish between spammers and non-spammers Ghosh et al. (2012). Lee et al. Lee et al. (2010) created social honeypots for the identification of spammers. Many studies have focused on URL based spam detection and blacklists based on domain and IP address. This has not been successful since short URL’s obscure the base and new short URL’s are used by spammers as soon as old ones are blacklisted Wang et al. (2013). Grier et al. worked extensively on blacklisted URL’s Grier et al. (2010).
Twitter identifies users through a unique username referred to as the screen name. Each user can send replies containing screen names. One can also mention another user’s screen name anywhere in their tweet. This feature helps users to track conversations and know each other. Spammers, however, use this feature by including many screen names in their replies and tweets, If there are too many replies or mentions in tweets by a user, Twitter will treat this as suspicious444Twitter support https://help.twitter.com/ Stringhini et al. (2010).
Twitter allows a message with a maximum length of 140 characters. Due to this restriction, many URLs are shortened in the tweets. However, short URLs can obscure the source and this property has been used by spammers to camouflage the spam URLs Wang et al. (2013). Twitter allows the re-tweets and all such re-tweets start with @ RT. Many authors Kabakus and Kara (2017) use the number of re-tweets in the most recent 20-100 tweets of a user as an important feature in spam detection.
Trending topics has become ubiquitous topic these days. If there are several tweets with the same term, then it will become a trending topic. Spammers seek attention by posting many unrelated tweets with trending terms Wang (2010). Another prominent feature of Twitter allows users to create a public and private list to categorize people in different groups based on similar interests Kim et al. (2010).
There are two major categories in which we can segregate the extracted features for Twitter spam detection. User profile based features and tweet content-based features. Some of the major user profile based features are the number of followers, the number of follows, duration of the existing account, the number of favorites, number of lists in which the user has membership, and the average number of tweets a particular user sends Kabakus and Kara (2017). The tweet content-based features are the number of times a particular tweet has been re-tweeted, the number of hashtags, the number of times a particular tweet has been mentioned, the number of URLs included in a tweet, the number of characters and number of likes in this tweet Kim et al. (2010).
3 Data collection
We need a labeled dataset to train and test our model. A majority of spam contains embedded URLs and many researchers have focused only on this Thomas et al. (2011a). For making our labeled dataset of spam and non-spam tweets, we have used tweets from spammers and non-spammers. We have used the list of spammers from the reference Benevenuto et al. (2010) and for non-spammers, we have randomly picked Twitter user accounts. For each user, we have extracted at most 100 previous tweets using Twitter API Tweepy by giving the user screen name as a query. Along with the text of the tweets, we have also extracted the timing of the tweets, the number of previous tweets, favorites, friends, lists, number of followers of the users.
We have extracted 719300 tweets from an of total 760 users out of which 370 (350900 tweets) users are randomly picked non-spammers and 390 (368400 tweets) are spammers.
4 Feature selection
Any machine learning based spam classification technique would need feature extraction. Historical information of user-based features such as the number of tweets sent by the user in the last 30 days etc. are important and give useful insights. To make sure that feature extraction is a real-time process, we have used lightweight features from Tweepy API and derived new features from these extracted features.
One of the important differences between spammers and non-spammers is the intent of spamming. Spammer’s purpose of tweeting is to get some undue advantage through those tweets or belittle some rivals. Taking into account the intentions of the tweets it is obvious that the spammer’s tweets should have distinct characteristics compared to non-spammer tweets. Historical data suggests that the average time spent by non-spammers should be less than spammers Yardi et al. (2009). There can be various other discriminatory attributes that can reflect on user behaviors.
In this section, we will take into account the features that have been considered for each tweet for classification. Each tweet has two broad categories of features viz. tweet based features, such as those which are related to that particular tweet like an upper-case percentage in the tweet or time of tweet posted, etc, and user-based features, such as the number of follower/following of the user, etc. From the Tweepy API, we have already extracted past tweets of a user from a list of 76 pre-labeled spammers and non-spammers.
Tweet based features and user-based features together comprise 21 features that are tweet, tweet time, number of followers, number of tweets, number of favorites, number of friends, number of lists, number of screen names used, upper-case percentage use, number of link/URLs used, link to word percentage, same screen name percentage use, tweet similarity percentage, user re-tweet percentage, user average screen name usage, user tweet frequency, user previously re-tweeted or not, user upper-case percentage, user average link/URLs count, user link to word percentage, user link use frequency, user same screen name percentage use, user Tweet length standard deviation, user tweet similarity.
4.1 Tweet based features
From only the text of the tweet, we can get a lot of properties like upper-case percentage, number of screen names in a tweet, link to word percentage, same screen name percentage and tweet similarity. These features correspond to the textual attributes of the tweet which are useful for spam classification.
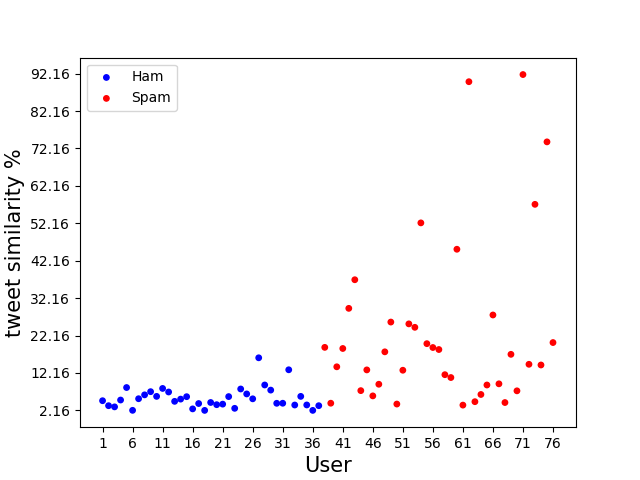
The Tweet similarity percentage Ts is calculated as shown in equation (1) ,
| (1) |
| (2) |
Let the tweet of which we are finding the tweet similarity percentage be T. We compare T having nt words with all the previous tweets Ti’s of that user and each comparison is given a percentage of similarity PSi which is percentage of number of similar words ns which are there in both the tweets except all the hashtags, screen names and links to nt and the average of all these PSi’s is calculated to give the tweet similarity percentage of the tweet T. This gives how much this tweet is similar to the previous tweets of the user that has posted this tweet.
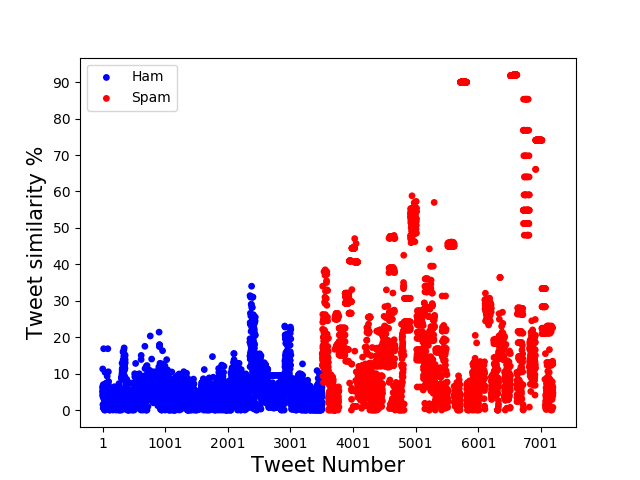
From Fig.1 it can easily be seen that spammers post mostly similar tweets but the non-spammers do not. From the dataset it can be seen that spammers only post similar tweets with same agenda every time i.e. to promote a link or user or advertise some of their product.
It is observed from our dataset that most of the spam tweets have a high percentage use of upper-case characters, for example tweets like ”PSP DOWNLOAD Music and Movies HERE! Have the BEST Experience EVER! http://bit.ly/5QD3Hv”. Upper-case in tweets is usually used to emphasise some part of the tweet. Upper-case percentage U can be found by equation (3) where nu is number of upper-case words in the tweet and nt is total number of words in the tweet.
| (3) |
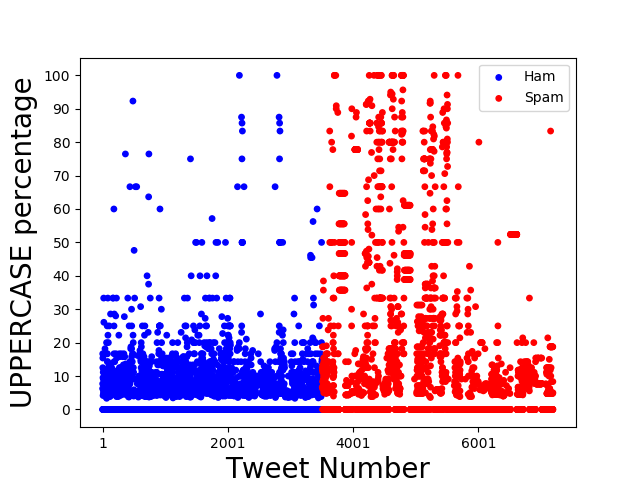
From Fig.2 we can easily identify that most of the spammers use high percentage of upper-case words in there tweets but non-spammers don’t.
There are some spammers who have a tendency to act as follow train. Follow trains are those types of Twitter accounts which advertise different user accounts by posting a lot of similar kind of tweets which includes requests to follow random users who have started following the follow train. There strategy is to attract different users to follow them by giving them the attractions of gaining followers and then they advertise their products. So number of screen names in a tweet plays an important role for classification of these types of spammers.
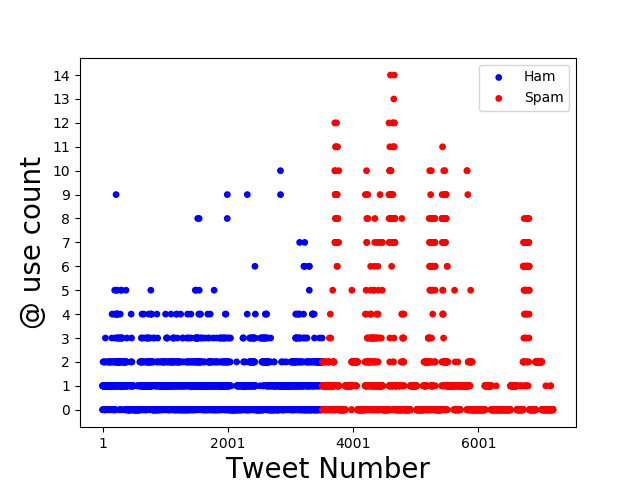
From Fig.3 we can directly see that most of the tweets from the users use high number of screen names and the reason observed from the dataset is that they have a high tendency of to promote other users but this is not the case with non-spammers.
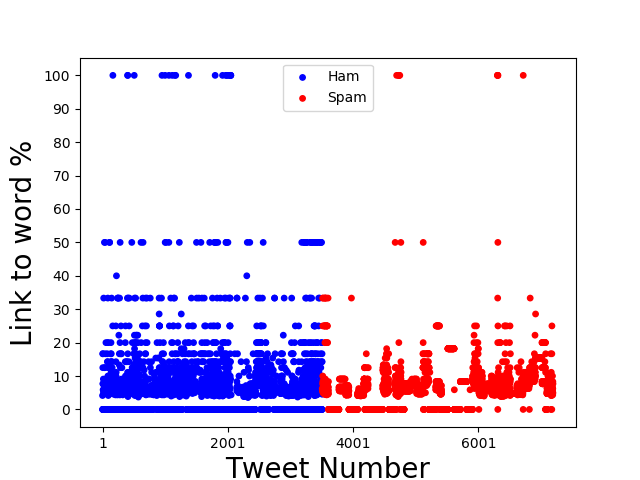
There are some spammers which have a natural tendency to advertise themselves by providing links to their products in the tweets. Link to word percentage L2W can be found by equation (4) where nl is number of links in the tweet and nt is total number of words in the tweet.
| (4) |
It is observed from Fig.4 that spammers usually have low Link to word percentage and the reason for this which is observed from the dataset is that most spammers post tweets which mostly have less words and more link.
4.2 User based features
Text of the tweet alone cannot be used for spam classification. From the dataset which we have made, we can see that users who post spam tweets also have different trends in some of the user based properties like re-tweet percentage, link use percentage, percentage of time user tweeted with same screen name, tweet frequency, upper-case use percentage, standard deviation of tweet length, tweet similarity percentage of the user, number of followers and following, number of tweets, number of lists, number of favourites.
As explained above, tweet similarity percentage plays an important role for spam classification purpose. From Fig.5 it can easily be seen that spammers post mostly similar tweets but the non-spammers don’t. From the dataset it can be seen that spammers only post similar tweets with same agenda every time i.e. to promote a link or user or advertise some of their product. User’s tweet similarity percentage can be calculating by taking average of Ts’s of all the tweets of an user where Ts is calculated by equation (1)
A re-tweet is a re-posting of a tweet. Twitter’s re-tweet feature helps to quickly share that tweet with all of the followers. One can re-tweet their own tweets or tweets from other users. Sometimes people type ”RT” at the beginning of a Tweet to indicate that they are re-posting someone else’s content. It is observed from our dataset that most of the non-spam users have a tendency to re-tweet other posts or there own posts, but in the case of spam users they normally do not post re-tweets however if some of the spammers do re-tweeting then the same tweet is used again and again.
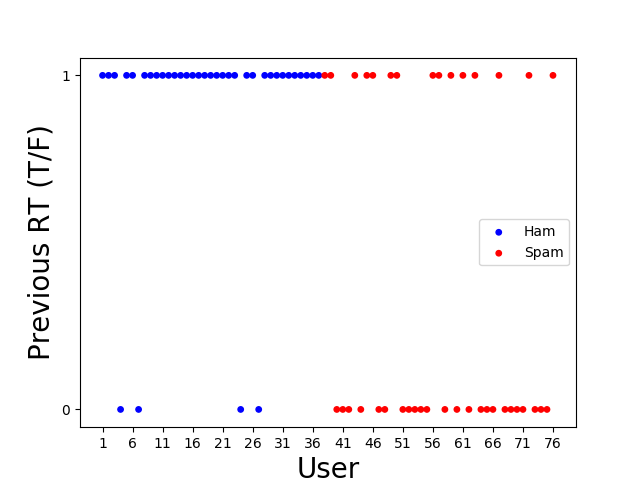
It is observed from Fig.6 and Fig.7 that most of the users who are spammers never post re-tweets or if they do then they only post re-tweets of similar other spam accounts only , but on the other hand most of the non-spam users frequently posts re-tweets.
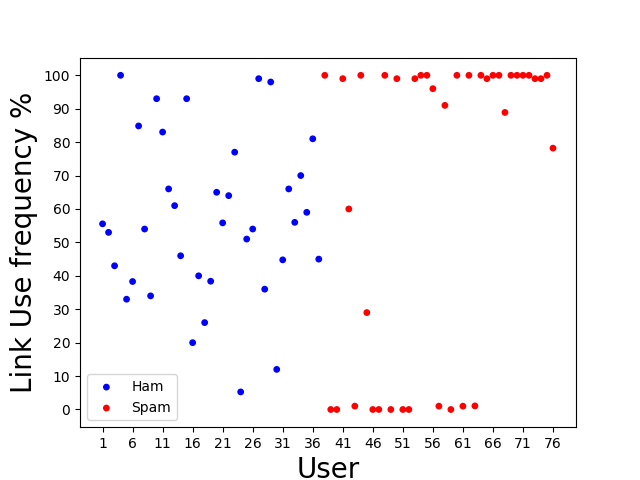

Link/URL use frequency percentage L, is also an important feature for classification of those type of spammers who usually send a high percentage of tweets having links with high frequency. These type of spammers usually post tweets with similar links which are associated with some product they want to advertise about. It can be calculated by equation (5) where nl is number of previous tweets of the users with any links/URLs and nt is total number of tweets of the users.
| (5) |
From Fig.8 and Fig.9 we can see that spammers either have very high frequency of tweets with links or very low but that’s not the case with non-spammers, It is also observed that those spammers which have a high frequency of link use mostly the same set or same links in each of their post which they want to advertise or if they have a very low link use frequency then they are not advertising any link but it is observed that they mostly advertise other user and most of their posts are related to increasing the follow count of other users.
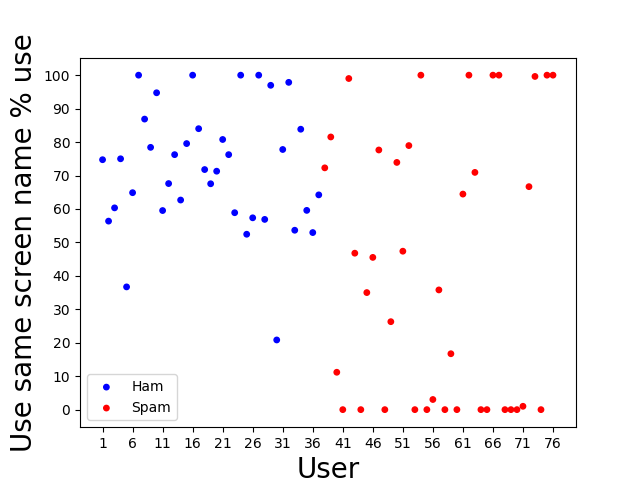
Those type of spammers who have a tendency to advertise other users and get there following to advertise their product uses a lot of screen names in there tweets. So percentage of time user tweeted with same screen name S is calculated by finding the percentage of number of all the unique screen names nus used to all the number of all screen names nts used in all the tweets of the user as shown in equation (6).
| (6) |
From Fig.10 it is observed that normal users mostly use same screen name in there tweets but spammers either use no screen name, from the dataset it is observed that these are those types of spammers who only promote links in there posts but not advertise users. Other type of spammers are those that always use same screen name in their posts and always want to promote same set of user in there tweets. Rest of the spammer don’t use same screen name frequently (They advertise many different users In there tweets).
From Tweepy Twitter API we can also extract the time at which a given tweet was posted. We have used this feature to find tweet frequency of user.
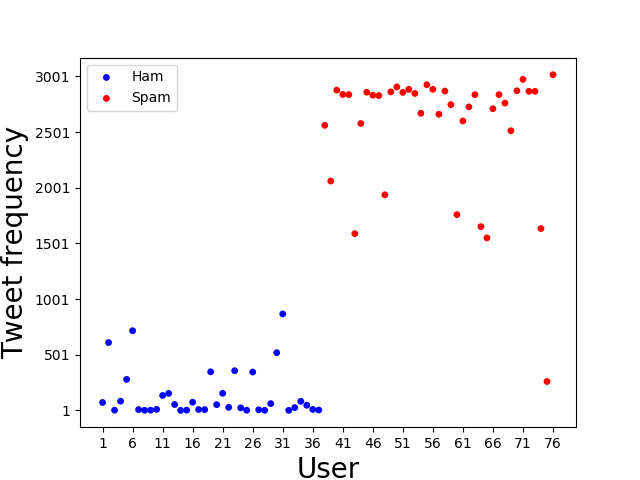
So from Fig.11 we can easily observe that mostly all the spammers have high tweet frequency of tweet and on the other hand normal users have very low tweets frequency. These types of spammers are usually some type of bots. These types of bots tend to post similar types of tweets.
Tweet length is also an important factor. It is observed from the dataset which we have generated that usually there is a lot of variation in the length of the tweet of the normal user but the length of the tweet of the spammers usually remains the same. So we have also considered the standard deviation of tweet-length as an important user-based feature.
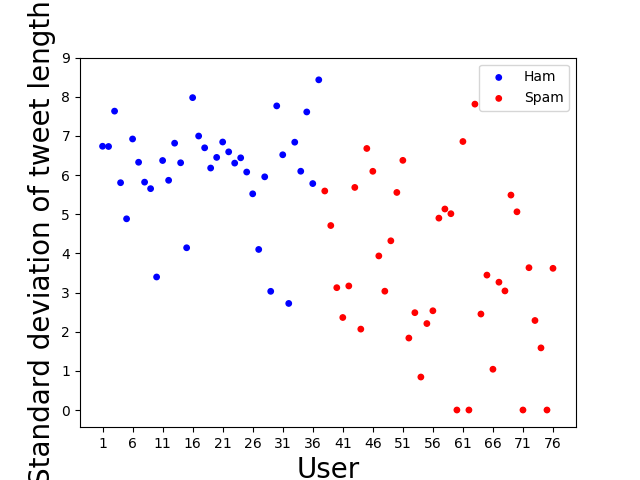
From Fig.12 we can see that most of the spammers have a low standard deviation in tweet lengths which signifies that most of there tweets are of the same length and then from observing the dataset we can see that most of them have the same length and format but there is an only minor change like change in the link in the tweet or change in the screen name but this is not the case with normal users.
As we have discussed above that the upper-case use in the tweets is used for emphasizing certain information within the tweets. This is heavily used by spam users to advertise. So we calculate this by finding the percentage of time the user uses upper-case in their tweets.
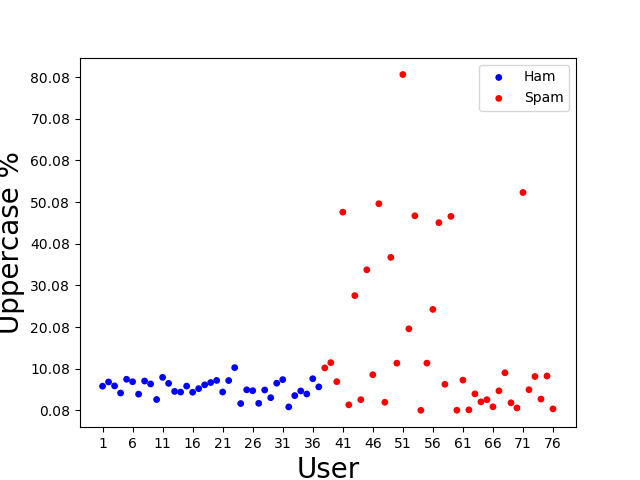
From Fig. 13 we can easily identify that most of the spammers use a high percentage of upper-case words in their tweets but normal users don’t. Other properties considered in this paper are tweet similarity percentage, number of followers, and following, number of tweets, number of lists, number of favorites.
5 Experiment and evaluation
For our experiment we have used the Pearson correlation coefficient for finding the correlation between different features 555https://en.wikipedia.org/wiki/Pearson_correlation_coefficient. In statistics, the Pearson correlation coefficient is a measure of the linear correlation between two variables X and Y. It has a value between +1 and 1, where 1 is a total positive linear correlation, 0 is no linear correlation, and 1 is a total negative linear correlation. It is calculated as shown in equation (7).
| (7) |
Here, cov(x,y) is the covariance; is the standard deviation of x, and is the standard deviation of y.
For evaluation of the classifiers we have used 4 metrics that are precision, recall, F1 score and accuracy. Precision and recall are a useful measure of success of prediction when the classes are very imbalanced. In information retrieval, precision is a measure of result relevancy, while recall is a measure of how many truly relevant results are returned.Precision (P) is defined as the number of true positives (Tp) over the number of true positives plus the number of false positives (Fp).
| (8) |
Recall (R) is defined as the number of true positives (Tp) over the number of true positives plus the number of false negatives (Fn).
| (9) |
These quantities are also related to the F1 score, which is defined as the harmonic mean of precision and recall.
| (10) |
| Model Name | Precision | Recall | F1 Score | Accuracy |
| Our approach | 98.89 | 95.57 | 97.20 | 97.57 |
| SVM | 91.15 | 98.84 | 0.9484 | 95.16 |
| Naive Bayes | 97.05 | 88.67 | 92.67 | 93.70 |
| KNN | 94.11 | 95.2 | 94.65 | 95.16 |
| Random Forest | 97.95 | 96.11 | 97.02 | 96.94 |
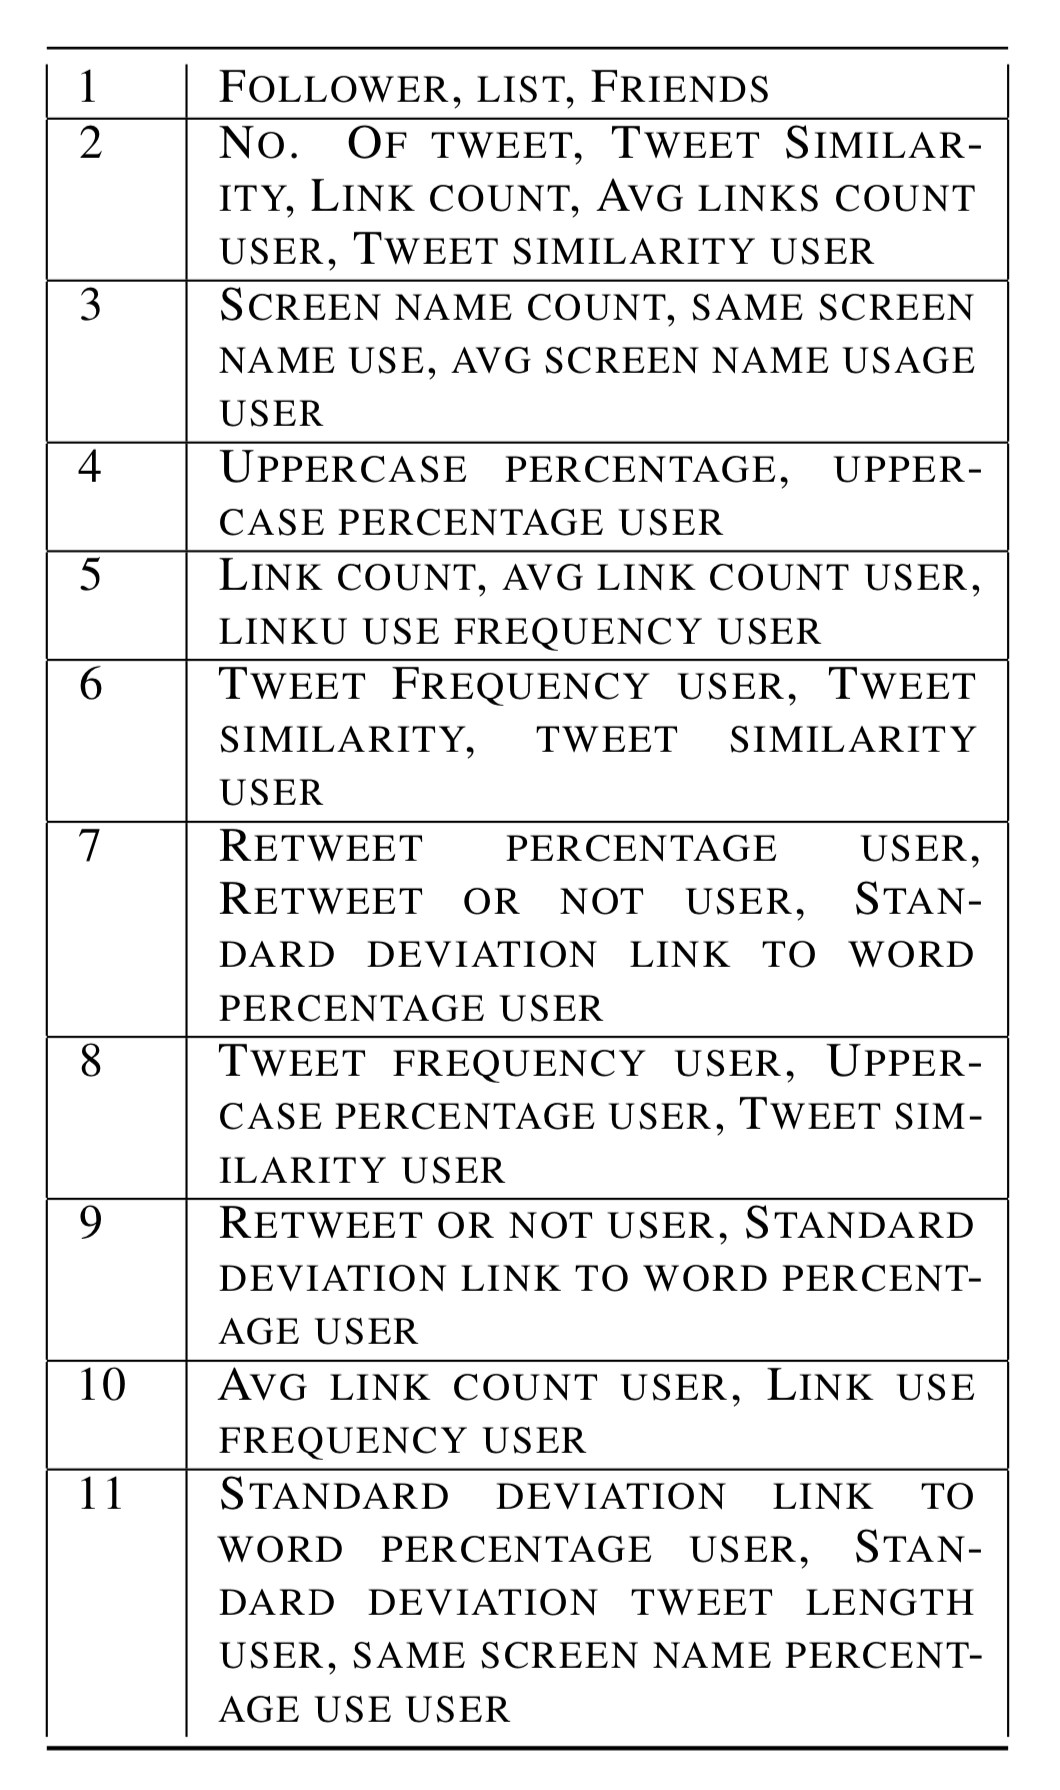
From all the above plots we can see that there are a lot of correlated features so to find the correlation between all 21 different features ,we had made a matrix of all the features and found the Pearson’s correlation value between different features. From these Pearson’s correlation coefficient values we have combined the most correlated features by taking their products. There were 11 sets of correlated features as shown in Table 14. In our model we have used these 11 correlated features and passed it through an artificial neural network having 11 input units, 6 hidden units and one output unit.
6 Conclusion
We identified a total of 21 features related to a tweet that contained attributes from both the tweet and the user the corresponding user. While computing the correlation between the features, it was observed that all the features could be grouped into 11 sets of correlated features. Thus our input for the artificial neural network gets reduced to 11 nodes. We apply the ANN for classification on data collected from Twitter API where we used 80% for training and 20% for test. This classifier showed better performance than the four other classifiers that we compared with namely SVM, Naive Bayes, K Nearest Neighbours, and Random Forest. On testing, it was observed that precision, F1 score, and accuracy improved for the same dataset with Correlational Artificial Neural Network as shown in Table 1. While we saw a slight decrease in the recall value. However, this can be addressed as a future work where we not only look into features of individual tweets but also look at the links and identify patterns between the tweets and the users. It would be interesting to study if this additional information would improve our results further.
References
- Benevenuto et al. (2010) Fabrício Benevenuto, Gabriel Magno, Tiago Rodrigues, and Virgílio Almeida. 2010. Detecting spammers on twitter. In Proceedings of the 7th Annual Collaboration, Electronic messaging, Anti-Abuse and Spam Conference (CEAS).
- Bessi and Ferrara (2016) Alessandro Bessi and Emilio Ferrara. 2016. Social bots distort the 2016 u.s. presidential election online discussion. First Monday, 21(11).
- Ghosh et al. (2012) Saptarshi Ghosh, Bimal Viswanath, Farshad Kooti, Naveen Kumar Sharma, Gautam Korlam, Fabricio Benevenuto, Niloy Ganguly, and Krishna Phani Gummadi. 2012. Understanding and combating link farming in the twitter social network. In Proceedings of the 21st International Conference on World Wide Web, WWW ’12, pages 61–70, New York, NY, USA. ACM.
- Grier et al. (2010) Chris Grier, Kurt Thomas, Vern Paxson, and Michael Zhang. 2010. @spam: The underground on 140 characters or less. In Proceedings of the 17th ACM Conference on Computer and Communications Security, CCS ’10, pages 27–37, New York, NY, USA. ACM.
- Kabakus and Kara (2017) Abdullah Talha Kabakus and Resul Kara. 2017. A survey of spam detection methods on twitter. INTERNATIONAL JOURNAL OF ADVANCED COMPUTER SCIENCE AND APPLICATIONS, 8(3):29–38.
- Kim et al. (2010) Dongwoo Kim, Yohan Jo, Il-Chul Moon, and Alice Oh. 2010. Analysis of twitter lists as a potential source for discovering latent characteristics of users. In ACM CHI workshop on microblogging, page 4. Citeseer.
- Lee et al. (2010) Kyumin Lee, James Caverlee, and Steve Webb. 2010. Uncovering social spammers: Social honeypots + machine learning. In Proceedings of the 33rd International ACM SIGIR Conference on Research and Development in Information Retrieval, SIGIR ’10, pages 435–442, New York, NY, USA. ACM.
- Stringhini et al. (2010) Gianluca Stringhini, Christopher Kruegel, and Giovanni Vigna. 2010. Detecting spammers on social networks. In Proceedings of the 26th Annual Computer Security Applications Conference, ACSAC ’10, pages 1–9, New York, NY, USA. ACM.
- Thomas et al. (2011a) K. Thomas, C. Grier, J. Ma, V. Paxson, and D. Song. 2011a. Design and evaluation of a real-time url spam filtering service. In 2011 IEEE Symposium on Security and Privacy, pages 447–462.
- Thomas et al. (2011b) Kurt Thomas, Chris Grier, Dawn Song, and Vern Paxson. 2011b. Suspended accounts in retrospect: An analysis of twitter spam. In Proceedings of the 2011 ACM SIGCOMM Conference on Internet Measurement Conference, IMC ’11, pages 243–258, New York, NY, USA. ACM.
- Varol et al. (2017) Onur Varol, Emilio Ferrara, Clayton A. Davis, Filippo Menczer, and Alessandro Flammini. 2017. Online human-bot interactions: Detection, estimation, and characterization. CoRR, abs/1703.03107.
- Wang (2010) A. H. Wang. 2010. Don’t follow me: Spam detection in twitter. In 2010 International Conference on Security and Cryptography (SECRYPT), pages 1–10.
- Wang et al. (2013) D. Wang, S. B. Navathe, L. Liu, D. Irani, A. Tamersoy, and C. Pu. 2013. Click traffic analysis of short url spam on twitter. In 9th IEEE International Conference on Collaborative Computing: Networking, Applications and Worksharing, pages 250–259.
- Yardi et al. (2009) Sarita Yardi, Daniel Romero, Grant Schoenebeck, and danah boyd. 2009. Detecting spam in a twitter network. First Monday, 15(1).