Optical coherence of Er3+:Y2O3 ceramics for telecommunication quantum technologies
Abstract
We report an optical homogeneous linewidth of 580 20 Hz of Er3+:Y2O3 ceramics at millikelvin temperatures, narrowest so far in rare-earth doped ceramics. We show slow spectral diffusion of 2 kHz over a millisecond time scale. Temperature, field dependence of optical coherence and spectral diffusions reveal the remaining dephasing mechanism as elastic two-level systems in polycrystalline grain boundaries and superhyperfine interactions of Er3+ with nuclear spins. In addition, we perform spectral holeburning and measure up to 5 s hole lifetimes. These spectroscopic results put Er3+:Y2O3 ceramics as a promising candidate for telecommunication quantum memories and light-matter interfaces.
I Introduction
Quantum light-matter interfaces connecting optical and spin degrees of freedom are important building blocks for quantum interconnect technologies. Their potential applications include optical quantum memories Lauritzen et al. (2011) for long-distance quantum networks Kimble (2008), optical-microwave quantum transductions Kurizki et al. (2015), and nanoscopic quantum sensing Degen et al. (2017). A strong material candidate of quantum light-matter interfaces are rare-earth ion doped solids. The shielded 4f-4f intrashell transitions of rare-earth dopants give rise to exceptionally long optical and spin coherence lifetimes Thiel et al. (2011); Equall et al. (1994); Zhong et al. (2015); Böttger et al. (2009); Rančić et al. (2017).
In particular, erbium (Er3+) is a paramagnetic ion with a half-integer spin (Kramers ion) with an optical transition in the low-loss telecommunication C-band around 1530-1540 nm. When doped into host matrices with low magnetic noise, exceptionally narrow optical homogeneous linewidth () of 73 Hz Böttger et al. (2009) and a long hyperfine spin coherence time of 1.3 s Rančić et al. (2017) have been measured in : and :, respectively. The telecom-fiber compatibility paired with long-lived coherence makes Er3+ an appealing choice for realizing quantum memories in a fiber-based quantum network, as it eliminates the need for photonic frequency conversion. Furthermore, Er3+ has a large gyromagnetic ratio, up to g=15 in : Sun et al. (2008) and g=12 in : Harris (2001), which allow efficient coupling to microwave fields for microwave-optical transduction or coupling to other magnetic targets for sensing applications. On the other hand, the strong magnetism of Er3+ imposes significant challenges to attain long coherence lifetimes due to undesired interactions with other Er3+ ions, phonons, and impurities in the host. Consequently, previous results of long coherence lifetimes were mostly obtained by applying a very large field of a few teslas to strongly suppress these interactions Böttger et al. (2009); Rančić et al. (2017). Alternatively, adverse Er3+-Er3+ spin flip-flops and Er3+-phonon interactions can be suppressed by freezing Er3+ electronic spins at dilution temperatures. This latter technique has been applied to : Kukharchyk et al. (2018) and : single crystals Craiciu et al. (2019).
Compared to : which has been well studied in the literature Böttger et al. (2006, 2009), is another promising host material for Er3+ with low nuclear magnetic moments. One advantage of is its simpler chemical composition and lattice structure, which allows synthesis of micro/nano-structured in different topologies using bottom-up approaches Zhong and Goldner (2019), such as thin films Scarafagio et al. (2019), nanoparticles Bartholomew et al. (2017), and ceramics Zhang et al. (2017), with increasingly good control of the material volume, particle sizes, and doping concentrations. Furthermore, rare-earth doped has already shown promising coherence characteristics. For instance, near radiatively-limited optical homogeneous linewidth of =760 Hz was reported in single crystal Eu: Macfarlane and Shelby (1981). Additionally, =85.6 kHz has been reported for Eu:Y2O3 nanoparticles Perrot et al. (2013) and =4 kHz for transparent ceramics Kunkel et al. (2016). Recently, a narrow inhomogeneous linewidth of 430 MHz and =11.2 kHz in the telecom band have also been demonstrated in : Zhang et al. (2017). To ascertain the full potential of : for quantum technologies, an in-depth coherent spectroscopy at dilution temperatures is thus desirable. An understanding of dephasing mechanisms in : will also provide insights for optimization of the synthesis processes to realize materials with tailored quantum characteristics.
In this work, we measure optical coherence properties of the telecom transition in transparent : ceramics in the 100 mK temperature regime and obtain the narrowest optical homogeneous linewidth measured so far in rare-earth doped ceramics of 580 Hz at an applied magnetic field of 0.7 T. The measured transition shows a slow spectral diffusion of 2 kHz over 1 ms. We systematically investigate field, temperature dependence of and spectral diffusions to determine the dephasing mechanisms, and quantify the remaining broadening due to coupling to elastic two-level systems (TLS) and nuclear spins. We also measure spectral hole lifetimes up to 5 s. Our results of sub-kilohertz optical linewidth with a slow spectral diffusion of : demonstrates a significant potential of this material for telecommunication quantum technologies.
II Experimental Methods
The material under study is transparent 20 parts per million (ppm) doped : ceramics, with dimensions of 9.5 mm x 3 mm x 1.7 mm. This material is made by sintering Er3+ doped Y2O3 nanoparticles (40 nm) in the following way. The nanoparticles are pressed into a pellet in a steel die at approximately 8 Klbs force. This pellet is isostatically pressed at 25 Kpsi in a latex iso-pressing sheath at room temperature, followed by sintering at 1500 °C in air for 2 hours. The pellet is then hot isostatically pressed at 1490 °C for 16 hours at 29 Kpsi under an argon atmosphere in a graphite furnace. The pellet is buried inside Y2O3 powder during HIP to reduce carbon contamination which comes from the graphite furnace. The surface of the sample is polished with a roughness of about 5 nm. This resulted in polycrystals with an average cross-sectional grain size of 0.3 m2. Further details of the sample and manufacturing process are outlined in Zhang et al. (2017).
A fiber-coupled telecom diode laser (Toptica CTL 1500) was used for optical measurements. Two cascaded fiber-based acousto-optic modulators (AOM) at 200 MHz each were used to modulate the frequency and intensity of the laser, giving a 100 dB extinction ratio. The light is sent through a fiber-based circulator, which separated the input and output light from the sample.
The sample was mounted on the mixing chamber stage (MXC) of a dilution refrigerator, and a 3-axis nanopositioner was used for sample optical alignment. Two copper clips were used to secure the sample on a copper stage for increased thermal conductivity. The light exiting the fiber was focused onto the sample with an aspheric doublet, down to a spot size of 12 m, and reflected off the gold-coated sample stage and back into the fiber. This created a double pass configuration through the sample. The percentage of the light exiting the fiber to the light collected back by the fiber was about 30 %. A superconducting 6-1-1 T vector magnet was mounted around the sample. Because the sample is ceramics and has no preferred crystallographic directions, the magnet was operated only along one (6 T) axis.
For lifetime measurements, photoluminescence (PL) was detected by sending a 1.5 s excitation pulse, gated by two AOMs, and the reflection detected by a superconducting nanowire single photon detector (SNSPD). The dark count rate of the SNSPD was measured to Hz, and the detector efficiency was about 80%. For absorption spectroscopy, the light was sent to the sample without AOMs, and the reflection was measured with a photodiode.
For optical coherence spectroscopy, two pulse and three pulse photon echoes with heterodyne detection was used. The light before the AOM was split with a fiber-based 50:50 beamsplitter, and one path was sent through an AOM and to the sample, while the other path was used as the local oscillator (LO). The reflection from the sample and the LO was recombined with another 50:50 fiber-based beamsplitter, and the beating at 200 MHz was observed with a photodiode. A variable attenuator and polarization controller was used for the LO path to optimize the echo intensity.
III Results
III.1 Optical absorption spectroscopy
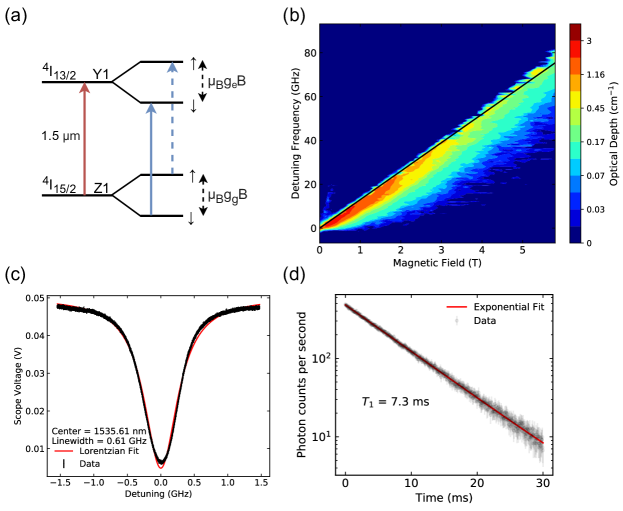
Figure 1(a) shows the energy diagram for the optical transition in the crystal symmetry site. Application of a magnetic field splits each of these crystal field levels into two Zeeman levels. The g-tensor for Er3+:Y2O3 crystals was measured in Harris (2001). For polycrystalline ceramics, the Er3+ ions are randomly oriented, and thus experience different g-factors. We see this in the broadening of the inhomogeneous linewidth with applied magnetic field, as shown in Fig. 1(b). Groups of ions with different g-factors spread out in the frequency domain, due to a distribution of values. For the remainder of this paper, we measure optical coherence and spin lifetimes at frequencies corresponding to maximum optical absorption, as indicated by the black line in Fig. 1(b).
The zero-field absorption spectrum for the Y1-Z1 transition is shown in Fig. 1(c). This yielded a center frequency of 195227.0 GHz and a peak absorption of 87% for an effective crystal length of 3.4mm, corresponding to an absorption coefficient of 3.0 cm-1. The zero field optical inhomogeneous linewidth was 610 MHz full-width-at-half-maximum, which is an order of magnitude narrower than those reported in similar europium doped ceramics Ferrier et al. (2013), and still narrower than previously reported : single crystals Thiel et al. (2011). This indicates low disorder and high purity of the ceramics.
| (1) |
where is the vacuum permittivity, is the electron charge, is the electron mass, is the speed of light, is the index of refraction, is the number density of the dopant, and is the absorption coefficient. Given measured in Fig. 1(c) and the index for Y2O3 at 1535 nm n=1.9, we calculate . From this, we calculate the spontaneous emission time for the Y1-Z1 transition using Liu and Jacquier (2010):
| (2) |
which gives ms.
Figure 1(d) shows a PL decay integrated over ten seconds. The plot is fitted to a single exponential, yielding an excited state lifetime () of 7.3 ms. We confirmed that reabsorption of emitted photons due to large optical depths was not causing lengthening of the lifetime, by measuring the lifetimes at detuned frequencies where the optical depth was lower. From the measured optical lifetime, we obtain a branching ratio for the Y1-Z1 transition as .
III.2 Optical coherence
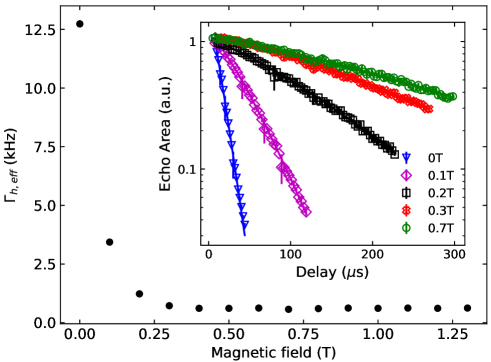
We measure the optical coherence using two-pulse photon echoes width heterodyne detection. The pulse was 500 ns long. The inset of Fig. 2 shows typical photon echo decays at various applied fields, along the black line in Fig. 1(b). At all fields, we observed non-exponential decays, which we fit with the Mims decay Mims (1968)
| (3) |
where is the delay between the two pulses, is the parameter describing spectral diffusion, and is the phase memory time. From the fit, we extract the effective homogeneous linewidth as . The narrowest linewidth of 580 Hz was observed at 0.7 T.
To determine the dephasing mechanisms, we break down the contributing factors to as:
| (4) |
is the contribution from the excited state radiative lifetime. This gives Hz, a negligible contribution to the overall linewidth. includes contributions from two factors. One is instantaneous spectral diffusion (ISD) due to strong optical excitations that can abruptly change the local environment Liu and Cone (1990). This would cause dephasing with increasing power of the second pulse . However, we saw no power dependence of the linewidth, suggesting that ISD does not contribute. Furthermore, previous work on a similar sample has shown no change in the linewidth between 2.0 ppm and 11.5 ppm doped samples, further indicating that ISD does not contribute Zhang et al. (2017). The second contribution to is the resonant Er3+-Er3+ flip-flops Car et al. (2018). From Fig. 1(b), we saw minimal population in the upper Zeeman state at B0.1 T. Due to thermal depopulation of the upper Zeeman state, we expect the dephasing from Er3+-Er3+ flip-flops to be small.
includes dephasing due to the superhyperfine interaction of Er3+ with Y3+ nuclear spins, and is often the limiting dephasing mechanism, known as the superhyperfine limit Kukharchyk et al. (2018). This contribution is usually small, owing to the low nuclear magnetic moment of Y3+, and the large magnetic moment of Er3+ creating a frozen core of yttrium whose flipping rates are significantly slowed Kukharchyk et al. (2018). Since the magnetic noise of Y3+ is independent of field, the characteristic of the superhyperfine limit is a saturation of the homogeneous linewidth beyond a certain field. also includes contributions from hyperfine interactions between the 167Er3+ (22.8% natural abundance) electron spin and its nuclear spin of 7/2 . Additionally for ceramics, there may be magnetic impurities added during the manufacturing process that could increase .
is the dephasing that arises from fluctuations in the local environment (e.g. magnetic, electric fields) due to tunneling between two configurations with similar energy, known as tunneling two-level systems (TLS) Anderson et al. (1972); Phillips (1972). For Er3+-doped systems with TLS, two types of TLS have been observed Macfarlane et al. (2007). One is the elastic TLS modes, which are independent of magnetic field. Another is the coupling between the large anisotropic magnetic moment of Er3+ and the elastic TLS modes, facilitated through elastic-dipole interactions Huber et al. (1984), which we refer to as magnetic TLS. Magnetic TLS noise is expected to decrease with applied magnetic field, as opposed to elastic TLS which is field independent Macfarlane et al. (2007). is often the dominating contributor in amorphous solids Kunkel et al. (2016); Black and Halperin (1977); Breinl et al. (1984), although to a lesser degree in ceramics as compared to glasses. Effects of TLS has been observed in other ceramics Ferrier et al. (2013), and is likely contributing to this material as well. includes spin relaxation caused by three primary phonon scattering processes: the direct one-phonon process, and the two-phonon Raman and Orbach processes Böttger et al. (2006); Sun et al. (2012).
III.3 Field dependence of
at increasing magnetic fields along the maximum absorption line are plotted in Fig. 2. We observed a decrease in linewidth from 12.5 kHz at zero field, to a minimum of 580 20 Hz at 0.7 T. The uncertainty is extracted from the fit as one standard deviation. The linewidth does not change at higher fields. The reduction of with field is indicative of decrease in both Er3+-Er3+ flip flops and magnetic TLS. The subsequent saturation of is indicative of both the superhyperfine limit and elastic TLS. The measured homogeneous linewidth of 580 Hz is about an order of magnitude narrower than previously measured transparent ceramics Zhang et al. (2017); Kunkel et al. (2016), though it is still broader than the -limited value of 22 Hz.
Between magnetic fields of 0.01 to 0.1 T, we observed periodic modulations in the echo amplitudes with . These oscillations decreased in amplitude and increased in frequency as the field was increased from 0.01 to 0.1 T. Two pulse echoes done on Er3+Y2SiO5 show similar oscillations below 0.1 T Car et al. (2018). These strong oscillations prevented accurate fitting and extraction of parameter and .
III.4 Temperature dependence of
To further investigate the dephasing mechanisms, we measured the temperature dependence of homogeneous linewidth at 0.1 T and 0.7 T, as shown in Fig. 3(a) and (b), respectively. At temperatures under 1 K, we see a linear increase of linewidth with temperature, characteristic of TLS being the dominating dephasing mechanism Anderson et al. (1972); Phillips (1972); Flinn et al. (1994); Macfarlane et al. (2004), without any increasing contributions from phonons. At higher temperatures (4K), non-linear behavior attributed to phonon scattering processes would be expected Zhang et al. (2017), but we did not measure in that temperature range due to limitations of our setup. Note that below 100 mK, we see a slight non-linear plateau. This is likely due to the saturation of linewidth caused by coherently coupled TLS pairs Ding et al. (2018), which dominate once the temperature falls under 100 mK where phonon scattering is very weak. It is also possible that the thermal conduction between the sample and the MXC is reduced at these temperatures, so the actual temperature of the sample deviated from the MXC temperature.
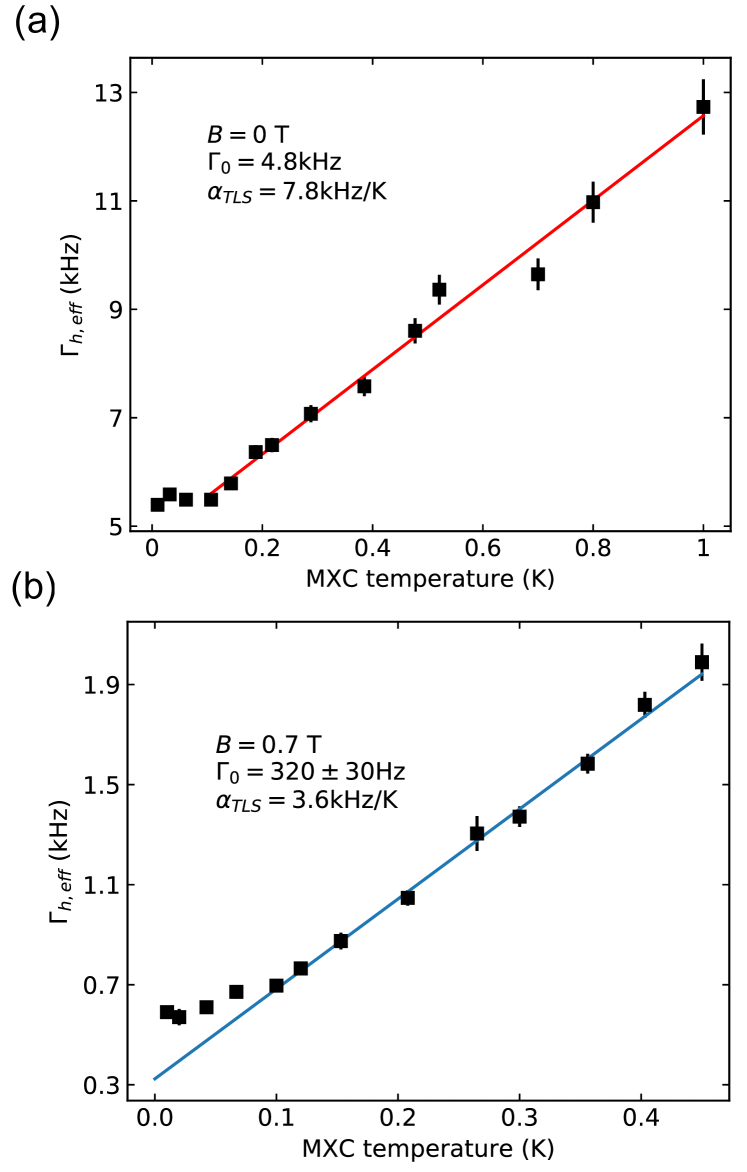
We perform a linear fit in Fig. 3 (excluding the points below 100 mK), according to:
| (5) |
where is the linewidth at 0 K. We obtain fit parameters of kHz and kHz/K at 0.1 T, and Hz and kHz/K at 0.7 T. We first note that the TLS coupling is half at the higher field. The reduction in is likely due to a reduction of magnetic TLS, which have been seen in similar systems Ding et al. (2018); Staudt et al. (2006). Some TLS couples to the strong dipole moment of Er3+, and the subsequent application of magnetic field decouples the two energy levels that constitute the TLS. This leads to lower tunneling rate, thus reducing the magnetic noise caused by TLS. We also note that Hz is thus the linewidth in the absence of TLS.
III.5 Spectral Diffusion
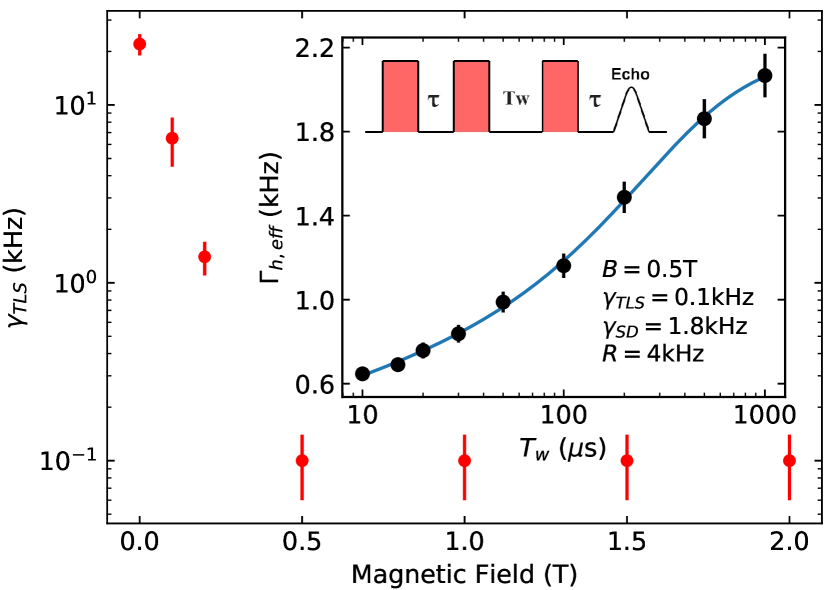
To determine the temporal dependence of the linewidth, we investigate spectral diffusion using stimulated photon echoes (three pulse echoes). Three identical 300 ns pulses were sent, with a delay between the second and third pulse we denote as the wait time . The delay between the first and second pulse was varied to extract the coherence time for a given .
Spectral diffusion caused by spin flips and TLS is described by
| (6) |
where is the homogeneous linewidth in the absence of spectral diffusion, is the broadening due to magnetic spin flips, is the Y spin flip rate, is the TLS coupling strength, and is the minimum measurement timescale, which is 10s. Here we take into account the contribution to spectral diffusion from the superhyperfine/hyperfine spin flips, indicated by the exponential term Böttger et al. (2006), and from TLS, given by the logarithmic term Black and Halperin (1977); Breinl et al. (1984); Littau et al. (1992); Silbey et al. (1996); Koedijk et al. (1996).
We use Eq.(6) to fit the three pulse echo decays, and the data and fit at T is shown in the inset of Fig. 4. We obtain fit parameters of kHz, kHz, kHz, and kHz. At , the fit parameters were kHz, kHz, kHz, kHz. The fitting for The reduction in is likely due to a reduction of magnetic TLS, as evident from the temperature dependence study. We saw no significant change in the diffusion rate with further increase in the field beyond 0.5 T. We also note that our value of at T is about an order of magnitude smaller than those measured in Eu3+:Y2O3 ceramics Kunkel et al. (2016), mostly due to a significantly lower temperature in the current measurement.
Next, we consider the x parameter obtained from the Mims fit of the two pulse photon echo decays, which describes spectral diffusion. For all magnetic fields, x was approximately 1.2-1.3. Previous studies on Er3+-doped glasses that have shown decoherence dominated by TLS reveal x parameters equal to or less than 1 Veissier et al. (2016); Lutz et al. (2017). Meanwhile, crystalline Er3+:Y2O3 at the superhyperfine limit has shown x=1.4 Thiel et al. (2011). Therefore, it is probable that x=1.2 arises from a combination of dephasing due to TLS and Er3+-Y3+ superhyperfine interactions, and the linewidth beyond 0.7 T is limited by both mechanisms.
III.6 Spectral Hole Lifetime
The spectral hole lifetime was measured using hole burning, as a function of applied magnetic field. A hole was burnt using a long burning pulse, shaped by an AOM. After some delay, a frequency sweeping probe pulse was sent to measure the amplitude of the hole. The decay of the hole was fitted to an exponential decay, and the decay constant was extracted to obtain hole lifetimes as shown in Fig. 5.
We see two distinct exponentials, one fast decay for wait times less than 8ms, and a slower decay for longer wait times. We attribute the faster decay to the optical . This slower decay is likely due to long-lived hyperfine levels in 167Er isotopes and is plotted against magnetic field in Fig. 5. We see a small increase in lifetime below 0.2 T field. This is the regime where the electron spin cross-relaxation has been slowed, and the phonon density is still low. As field increases to intermediate values of 0.2-0.6 T, the phonon density increases, suppressing the lifetime. Above 0.8 T, the lifetime increases and plateaus as phonon density is suppressed and the electron spins are frozen, and hyperfine cross-relaxation dominates. This relation is similar to previous studies on Er3+:Y2SiO5 Rančić et al. (2017). At high fields where the narroest are measured, the frozen electron spin indicates spin-phonon relaxation has negligible contribution to optical dephasing.
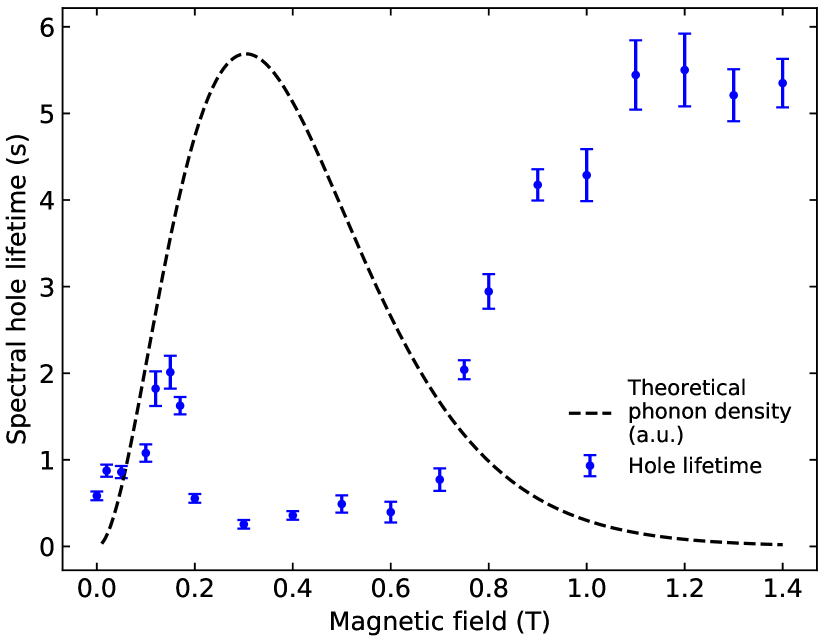
A theoretical phonon density curve is overlaid in Fig. 5. The density of states is estimated as black-body radiation with the frequency of the phonons equal to the ground state Zeeman splitting. The mean ground state g-factor is calculated by taking a spherical average over the 6 equivalent C2 sites, given g-factors measured in Harris (2001). For these measurements, we estimate that the temperature of the ions is K. The increased temperature is likely due to the strong burning pulse, which causes noticeable heating of the sample. We measured the absorption spectrum under similar conditions, and at T, we saw about 40 % of the population in the upper Zeeman state, from which we estimate an actual temperature of 0.5 K. The evident correlation between the phonon density of states and the spectral hole lifetimes suggests that the spin-phonon relaxation plays a role in ceramics similar to that in bulk crystals Rančić et al. (2017).
III.7 Summary of dephasing mechanisms
Here, we provide a summary of the dephasing mechanisms uncovered by the various experiments. At low magnetic fields, there is a combination of dephasing due to TLS, Er3+-Er3+ interactions, and Er3+-Y3+ interactions. The application of magnetic field above 0.7 T effectively suppressed the optical dephasing from Er3+-Er3+ flip-flops, and magnetic TLS.
For ceramics with such a narrow linewidth, it’s plausible that charges on the boundaries between crystallite grains contributes some Stark broadening to the homogeneous linewidth. The Stark broadening was significant in Eu3+-doped nanoparticles in Bartholomew et al. (2017), where they estimated a few kHz broadening from the Stark shift from charges on the surface of the nanoparticles. Following the same methods as Bartholomew et al. (2017) to calculate the possible contributions from charges on the grain boundaries given sub-micron sized crystallites, we obtain tens of kHz of broadening. Because of this, we rule out Stark broadening due to charges on crystalline boundaries.
For the remaining linewidth of about 550 Hz above 0.7 T (after subtraction of contribution), from the results of Fig. 3(b), we attribute approximately 230 Hz to elastic TLS. We are left with 320 Hz for Er3+-Y3+ superhyperfine interactions and possible 167Er3+ hyperfine interactions. Part of the superhyperfine interactions could come from the frozen core, where the large magnetic moment of Er3+ slows the flipping of nearby yttrium nuclear spins.
IV Discussion
The understanding of relevant dephasing mechanisms inform further works to extend the Er3+ coherence lifetimes. With refined synthesis processes, Er3+:Y2O3 ceramics with larger grain sizes (e.g. on the order of a few microns) could yield much narrower linewidths as dephasing experienced by ions far from TLSs on the grain boundaries is reduced. An isotopically purified version of this sample with 167Er3+ would allow us to potentially attain long spin coherence lifetimes by performing spin initialization into a non-Boltzmann hyperfine state and suppressing noise due to nuclear spin cross-relaxations Rančić et al. (2017). The presence of phonon couplings as evident in spectral hole lifetimes in Fig. 5 indicates that phononic band-gap engineering can be used to suppress the phonon density of states in ceramics at spin resonance frequencies Lutz et al. (2016).
The sub-kilohertz , low spectral diffusion, and long spectral hole lifetime qualifies Er3+:Y2O3 ceramics materials for atomic frequency comb (AFC) memories Afzelius et al. (2009). High storage efficiency and long storage time in the AFC scheme requires that the hole-burned spectral features stay narrow throughout its storage time, which remained difficult to achieve and has been limiting the AFC memories based on : to date Lauritzen et al. (2011); Craiciu et al. (2019). Similar requirements also apply to controlled reversible inhomogeneous broadening (CRIB), or gradient echo memories Hedges et al. (2010), for which a sustained narrow optical and long spectral hole lifetime in Er3+:Y2O3 ceramics are advantageous for realizing high performance telecom memories.
We also consider this material for use in single ion quantum devices. Optically addressable single neodymium (Nd3+) Zhong et al. (2018) and Er3+ Dibos et al. (2018) ions in bulk crystals coupled to nanophotonic cavities have been demonstrated. Main limitations in current systems are significant decoherences for ions in proximity to the crystal surfaces and non-optimal alignment of ions with the photonic cavity fields. The use of sub-micron-sized ceramics crystallites could potentially address these issues, for instance, by embedding a Er3+:Y2O3 crystallite in a silicon photonic resonator to achieve deterministic coupling while preserving good optical coherence of individual Er3+ ions. Given the already weak optical dephasing, a realistic Purcell enhancement of the Er3+ emission as demonstrated in Dibos et al. (2018) will render transform-limited emission from single ions, realizing highly indistinguishable atomic photon sources at the telecom band.
V Conclusion
In this work, we measured spectroscopic properties of polycrystalline : ceramics for use as quantum light-matter interfaces. We achieved the narrowest optical homogeneous linewidth of 580 Hz of rare-earth doped ceramics, and measured a low spectral diffusion of 2.1 kHz over 1 ms. We further determine that the dominant decoherence mechanisms to be a combination of elastic TLS, superhyperfine interactions between Er3+ and Y3+ nuclear spins through investigations of field and temperature dependence of the optical homogeneous linewidths as well as spectral diffusions. Our study indicates that transparent : ceramics is an excellent candidate for developing long-coherence quantum interfaces in the technologically important telecom C-band.
Acknowledgments
We are grateful to Charles W. Thiel and John G. Bartholomew for valuable discussions. We acknowledge equipment support from the National Science Foundation EAGER award No. 1843044.
References
- Lauritzen et al. (2011) B. Lauritzen, J. c. v. Minář, H. de Riedmatten, M. Afzelius, and N. Gisin, Phys. Rev. A 83, 012318 (2011).
- Kimble (2008) H. J. Kimble, Nature 453, 1023 (2008).
- Kurizki et al. (2015) G. Kurizki, P. Bertet, Y. Kubo, K. Mølmer, D. Petrosyan, P. Rabl, and J. Schmiedmayer, Proceedings of the National Academy of Sciences 112, 3866 (2015), https://www.pnas.org/content/112/13/3866.full.pdf .
- Degen et al. (2017) C. L. Degen, F. Reinhard, and P. Cappellaro, Rev. Mod. Phys. 89, 035002 (2017).
- Thiel et al. (2011) C. W. Thiel, T. Böttger, and R. L. Cone, Journal of Luminescence 131, 353 (2011).
- Equall et al. (1994) R. W. Equall, Y. Sun, R. L. Cone, and R. M. Macfarlane, Phys. Rev. Lett. 72, 2179 (1994).
- Zhong et al. (2015) M. Zhong, M. P. Hedges, R. L. Ahlefeldt, J. G. Bartholomew, S. E. Beavan, S. M. Wittig, J. J. Longdell, and M. J. Sellars, Nature 517, 177 (2015).
- Böttger et al. (2009) T. Böttger, C. W. Thiel, R. L. Cone, and Y. Sun, Phys. Rev. B 79, 115104 (2009).
- Rančić et al. (2017) M. Rančić, M. P. Hedges, R. L. Ahlefeldt, and M. J. Sellars, Nature Physics 14, 50–54 (2017).
- Sun et al. (2008) Y. Sun, T. Böttger, C. W. Thiel, and R. L. Cone, Phys. Rev. B 77, 085124 (2008).
- Harris (2001) T. L. Harris, Erbium-based optical coherent transient correlator for the 1.5-micron communication bands, Ph.D. thesis, Montana State University, Bozeman, Montana (2001).
- Kukharchyk et al. (2018) N. Kukharchyk, D. Sholokhov, O. Morozov, S. Korableva, A. Kalachev, and P. Bushev, New Journal of Physics 20, 023044 (2018).
- Craiciu et al. (2019) I. Craiciu, M. Lei, J. Rochman, J. M. Kindem, J. G. Bartholomew, E. Miyazono, T. Zhong, N. Sinclair, and A. Faraon, Phys. Rev. Applied 12, 024062 (2019).
- Böttger et al. (2006) T. Böttger, C. W. Thiel, Y. Sun, and R. L. Cone, Phys. Rev. B 73, 075101 (2006).
- Zhong and Goldner (2019) T. Zhong and P. Goldner, Nanophotonics (2019), 10.1515/nanoph-2019-0185.
- Scarafagio et al. (2019) M. Scarafagio, A. Tallaire, K.-J. Tielrooij, D. Cano, A. Grishin, M. H. Chavanne, F. H. Koppens, A. Ringuedé, M. Cassir, D. Serrano, P. Goldner, and A. Ferrier, The Journal of Physical Chemistry C (2019).
- Bartholomew et al. (2017) J. G. Bartholomew, K. de Oliveira Lima, A. Ferrier, and P. Goldner, Nano letters 17, 778 (2017).
- Zhang et al. (2017) H. Zhang, J. Yang, S. Gray, J. A. Brown, T. D. Ketcham, D. E. Baker, A. Carapella, R. W. Davis, J. G. Arroyo, and D. A. Nolan, ACS Omega 2, 3739 (2017).
- Macfarlane and Shelby (1981) R. Macfarlane and R. Shelby, Optics Communications 39, 169 (1981).
- Perrot et al. (2013) A. Perrot, P. Goldner, D. Giaume, M. Lovrić, C. Andriamiadamanana, R. R. Gonçalves, and A. Ferrier, Phys. Rev. Lett. 111, 203601 (2013).
- Kunkel et al. (2016) N. Kunkel, J. Bartholomew, S. Welinski, A. Ferrier, A. Ikesue, and P. Goldner, Phys. Rev. B 94, 184301 (2016).
- Ferrier et al. (2013) A. Ferrier, C. W. Thiel, B. Tumino, M. O. Ramirez, L. E. Bausá, R. L. Cone, A. Ikesue, and P. Goldner, Phys. Rev. B 87, 041102(R) (2013).
- Bartolo (1968) B. D. Bartolo, Optical interactions in solids (Wiley, 1968).
- Henderson and Imbusch (2006) B. Henderson and G. F. Imbusch, Optical Spectroscopy of Inorganic Solids (Oxford University Press, 2006).
- Liu and Jacquier (2010) G. Liu and B. Jacquier, eds., Spectroscopic properties of rare earths in optical materials (Tsinghua Univ. Press, 2010).
- Mims (1968) W. B. Mims, Phys. Rev. 168, 370 (1968).
- Liu and Cone (1990) G. K. Liu and R. L. Cone, Phys. Rev. B 41, 6193 (1990).
- Car et al. (2018) B. Car, L. Veissier, A. Louchet-Chauvet, J.-L. Le Gouët, and T. Chanelière, Phys. Rev. Lett. 120, 197401 (2018).
- Anderson et al. (1972) P. W. Anderson, B. I. Halperin, and C. M. Varma, The Philosophical Magazine: A Journal of Theoretical Experimental and Applied Physics 25, 1 (1972).
- Phillips (1972) W. A. Phillips, Journal of Low Temperature Physics 7, 351 (1972).
- Macfarlane et al. (2007) R. Macfarlane, Y. Sun, P. Sellin, and R. Cone, Journal of Luminescence 127, 61 (2007).
- Huber et al. (1984) D. L. Huber, M. M. Broer, and B. Golding, Phys. Rev. Lett. 52, 2281 (1984).
- Black and Halperin (1977) J. L. Black and B. I. Halperin, Phys. Rev. B 16, 2879 (1977).
- Breinl et al. (1984) W. Breinl, J. Friedrich, and D. Haarer, The Journal of Chemical Physics 81, 3915 (1984).
- Sun et al. (2012) Y. Sun, C. W. Thiel, and R. L. Cone, Phys. Rev. B 85, 165106 (2012).
- Flinn et al. (1994) G. P. Flinn, K. W. Jang, J. Ganem, M. L. Jones, R. S. Meltzer, and R. M. Macfarlane, Phys. Rev. B 49, 5821 (1994).
- Macfarlane et al. (2004) R. Macfarlane, Y. Sun, R. Cone, C. Thiel, and R. Equall, Journal of Luminescence 107, 310 (2004), proceedings of the 8th International Meeting on Hole Burning, Single Molecule, and Related Spectroscopies: Science and Applications.
- Ding et al. (2018) D. Ding, D. van Driel, L. M. C. Pereira, J. F. Bauters, M. J. R. Heck, G. Welker, M. J. A. de Dood, A. Vantomme, J. E. Bowers, W. Löffler, and D. Bouwmeester, “Probing interacting two-level systems with rare-earth ions,” (2018), arXiv:1811.05248 [cond-mat.dis-nn] .
- Staudt et al. (2006) M. U. Staudt, S. R. Hastings-Simon, M. Afzelius, D. Jaccard, W. Tittel, and N. Gisin, Optics Communications 266, 720 (2006).
- Littau et al. (1992) K. A. Littau, M. A. Dugan, S. Chen, and M. D. Fayer, The Journal of Chemical Physics 96, 3484 (1992).
- Silbey et al. (1996) R. Silbey, J. Koedijk, and S. Völker, The Journal of chemical physics 105, 901 (1996).
- Koedijk et al. (1996) J. Koedijk, R. Wannemacher, R. Silbey, and S. Völker, The Journal of Physical Chemistry 100, 19945 (1996).
- Veissier et al. (2016) L. Veissier, M. Falamarzi, T. Lutz, E. Saglamyurek, C. W. Thiel, R. L. Cone, and W. Tittel, Phys. Rev. B 94, 195138 (2016).
- Lutz et al. (2017) T. Lutz, L. Veissier, C. W. Thiel, P. J. Woodburn, R. L. Cone, P. E. Barclay, and W. Tittel, Journal of Luminescence 191, 2 (2017).
- Lutz et al. (2016) T. Lutz, L. Veissier, C. W. Thiel, R. L. Cone, P. E. Barclay, and W. Tittel, Phys. Rev. A 94, 013801 (2016).
- Afzelius et al. (2009) M. Afzelius, C. Simon, H. de Riedmatten, and N. Gisin, Phys. Rev. A 79, 052329 (2009).
- Hedges et al. (2010) M. P. Hedges, J. J. Longdell, Y. Li, and M. J. Sellars, Nature 465, 1052 (2010).
- Zhong et al. (2018) T. Zhong, J. M. Kindem, J. G. Bartholomew, J. Rochman, I. Craiciu, V. Verma, S. W. Nam, F. Marsili, M. D. Shaw, A. D. Beyer, and A. Faraon, Phys. Rev. Lett. 121, 183603 (2018).
- Dibos et al. (2018) A. M. Dibos, M. Raha, C. M. Phenicie, and J. D. Thompson, Phys. Rev. Lett. 120, 243601 (2018).