Energy density at kinetic freeze-out in Pb-Pb collisions at the LHC using the Tsallis distribution
Abstract
The thermodynamic parameters like energy density, pressure, entropy density, temperature and particle density are determined from the transverse momentum distributions of charged hadrons in Pb-Pb collisions at the LHC. The results show a clear increase with the centrality and the beam energy in all parameters. It is determined that in the final freeze-out stage the energy density reaches a value of about 0.039 GeV/fm3 for the most central collisions at = 5.02 TeV. This is less than that at chemical freeze-out where the energy density is about 0.36 GeV/fm3. This decrease approximately follows a law. The results for the pressure and entropy density are also presented for each centrality class at = 2.76 and 5.02 TeV.
pacs:
12.40.Ee, 25.75.Dw, 13.85.Ni, 24.10.Pa1 Introduction
In heavy-ion collisions at the Large Hadron Collider (LHC) quark-gluon matter is created at a very high energy density. After the initial very hot stage, the system expands, reaches chemical equilibrium and then finally freezes-out in a stage usually referred to as the kinetic freeze-out stage. The present paper determines the energy density, the pressure, the entropy density and the particle density at this final kinetic freeze-out stage using the transverse momentum distributions of charged hadrons measured by the ALICE collaboration in Pb-Pb collisions at = 2.76 and 5.02 TeV [1]. For this purpose one needs a description which is thermodynamically consistent, i.e. the following relations must be satisfied:
| (1) | |||
| (2) |
where is the energy density, is the temperature, is the entropy density, is the pressure, is the chemical potential and is the particle density. The Maxwell relations given below follow from this:
| (3) | |||
| (4) |
The following thermodynamic relation must also be satisfied:
| (5) |
Such a description does exist. It is based on the Tsallis distribution [2] given by:
| (6) |
where is the energy of the particle, is the Tsallis parameter which, when approaching 1, makes the function exponential (Boltzmann-like). The chemical potential will be taken to be zero in the present analysis presented below as is appropriate in the central rapidity region at LHC energies.
There exist other, closely related, distributions that have been used to describe transverse momentum spectra, see [3, 4, 5, 6, 7, 8] but these do not offer the advantage of connecting to a full thermodynamic description.
The relevant thermodynamic quantities can be obtained from the following relations
| (7) | |||||
| (8) | |||||
| (9) | |||||
| (10) |
where is the usual degeneracy factor. It is to be emphasized that the variable appearing in equation (6) obeys the thermodynamic relation
| (11) |
and hence, the parameter can be called a temperature, albeit for a system obeying Tsallis and not Boltzmann-Gibbs statistics.
The derivation has been presented in detail in [9, 10]. It has also been shown that it leads to a surprisingly good fit of transverse momentum distributions up to values of 200 GeV/c [11, 12, 13, 14]. A comprehensive comparison with experimental results has been presented in [15] for pp collisions.
The picture of a heavy-ion collision proposed is as follows: the chemical freeze-out happens with Boltzmann-Gibbs statistics leading to a consistent picture of the hadronic yields, kinetic freeze-out follows, this time obeying Tsallis statistics as proposed in this and previous papers, at least for values of the transverse momentum up to 3 GeV and possibly even far beyond. Clearly the Tsallis distribution, being a polynomial one characterized by the Tsallis parameter , contains information about collective flow.
Our paper is organized as follows. In section 2 we discuss the single particle distribution which we use for fitting the transverse momentum spectra of the charged hadrons, and determine the temperature and the Tsallis parameter . In section 3 we calculate the corresponding thermodynamic quantities namely, the energy density, the pressure, the entropy density and the particle density. The values obtained for the energy density are then discussed and compared to values obtained at different stages of the collision and to other closely related energy densities. Lastly, we summarize our results and conclude in section 4.
2 Transverse Momentum Distribution
The Tsallis distribution was first proposed more than three decades ago as a generalization of the Boltzmann-Gibbs distribution [2], and is characterized by only three parameters namely, the Tsallis parameter , the temperature and the volume .
The momentum distribution of particles obtained by using the expression for the particle density given in equation (8) is written as:
| (12) |
When expressed in terms of transverse momentum, , transverse mass, and rapidity, , the above equation takes the following form:
| (13) |
At mid-rapidity, = 0, and for zero chemical potential, as is relevant at the LHC, equation (13) reduces to the following expression:
| (14) |
The transverse momentum distributions of charged particles produced in Pb-Pb collisions at LHC energies are fitted using a sum of three Tsallis distributions. These consist of fits for ’s, ’s and protons. The following expression, at mid-rapidity and , was used to fit the pseudo-rapidity distributions:
| (15) |
where . The relative weights between particles are given by by the corresponding degeneracy factors = = 1 and = 2. The factor 2 on the right hand side takes into account the contributions from antiparticles, and . The extra factor on the right hand side takes into account the change from rapidity to pseudo-rapidity using the relation:
| (16) |
which, at mid-rapidity, becomes:
| (17) |
hence the extra factor of .
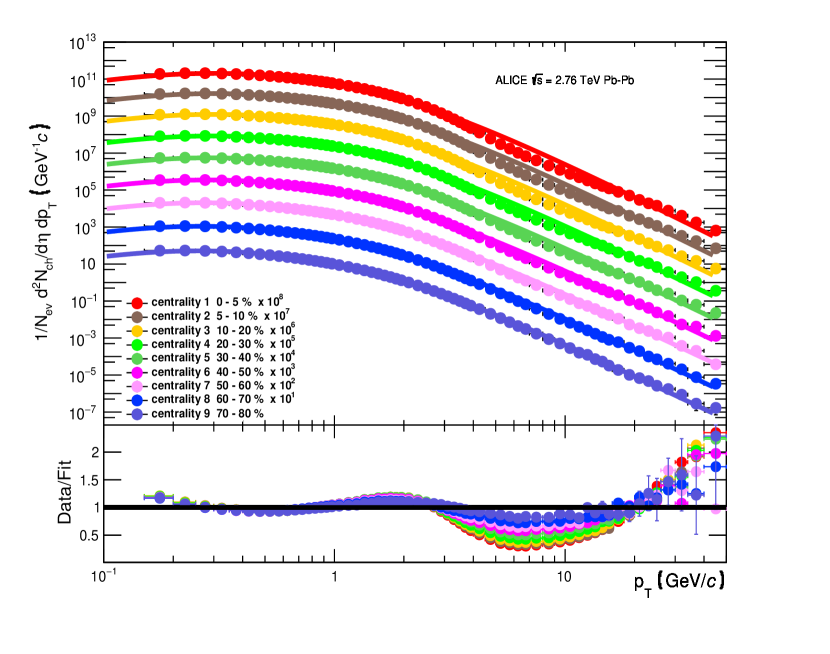
The resulting fits to the experimental data obtained in
Pb-Pb collisions at = 2.76 TeV [1]
are shown in figure 1 where we follow the centrality
classification introduced in [1].
As can be seen in figure 1 the fits are very good for peripheral events and at low ,
gradually worsening for the more central events where
the fits at first overshoot the data above values of about 3 GeV then rejoin the data and at larger values of
above about 20 GeV are below
the data. The same behaviour can be seen for a beam energy of 5.02 TeV in figure 2. We have checked that the
same behaviour is also present in Xe-Xe collisions [16] at 5.44 TeV.
The transverse momentum distributions tend to show an S shape for central collisions, this shape is difficult to reproduce using the Tsallis
parameterization which has only two variables and and the overall normalization fixed by the volume . Clearly one more parameter
would be needed to reproduce the shape for the most central events.
In table 1 we collect all the results for the temperature and the Tsallis parameter obtained from fitting the Pb-Pb data at a beam energy of 2.76 TeV. Note that the temperature varies from just slightly above 96 MeV for the most central events and to about 78 MeV for the most peripheral events. The results obtained this way are consistent with those obtained in analyses using the blast-wave [17] formalism [18, 19, 20] but they are considerably lower than those obtained recently in [21, 22] also the dependence in centrality is reversed. It is to be noted that fits based on the blast-wave model are based on exponentials and never describe data at larger for the simple reason that at large the measured distributions are polynomial and not exponential. As usual, the Tsallis parameter can be determined with an excellent accuracy.
-
Centrality Class (MeV) /NDF 1 (0-5)% 1.1355 0.0009 95.9 1.4 156.5/58 2 (5-10)% 1.1363 0.0009 95.5 1.3 150.4/58 3 (10-20)% 1.1376 0.0009 94.5 1.3 137.9/58 4 (20-30)% 1.1387 0.0009 92.9 1.3 117.3/58 5 (30-40)% 1.1389 0.0009 91.2 1.3 91.47/58 6 (40-50)% 1.1403 0.0009 88.0 1.3 71.39/58 7 (50-60)% 1.1416 0.0010 84.6 1.3 52.88/58 8 (60-70)% 1.1424 0.0010 81.0 1.3 29.8/58 9 (70-80)% 1.1428 0.0012 78.0 1.3 23.16/58
The fits to the experimental data at 5.02 TeV are shown in figure 2 where, as before, we follow the centrality classification from [1]. Again the fits are very good for peripheral events, gradually worsening for the more central events where the fits at first overshoot the data above values of 2 GeV; then gradually rejoin the data at larger values of and in the end undershoot the data.
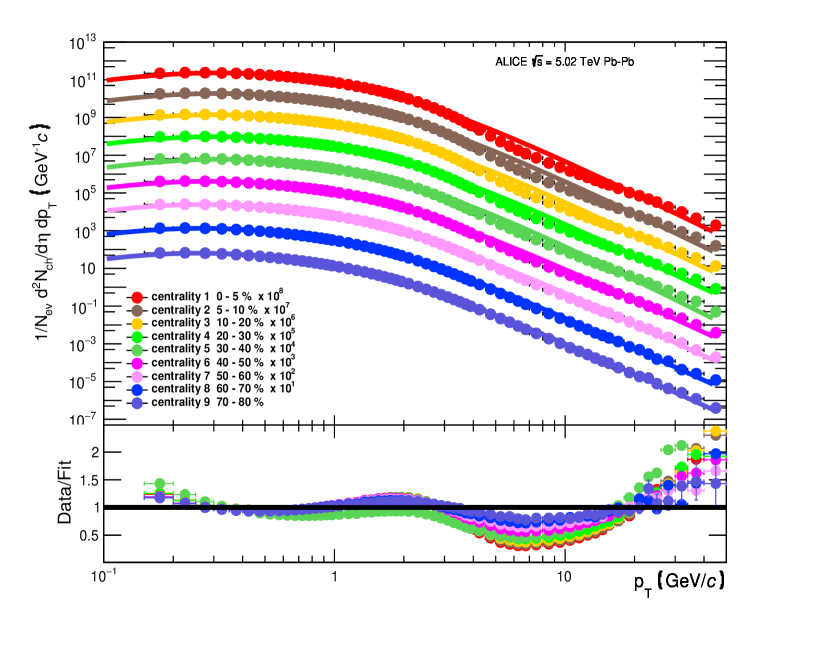
Similar to the procedure followed above, we collect in table 2 the results for the temperature and the Tsallis parameter obtained from fitting the Pb-Pb data at = 5.02 TeV. As in the previous case one has a very good description of the transverse momentum distributions for the most peripheral collisions, again gradually worsening for the most central events where the fits at first overshoot the data at large values of and in the end are below the data. The temperature and the Tsallis parameter have been determined at the two beam energies for all the centrality classes.
-
Centrality Class (MeV) /NDF 1 (0-5)% 1.1405 0.0009 98.2 1.3 163.8/58 2 (5-10)% 1.1413 0.0009 97.8 1.4 154.1/58 3 (10-20)% 1.1424 0.0009 96.8 1.3 142.7/58 4 (20-30)% 1.1438 0.0009 94.8 1.2 126.6/58 5 (30-40)% 1.1449 0.0009 92.5 1.2 104.9/58 6 (40-50)% 1.1467 0.0009 88.8 1.2 86.17/58 7 (50-60)% 1.1478 0.0009 85.3 1.2 61.57/58 8 (60-70)% 1.1489 0.0009 81.3 1.2 37.62/58 9 (70-80)% 1.1503 0.0010 77.4 1.2 30.3/58
3 Thermodynamic Variables
3.1 Energy Density at Kinetic Freeze-Out
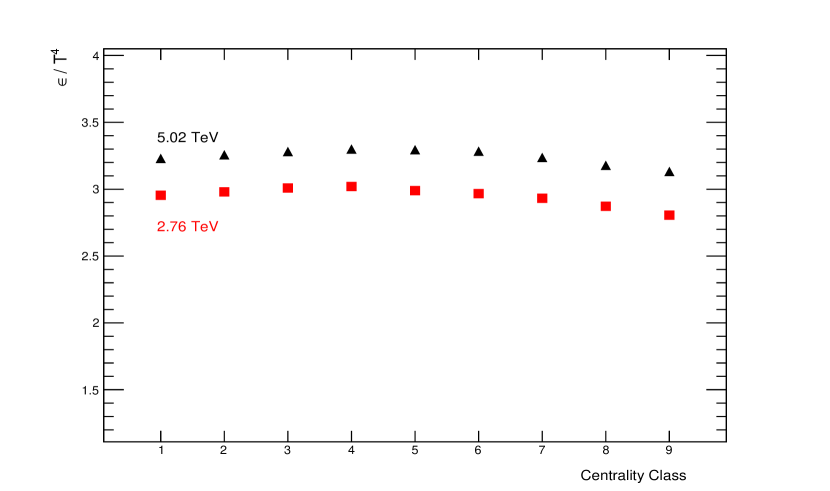
Having deduced the temperature and the Tsallis parameter at kinetic freeze-out from the transverse momentum distributions for two beam energies, we now proceed calculating the energy density given by equation (9):
| (18) |
where . As before, the factor 2 on the right hand side takes into account the contributions from antiparticles, and . The results are shown in table 3 as a function of centrality and compare with a few other energy densities. The entry for the chemical freeze-out energy density has been obtained using the latest version of THERMUS [24] 111B. Hippolyte and Y. Schutz, https://github.com/thermus-project/THERMUS. The latter has been calculated from all hadronic resonances and is not limited to the charged particles only. It has been shown recently that the chemical freeze-out temperature is approximately independent of centrality [18, 26, 27]. For comparison we also show the energy density inside a proton calculated using the charge radius of the proton given as 0.875 fm and the mass of the proton as listed in the PDG [23]. The difference between the kinetic and chemical freeze-out results is not surprising in view of the fact that the energy density changes as for massless particles. In table 3 we also show the energy density obtained in the phase transition region obtained using Lattice QCD [25].
In figure 3 we show the energy density divided by the kinetic freeze-out temperature to the fourth power so as to have a dimensionless quantity. As can be seen in figure, in this case the dependence on the centrality class is strongly reduced.
-
Centrality Class at 2.76 TeV at 5.02 TeV 1 (0-5)% 0.03272 0.00041 0.03933 0.00049 2 (5-10)% 0.03218 0.00041 0.03860 0.00049 3 (10-20)% 0.03153 0.00039 0.03732 0.00047 4 (20-30)% 0.02938 0.00037 0.03487 0.00045 5 (30-40)% 0.02696 0.00035 0.03148 0.00042 6 (40-50)% 0.02339 0.00032 0.02669 0.00036 7 (50-60)% 0.01964 0.00028 0.02241 0.00031 8 (60-70)% 0.01604 0.00025 0.01809 0.00026 9 (70-80)% 0.01356 0.00024 0.01458 0.00023 proton [23] 0.334 chemical freeze-out [24] 0.36 0.07 lattice QCD [25] 0.34 0.16 cold nuclear matter 0.16
An estimate can now be made of the lifetime of the hadronic stage between chemical freeze-out and the kinetic freeze-out using the Bjorken model [28] with isentropic expansion which gives:
| (19) |
For the top 5% central collisions at 5.02 TeV this leads to
| (20) |
where the energy density at kinetic freeze-out has been corrected by a factor 3/2 to take into account the neutral hadrons. i.e. if chemical freeze-out happens at = 10 fm, then kinetic freeze-out happens at = 39 fm. The chemical freeze-out time could be different for different centralities. If the chemical freeze-out time is the same or at least similar for all centralities then one has to conclude that the time between chemical and kinetic freeze-out is longer for peripheral collisions than for central collisions. As a reminder, in the Bjorken model [28], which is an inside-outside cascade, the central region freezes out first while the peripheral region remains hot. As this is a scaling model, there is no natural cut-off time.
3.2 Pressure at Kinetic Freeze-Out
The pressure plays an important role in the hydrodynamic description of heavy-ion collisions, e.g. in the study of shock waves or the speed of sound in a hadronic gas. In the present analysis, the pressure can be determined explicitly from the following equation (10):
| (21) |
where .
As previously, the factor 2 on the right hand side takes into account the contributions
from antiparticles, and .
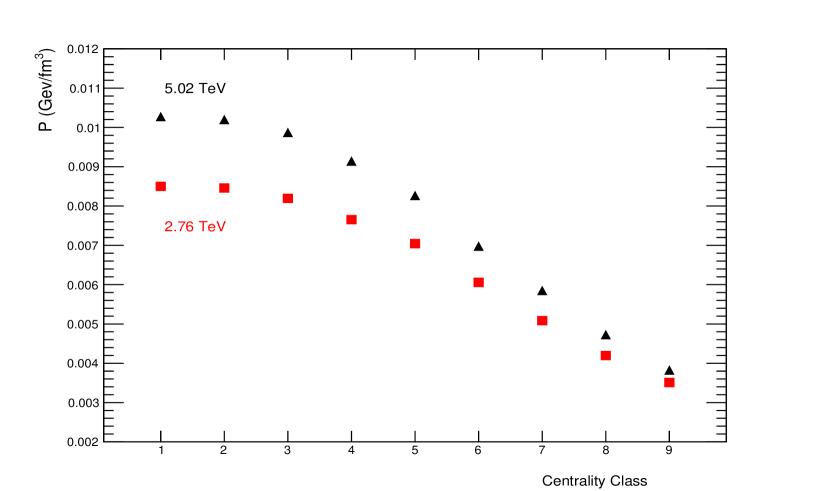
The results are shown in figure 4 where one notices a clear, expected, increase in the pressure when going from peripheral collisions to central ones. We have also checked explicitly that the inequality:
| (22) |
is always satisfied.
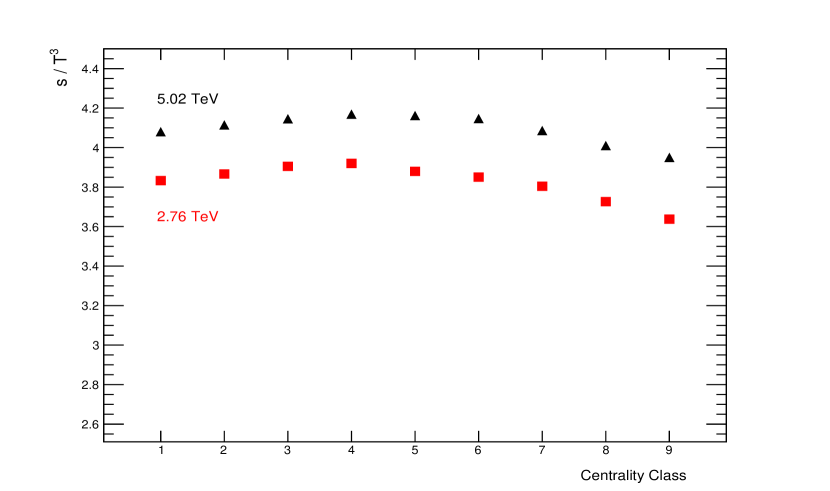
3.3 Entropy Density at Kinetic Freeze-Out
The entropy is an important quantity because it plays a major role in hydrodynamic expansion calculations where entropy is sometimes assumed to be conserved when going from the quark-gluon plasma phase to the hadronic phase. This is for example the case in the Bjorken model [28]. It is difficult to relate it directly to a measurable quantity and it is often indirectly linked to the particle number. In this paper the connection is a fairly direct one and can be obtained using equation (7). More explicitly, the entropy density is given by the following expression where the parameters and are taken from table 1 for Pb-Pb collisions at = 2.76 TeV and table 2 for collisions at 5.02 TeV respectively:
| (23) |
where, as before, . The factor 2 on the right hand side, as previously, takes into account the contributions from antiparticles, and . The results are shown in figure 5 where the entropy density has been divided by so as to have a dimensionless quantity. There is also a small increase when the beam energy is increased from = 2.76 to 5.02 TeV.
We have also checked explicitly that the thermodynamic relation,
| (24) |
holds. This is further confirmation of the consistency of having the chemical potential equal to zero for the collisions under consideration. As this is done at kinetic freeze-out and not at chemical freeze-out, this is a non-trivial observation. At chemical freeze-out the chemical potentials must be zero because of the equal numbers of particles and antiparticles. At thermal freeze-out however it is only required that the chemical potentials for particles and antiparticles be equal but not necessarily zero. It is still legitimate to have chemical potentials at kinetic freeze-out but they change the normalization and no longer determine relative abundancies.
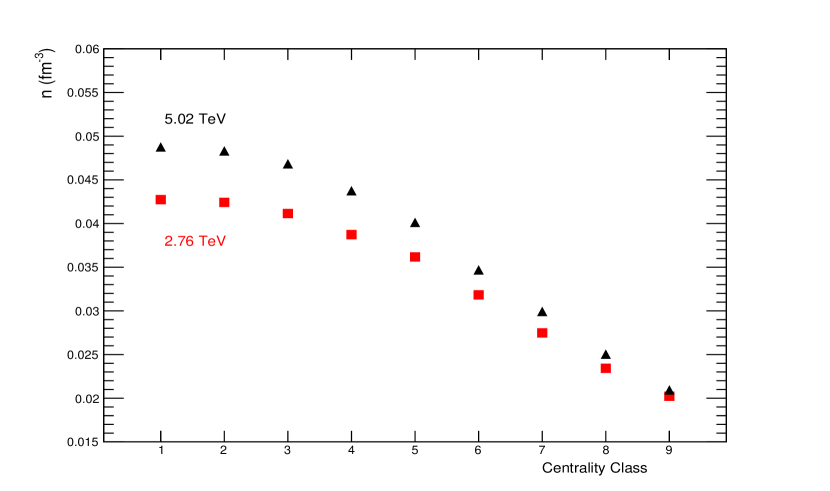
For completeness we show the particle density calculated using equation (8) in figure 6. This is clearly well below the interior density of a heavy nucleus which is 0.17 nucleons/fm3 [23].
4 Summary
The transverse momentum distributions of the primary charged particles measured in Pb - Pb collisions at = 2.76 and 5.02 TeV by the ALICE collaboration [1] have been analysed in this paper using a thermodynamically consistent form of the Tsallis distribution based on equation (6). This gives a very good description of the transverse momentum distributions for the most peripheral collisions, gradually worsening for the most central events where the fits at first overshoot the data at large values of and in the end are below the data, which is a matter of further exploration. The temperature and the Tsallis parameter have been determined at the two beam energies for all the centrality classes. Using the values obtained we then determined the energy density, , pressure, , entropy density, and the particle density, at kinetic freeze-out as a function of the centrality classes. As expected, the values of all the thermodynamic quantities show an increase towards higher centrality class and at higher beam energy. It is determined that in the final freeze-out stage the energy density reaches a value of about 0.039 GeV/fm3 for the most central collisions at = 5.02 TeV. This is less than that at chemical freeze-out where the energy density is about 0.36 GeV/fm3. This decrease approximately follows a law. It can be concluded that, together with the results obtained at chemical freeze-out, the thermodynamic quantities presented in this paper provide information about the evolution of the thermodynamic quantities during the evolution of the hadronic phase from chemical to kinetic freeze-out.
References
References
- [1] Acharya S et al. 2018 \JHEP11 013
- [2] Tsallis C 1988 J. Statist. Phys. 52 479 1988
- [3] Abelev B B et al. 2013 Eur. Phys. J. C 73 2662
- [4] Biyajima M, Mizoguchi T, Nakajima N, Suzuki N, and Wilk G 2006 Eur. Phys. J. C 48 597
- [5] Lao H-L, Liu F-H and Lacey R A 2017 Eur. Phys. J. A 53 44 [Erratum: 2017 Eur. Phys. J. A 53 13]
- [6] Si R-F Li H-L and Liu F-H 2018 Adv. High Energy Phys. 2018 7895967
- [7] Bíró G, Barnaföldi G G, Biró T S, Ürmössy K and Takács Á 2017 Entropy 19 88
- [8] Hui J-Q, Jiang Z-J and Xu D-F 2018 Adv. High Energy Phys. 2018 7682325
- [9] Cleymans J and Worku D 2012 Eur. Phys. J. A48 160
- [10] Cleymans J and Worku D 2012 J. Phys. G: Nucl. Part. Phys.39 025006
- [11] Wong C-Y and Wilk G 2013 Phys. Rev.D 87 114007
- [12] Wong C-Y, Wilk G, Cirto L J L and Tsallis C 2015 Phys. Rev.D 91 114027
- [13] Azmi M D and Cleymans J 2014 J. Phys. G: Nucl. Part. Phys.41 065001
- [14] Azmi M D and Cleymans J 2015 Eur. Phys. J. C 75 430
- [15] Grigoryan S 2017 Phys. Rev.D 95 056021
- [16] Acharya S et al. 2019 Phys. Lett.B 788 166
- [17] Schnedermann E, Sollfrank J and Heinz U W 1993 Phys. Rev.C 48 2462
- [18] Abelev B I at al. 2008 Phys. Rev.C 79 034909
- [19] Chatterjee S, Das S, Kumar L, Mishra D, Mohanty B, Sahoo R and Sharma N 2015 Adv. High Energy Phys. 2015 349013
- [20] Retiere F and Lisa M A 2004 Phys. Rev.C 70 044907
- [21] Prorok D 2019 Eur. Phys. J. A 55 37
- [22] Motornenko A, Vovchenko V, Greiner C and Stoecker H 2019 arXiv:1908.11730 [hep-ph]
- [23] Tanabashi M et al. 2018 Phys. Rev.D 98 030001
- [24] Wheaton S, Cleymans J and Hauer M 2009 Comput. Phys. Commun. 180 84
- [25] Ding H-T, Karsch F, and Mukherjee S 2015 Int. J. Mod. Phys. E 24 1530007
- [26] Sharma N, Cleymans J, Hippolyte B and Paradza M 2019 Phys. Rev.C 99 044914
- [27] Vovchenko V, Dönigus B and Stoecker H 2019 arXiv:1906.03145 [hep-ph]
- [28] Bjorken J D 1983 Phys. Rev.D 27 140