Detecting Network Disruptions At Colocation Facilities ††thanks: This work has been funded by the European Research Council grant agreement no. 338402.
Abstract
Colocation facilities and Internet eXchange Points (IXPs) provide neutral places for concurrent networks to daily exchange terabytes of data traffic. Although very reliable, these facilities are not immune to failure and may experience difficulties that can have significant impacts on exchanged traffic. In this paper we devise a methodology to identify collocation facilities in traceroute data and to monitor delay and routing patterns between facilities. We also present an anomaly detection technique to report abnormal traffic changes usually due to facilities outages. We evaluate this method with eight months of traceroute data from the RIPE Atlas measurement platform and manually inspect the most prominent events, that are: an IXP outage, a DDoS attack, and a power failure in a facility. These case studies validate the benefits of the proposed system to detect real world outages from traceroute data. We also investigate the impact of anomalies at the metropolitan-level and identify outages that span across up to eight facilities.
I Introduction
Internet eXchange Points (IXPs) and colocation facilities have played an important role in the evolution of the Internet[1, 2]. By joining IXPs, lower tier networks are able to exchange traffic at a much lower cost than using traditional transit networks[3], and at the same time experience better network performance[4]. Consequently, IXPs are now critical parts of the global Internet[5, 6, 7] where terabytes of traffic is exchanged daily[8]. The success of IXPs is a double-edged sword as it also means that a disruptive event at a single IXP, or one of its colocation facility, can have an impact across numerous networks. In one example, a power outage on April 8, 2018, at a facility of one of the largest IXP in the world, DE-CIX Frankfurt, had broadly affected Internet connectivity across all Germany[9]. The increasing criticality of IXPs provides a clear motivation for the development of techniques to detect disruptions and performance degradations at colocation facilities.
This work investigates the use of data plane information to detect anomalies at IXP facilities. We leverage existing large scale traceroute results collected by the RIPE Atlas measurement platform to model usual traffic patterns at colocation facilities and detect abnormal changes. The proposed method is composed of two parts: (i) Using IP addresses obtained in traceroutes we infer border routers connected to IXPs and links crossing colocation facilities. (ii) Then we identify abnormal delay and routing changes between facilities using non-parametric statistics.
Both colocation facility detection[10] and abnormal delay/routing detection[11, 12, 13, 14] have been separately addressed in the literature. We study both topics jointly and in the process improve the existing methods. This work complements the literature with several contributions:
-
•
We design a unified method to detect facility outages, outages between ASes peering at an IXP, and facility or IXP maintenances.
-
•
This includes a method, called the Rule-based Constrained Facility Search (RCFS), for the detection of colocation facilities in traceroute data.
-
•
We also adapt existing delay and routing monitoring methods to the particular case of colocation facilities.
-
•
The implemented system provides a unique view on inter and intra facility delays and packet forwarding patterns.
-
•
Reported alarms are ranked by order of importance so network operators can focus only on important anomalies.
Our system is evaluated with eight months of traceroute data from the RIPE Atlas platform. We manually check the most prominent detected outages and cross-validate our results with information made publicly available by the community or IXP operators. We also study the geographical span of outages and found events affecting multiple facilities in the same metropolitan area.
The rest of this paper is organised as follows: First, we define the necessary background (Section II) and our datasets (Section III). Then, we describe the proposed method (Section IV), evaluate it (Section V) and report the existing limitations (Section VI). Finally, we close with the conclusions (Section VII).
II Background
First, we introduce the peering infrastructure terminology and provide background to infrastructure outages.
II-A Internet eXchange Point (IXP)
An IXP is a network infrastructure that facilitates public peering among participant ASes [3]. IXPs usually operate at layer 2 and provide low latency and high throughput solutions to their customers.
Their infrastructure can range from a single switch with a few interconnected members to a distributed system spanning across multiple continents. Large IXPs are deployed in various locations (e.g., colocation centers) to provide their services to numerous networks. The IXP members routers are directly connected to ports of the IXP switches. Upon agreement of the member to the IXP terms and conditions and the successful assignment of an IXP address, the AS is ready to exchange traffic with other IXP participating networks [3].
II-B Colocation Facility (Colo)
Colos are buildings that provide secure places for networks to bring in their equipment and interconnect. Cooling, fire protection, stable power, backup generators, high bandwidth cables are only few of the services they offer to satisfy their customer needs [10]. Big IXPs usually install access switches in multiple colos in the city they operate. Colo customers may then utilize the IXP infrastructure to exchange traffic with members of remote colos [10]. Large companies may also operate multiple colos under the same city and connect them via cross-connect links [10]. This distributed interconnection offers better protection and stability during an outage [15].
The peering options usually available at Colos are: 1) Public peering, where the IXP infrastructure is utilized for the communication (Fig. 1A&B), 2) Private peering, where the two peers directly exchange data either via private IXP links (tethering [10]) or by directly connecting with each other (cross-connect [16], Fig. 1 C,D and E) and 3) Remote peering, where a network not present in the facility remotely connects to the IXP [17].
In this paper, we identify public peering and under certain conditions, also private peering links. The monitoring of remote peering links is not part of this work.
II-C Peering Infrastructure Outages
Colos and IXPs play an important role to interconnect thousands of peers around the world [15]. Power failures, human errors, attacks and natural disasters affecting these infrastructures may be critical for the Internet connectivity of thousands users. Yet, only the most severe outages are publicly reported by mailing lists (e.g., NANOG, outages mailing lists), news websites, and local operators. Consequently, evaluating a facility outage detection tool is challenging due to the lack of ground truth data.
To the best of our knowledge, [15] was the first study that built an automatic tool for detecting peering infrastructure outages in near real time. The authors proposed the use of location information conveyed by BGP communities [18], IXP and colocation websites to geolocate the source of BGP update messages. Observing multiple BGP updates in a short period, triggered their investigation module to examine if they were interconnected with the same colocation facility or IXP. Finally, they used active traceroutes as a mean to validate the disruption in the data plane.
Compared to this past study our work has a more limited scope since it uses only data plane measurements. Yet for the observed facilities we expect to have better monitoring results. BGP is a control plane protocol that reveals some inter-domain connections but based on their routing policies networks usually avoid announcing all their peering on BGP (e.g. private peerings). Using data plane information and the large scale deployment of RIPE Atlas we strive to monitor more peering links and focus only on those that are actually in use. In addition traceroute provides RTT data that allows us to identify detrimental delay increases within and between facilities, for example caused by DDoS attacks (see Section V-C2). This type of events has no impact on the control plane so it is undetected by methods using BGP data.
III Datasets
This work aims to detect network disruptions at colos using traceroutes data. First we seek to identify routers located in colos and then monitor unusual routing and delay patterns for the facilities intra and inter links (Fig. 1). To achieve this, we leverage multiple datasets:
RIPE Atlas built-in and user IPv4 Paris traceroutes measurements from May until December 2015. The built-in measurements consist in traceroutes done every 30 minutes from all Atlas probes (about 10k probes) towards all DNS root servers and a few servers operated by RIPE NCC[19]. In order to be closer to end-users and achieve lower latencies, numerous DNS root server instances are deployed at IXPs. Consequently the root DNS servers make excellent traceroute targets to monitor colos over time. The user measurements are used for a different purpose. Because they are initiated on demand and are usually lasting for a short period of time, we do not use the user measurements for anomaly detection but only to detect additional peering relationships between colo members (Section IV-B).
PeeringDB [20] provides diverse details about IXPs. For example, IP prefixes used for peering LANs, the facilities where IXPs are present, and ASN of member networks. This database is maintained by IXP and network operators. We query PeeringDB to first identify IXP addresses in the traceroute path and then extract candidate facilities. Although, our closest available snapshot is one year after the traceroute measurements (24/09/2016) we assume it is still accurate.
CAIDA’s Internet Topology Data Kit (ITDK [21]). Our facility detection algorithm seeks for IXP addresses in traceroute, but routers do not always answer with their IXP interface [22]. We utilize ITDK’s IP to alias resolution dataset to identify alias IXP interfaces in the traceroute’s path. We use the aliases resolved by MIDAR [23] and iffinder [24] which yield the highest confidence with very few false positives. Since ITDK becomes available every 6 months we use the closest snapshot produced on August 2015.
Routeviews prefix-to-AS map. PeeringDB provides AS to facility mappings. To retrieve the ASN of IP addresses found in traceroutes we use daily dumps derived from Routeviews between May and December 2015. We make such conversions from traceroutes only when it is necessary to identify the facility (Rule 3&5 of section IV-B).
All datasets are also available for IPv6, something not taken under consideration in this study. Networks may establish different peering decisions over IPv6 paths [25, 26]. Furthermore, IPv6 may be affected differently by RTT delays [27]. A comparison between IPv4 and IPv6 anomalies would be interesting but this is left for future work.
IV Methodology
Using traceroute data we aim to detect delay and forwarding anomalies at colos. To achieve this goal we propose to model the usual delay and forwarding patterns observed between colos and detect deviant patterns. Specifically, the proposed system performs the following steps every one hour: 1) It examines the built-in measurements to detect IXP connected routers (Section IV-A) then 2) identifies the colos involved in the peering communication (Section IV-B & IV-C) and finally 3) computes delay and forwarding patterns and detects anomalies (Section IV-D).
| Notation | Meaning |
|---|---|
| Alias(X) | The alias interfaces of IPX (Includes IPX) |
| AS(X) | The ASN of IPX |
| F(X)= { , … , } | Facilities where the network X is present |
IV-A IXP Identification
The goal of this step is to isolate IP addresses related to colos. Since IXPs are usually located at colos and peering LANs are easily identifiable in traceroutes, we use IXP addresses to find traceroutes traversing colos.
In the beginning, we parse the built-in traceroutes and extract the IP path. We sanitize it by removing hops with errors or invalid IPs (i.e. *). For the remaining clean path we query PeeringDB to check if any of the observed IP addresses belong to IXP peering LANs. If such an IP is found we extract the IXP and the previous IP hop (e.g., those of IPA&B in Fig. 2). Since an IXP appears in the path, we conclude that the traceroute traversed a public peering link.
Private peering is harder to identify because no IXP address appears in the path (like in Fig. 1C,D,E). Instead we check if alias IPs are used that are assigned to routers with IXP interfaces. Upon finding two sequential ones we extract the corresponding hops (e.g., those of IPA&C in Fig. 1C).
At the end of this step, we obtain IP hops related to colos. In the next step we use the IP of the first and the IP of the second hop to detect the corresponding near-end and far-end colo. We call them near and far-end with respect to their order in the traceroute path.
IV-B Facility Detection Phase (RCFS)
To identify the colos, we improve the constrained facility search (CFS) method[10] to better exploit the information provided by PeeringDB. The original algorithm combined IXP information from multiple sources but in doing so it ignored useful mappings between the IXP address and the AS of the customer (refer to rule 2).
In our experiments with PeeringDB we observed that the IXP to facility mappings are more reliable than the AS to facility mappings. This is the case mainly because IXPs tend to carefully maintain their PeeringDB entries to attract new customers [3]. However, AS entries may be outdated or contain limited information, e.g. for security concerns. Based on these observations, we propose a rule (RCFS) model which strategically constrains the facility search for the specific case of PeeringDB.
Following the example of Fig. 2 for each extracted hop we first consider the IXPs in the alias list (Rule 1&2) then the remaining AS information of this list (Rule 3) and finally, if we could not identify the colo, the IXP and AS information of the next hops (Rule 4&5). If possible, we avoid IP to AS conversions for border routers as they are prone to errors.

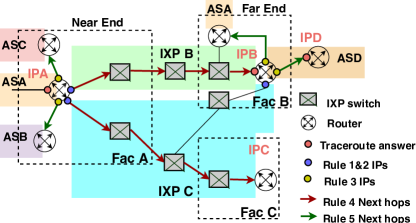
The detection of the near-end colo is thoroughly described below using IPA. The same method can be applied for the detection of the far-end using IPB. Each rule receives as input the candidate colos of the previous rule then constrains them and forwards them to the next rule. The algorithm stops when either a single candidate remains or none due to conflicts between rules. Note that rules can be skipped. For example, if there is no alias for an IP then R3 output is R3 input.
Rule 0: User yielded information. We allow the user to specify IP interfaces that are known as belonging to a colo router. If such an IP is found then we conclude that the traceroute traversed the specified colo. We use this rule to map a few known IPs close to the DNS Root servers [14] that were missing from PeeringDB.
Rule 1: Facilities of the IXP.
We begin by looking for IXP addresses in the Alias(IPA) list. If such addresses are found we fetch from PeeringDB all the colos of the identified IXP. Notice that a router may be connected to multiple IXPs. In Fig. 2, the router of IPA is connected to IXPAC. This allows to further constrain the candidate colos:
.
Since we obtained several colos, we proceed to Rule 2.
Rule 2: Facilities of the IXP address.
IXP operators report on PeeringDB the addresses they assign to their customer networks.
If in Rule 1 we observe such an IXP address, we retrieve the customer’s ASN from PeeringDB’s IXP page. Then the colos where the customer is present.
We intersect these results with the ones of Rule 1.
In our example, the router owner is
thus . This rule was not useful for the near-end. It is important though for the far-end as it reveals the AS of the far-end connected peer which is not always visible in the traceroute.
Rule 3: Facilities of the alias ASNs.
When the IXP data are not sufficient we instead focus on networks peering inside the colo. First, using Routeviews we convert each non-IXP address of the Alias list to the corresponding ASN. Then for each AS we fetch the candidate colos from the ASN pages in PeeringDB.
The final results of this rule are the colos where all the ASes and the IXP (if any from R1/R2) are present.
In our example, the router with IPA is connected to routers of and .
If ASB used addresses of its domain to establish the peering interconnection it is visible in the alias list thus, .
Sometimes, incomplete AS/IXP entries may return no candidate colos. We ignore those. If all R1, R2, R3 are skipped we stop the facility identification here.
The following rules focus on the next hops. Although useful we avoid using them sooner because of traceroute problems, e.g. routers answering from another interface [28] or load balancing not be mitigated by Paris traceroute [29].
Rule 4: Facilities of next hop (IXP).
Midar’s alias resolution has a small false positive rate yet false negatives are possible. This means that IXP addresses may be missing from the alias list in Rule 1.
Assuming that routers answer with their inbound interface, the IXP of the near-end is surely observed after crossing the IXP link (IPBC in Fig. 2).
Rule 4 takes advantage of this observation to constrain with colos of undetected IXPs that appeared in the next hop. We consider as next hops all those that appeared in the built-in and user defined measurements during the same day.
Rule 5: Facilities of next hop (AS).
As a last resort, following the idea of Rule 4 we pick all the alias(es) of IPA and for each IP we resolve the next hop AS(es).
Our goal is to reveal additional peerings between and networks that were not observed in Rule 3.
Then we utilize the colos of these ASes to constrain our facility search.
However, for colos that are geographically close, cross-connect links may cause wrong inferences (e.g., Fig. 1D&E).
In order to mitigate this problem, we independently intersect each new peer’s colos with the results of Rule 4.
Among the independent intersections we pick as candidate the colo which appeared in the majority if it accounts at least 75 of those intersections.
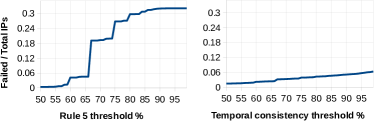
The 75% threshold is empirically found with our traceroute dataset. Compared to the 100% threshold which discards 32% of the IPs the 75% discards 26.7% as depicted in Fig. 3 (left). This allows identification of a few additional colos, 5.3% in total. Although, there is the possibility of some incorrect inferences, we consider this threshold beneficial for identifying routers used to establish multiple peering relationships.
At the end of this step, we temporarily store the near-end and far-end identifications. In the next step we make the final colo decision. Note that for the case of intra-colo links the near-end and far-end colos are the same (like in Fig. 1B&C).
IV-C Temporal Consistency
Some of our datasets are daily updated, hence outlier values may temporarily appear and punctually impact the facility identification results. To address this issue we check the stability of the IP to facility mappings across time and clean aberrant results. Fig. 3 (right) depicts that only a few IPs (6.3) are unstable.
IV-D Anomaly Detection
Links between colos are critical. Disruptions on these links may cause connectivity problems to thousand Internet users. We adjust the techniques of [14] and build a simple tool to detect abnormal patterns for the specific case of colos. First, we compute the forwarding pattern of each colo (Section IV-E) then, the delay of each near-end link towards the far-end (Section IV-F) and, lastly we compare those two patterns to computed references to detect anomalies (Section IV-G).
IV-E Forwarding Model
We collect traceroutes for each Atlas probe, extract the colos, and count the number of times links between colos are traversed. From all different probes, we aggregate those counters to produce the forwarding pattern of each near-end colo. We compare it to a computed reference that represents usual patterns (see Section IV-G).
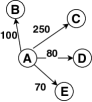
Figure 4 illustrates an example of this pattern for the near-end (A) towards each far-end (B,C,D,E). The usual forwarding pattern computed at hour t-1 is . In the next hour, we notice an unusual decrease in the packets towards B and C accompanied by a similar increase towards facility D.
To detect anomalous patterns, we test for homogeneity with the chi-squared test and the following null hypothesis:
Null hypothesis: The observed data for an hour is consistent with the normal reference computed from the previous hours.
Alternative: The observed data is not consistent with the normal reference.

Since Atlas probes traceroute the same destination every 30 minutes, under normal network conditions, we expect the current pattern to be consistent with the distribution of the reference. For the chi-squared test we set a significant level of 0.01 under which we reject the null hypothesis and report an alarm. Since, this type of test does not work properly for small expected values (), we sum counts from far-end colos with less than 5 packets into one variable.
Usually only few paths are responsible for a forwarding anomaly. Suppose is the anomalous pattern and the computed reference. We reuse the responsibility metric defined in [14] to detect which path caused an anomaly:
The responsibility metric values range from [-1, 1]. Negative values stand for paths with an unusually low number of packets. Positives values represent an unusually high and values close to zero for normal situations.
IV-F Delay Change Detection
Estimating delays for intra and inter facility links is not a trivial task because of traceroute limitations, such as path asymmetry and RTT variability [30, 31, 14].
In [14] a technique is proposed to address these challenges when a link is observed by a sufficient number of probes with different return paths. That technique monitors the shifts in the distribution of the median differential RTT() and distinguishes strong alarms. Since, colo links are usually monitored by multiple probes from different ASes with disparate return paths, we implement that monitoring technique.
From Section IV-A we extracted the IP hops and the RTT values. In Section IV-B we found the facilities. So for the traceroute of Fig. 2 . We group all values from the same near-end towards the same far-end colo and calculate the median over those to ensure that an anomaly will trigger only if the majority of RTT values between the two facilities get affected. Note that multiple routers of colo A and colo B may be involved in this grouping. Like in [14], we calculate confidence intervals for both the observed and the reference to detect significant statistical changes. If those confidence intervals stop to ovelap we report an alarm like those of Fig. 7.
IV-G Reference Computation
The normal reference to detect anomalies is computed every hour using exponential smoothing for both the forwarding and delay patterns:
Where is the reference of the monitored link, and the reference forwarding pattern of the facility. Likewise, and are the reference patterns of the previous hour and, and are the current observed values. The exponential smoothing parameter , controls the importance of new measures as opposed to previous observed ones. In our case, we set a = 0.03 to mitigate faster the impact caused by sudden anomalous bursts.
The initial reference value and are quite important when is small. To solve the cold start problem, we calculate them over the median of the values observed during the first day of our analysis. We maintain a different reference for each facility and update them at each one-hour time bin.
V System Evaluation
Now we evaluate our proposed rules and their assistance in identifying facilities. Then, we discuss the anomaly detection results and present the most significant detected disruptions. Anomaly detection systems are usually evaluated in terms of true positives and false posititives, however, in our case such validation is challenging since confidential information is needed both for the facility detection and alarm validation.
We verify the correctness of our anomaly detection system by checking our top reported alarms, and the public reports of major outages that took place in 2015. In our results we report anomalies caused by an IXP outage on May, a power failure in colocation facility at mid November and a DDoS attack at the end of November.
V-A RCFS Evaluation
We evaluate our facility identification method, RCFS, with the built-in measurements from May until December 2015. On average, each day we analyze 12 million traceroutes and extract 14.500 unique router interfaces potentially located in colos forming 14 million IP interconnections. This large number of interconnections is due to the rich inter-IXP connectivity [32].
To understand the contribution of each RCFS rule, we picked a smaller dataset, from May to August, and inspected in details the identification results per rule. For this smaller dataset RCFS consistently identifies facilities for 4000 of the 14500 interfaces (28%).
Table II and Fig. 5 depict the contribution of each rule for the facility identification. We observe that the first three rules are responsible for 39 of the detected facilities. For the rest 61, next hop information is required (Rule 4&5). Rule 4 is responsible for the majority of identifications since, the near-end colo requires knowledge of the IXP whose IP interface usually appears in the next hop, e.g. like in Fig. 1A&B. In our experiments we also used Rule 0 to map a few IPs () not listed in PeeringDB but on the IXP websites.
| Average % | Rule 0 | Rule 1 | Rule 2 | Rule 3 | Rule 4 | Rule 5 |
| Successes % | 0.097 | 5.391 | 18.188 | 15.289 | 46.731 | 14.301 |
| Failures % | 0 | 0.604 | 2.803 | 23.823 | 19.224 | 53.543 |
| Unique Router Interfaces observed per day: 14.500 | ||||||
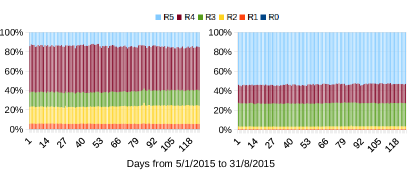
Similarly, the right-hand side plot of Fig. 5 reveals the rules where the identification failed. RCFS fails identifying the colo when the search space becomes empty. Failures at the last rule 5 usually mean that we are unable to detect sufficient peering relationships to constrain the candidate colos. As shown in Fig. V-A, this is the case for about 85% of the IPs. For these interfaces we would require additional active traceroutes either from RIPE Atlas or from other sources (e.g. CAIDA Ark).
From the above figures, we clearly observe that our results are consistent and stable over time. This is required for the anomaly detection to safely identify pattern discrepancies.
![[Uncaptioned image]](/html/1911.04866/assets/x7.png) \captionof
\captionof
figureCovergence vs threshold failure for the IPs of rule5
![[Uncaptioned image]](/html/1911.04866/assets/x8.png) \captionof
\captionof
figureThe Duration of alarms of the detection modules.
V-B Anomaly Detection Evaluation
From the 4000 daily interfaces between May and December 2015 we monitor links between 264 facilities. From those colos, 156 were reported as anomalous at least once. In total we found that the observed patterns deviate from the computed references 13135 times for the forwarding analysis and 19850 times for the delay analysis. 61 of the forwarding alarms last less than 1 hour while, 81.6 and 90.8 last less than 3 and 8 hours respectively (Fig. V-A). Similarly, 59 of the differential RTT alarms last less than 1 hour while 81. and 90.3 last less than 3 and 6 hours respectively.
The cause of network disruptions in colos is usually short lived yet traffic patterns can be affected for multiple hours. For instance, for the AMS-IX outage described in Section V-C1, a 10 minute disruption in the IXP affected the forwarding patterns of colos for 2 hours. Longer lasting alarms are indications either of permanent routing changes (Fig. 8) or of a strong alarm corrupting the reference value (Fig. 7). In both cases, the alarm will continue to be reported until the reference converges to new observations.
Our system is sensitive to small pattern changes, but, as described below, we can focus only on significant anomalies by ranking alarms based on their deviation from the reference.
V-B1 Ranking Delay Anomalies
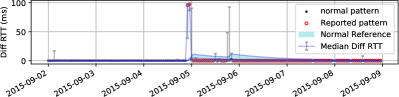
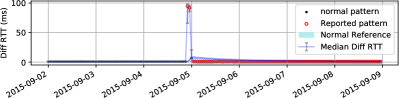
When we detect a differential RTT anomaly we calculate the deviation between the reference and the observed confidence intervals (eq 6 in [14]). We use this metric to rank the differential RTT anomalies after we remove those where both a delay change and a forwarding anomaly occurred. This is because a change in the forwarding pattern is likely to affect the median RTT and thus to create a false alarm. Among the top-80 alarms in Fig. 6 we observe 3 outstanding cases.
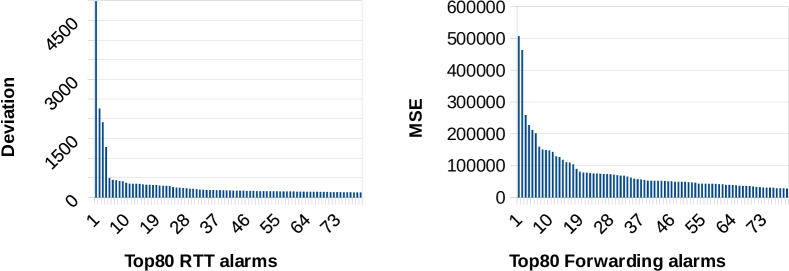
The first case affected Equinix London LD5 on 2015-9-4 22:00 UTC for 2 hours. We observe both intra and inter facility links getting congested (Fig. 7). The second was due to a DDoS attack at the end of November (described in details in Section V-C2). The third stands for delay changes on a link that connects Interxion Frankfurt(FRA1-12) with Speedbone Berlin on 2015-6-8 19:00 UTC. Validation from public sources was only possible for the DDoS outage.
V-B2 Ranking Forwarding Anomalies
We use the mean squared error to quantify the change in the forwarding patterns of each near-end facility:
where is the number of far-end colos, and the observed and the reference forwarding pattern towards far-end colos.
All top alarms report significant changes in the number of traceroute passing through a link like the example illustrated in Fig. V-B2. Such spikes may happen due to inter-facility link failures or routing changes. We hypothesize that the two one-month apart alarms of Fig. V-B2 are due to maintenance work.
![[Uncaptioned image]](/html/1911.04866/assets/x12.png) \captionof
\captionof
figureTop1&4 forwarding alarms from Equinix Frankfurt(FR7) to Equinix Amsterdam(AM7) at 10-6-22:00 & 11-5-22:00 UTC.
![[Uncaptioned image]](/html/1911.04866/assets/x13.png) \captionof
\captionof
figureUsual number of affected facilities in the top10 cities. * annotates unusual outages.
V-B3 Detecting Metropolitan Outages
To further validate our system, we quantify the impact of detected anomalies on colos of the same metropolitan area. We first extract each facility’s address and use the Google Maps API to obtain the local city’s GPS coordinates. Then, using those coordinates we calculate the Vincenty distance between each colo and map the ones closer than 50km to the same metropolitan area.
We focus only on the metropolitan alarms with the largest impact by filtering out all those that don’t include forwarding anomalies with . Table III annotates the top-10 metropolitan areas based on the number of such observed alarms. Usually most alarms affect only a few facilities in those cities. We found a few instances where the alarms spanned across multiple facilities (Fig. V-B2). As an example, the AMS-IX outage [33] caused forwarding anomalies to links between 8 local facilities (see Sec.V-C1).
| Cities | Frankfurt | Amsterdam | London | Vienna | Tokyo |
|---|---|---|---|---|---|
| Alarms | 459 | 399 | 216 | 125 | 77 |
| Cities | Los Angeles | New York | Milano | Munich | Hong Kong |
| Alarms | 65 | 59 | 57 | 53 | 52 |
V-C Case Studies
To validate our system we looked for events in 2015 that were publicly disclosed either on mailing lists [34, 35] or by network operators. Usually the source of the outage and the entities affected are not made publicly available. In some cases, even the exact duration of the event is not reported, however local news websites and reports can provide good hints for an estimation. We discuss three major events that occurred in May and November 2015 that our system reports.
V-C1 Amsterdam Exchange Point (AMS-IX) Outage
In May-13 between 10:00-12:30 an outage at Amsterdam’s core Internet switch infrastructure [36] caused online problems in several parts of the Netherlands. According to news websites the cause was due to a technical fault inside the IXP [33]. Using our system we report up to 8 local facilities with an unusual low and an unsual high forwarding pattern. For example, the outage caused sharp decreases of the number of traceroutes towards Interxion Science Park (Fig. 8 (a)). Simultaneously, Science Park members seem to have used backup paths leading to facilities both inside (Fig. 8 (c)) and outside of the country (Fig. 8 (b)). We observe that the paths leading inside the country, towards Equinix AM7, did not revert back to their usual values probably because of new routes selected after the outage (Fig. 8 (c)).

Interxion Science Park

Interxion Frankfurt
V-C2 DDoS attack against DNS Root Servers
On November 30, 2015 from 6:50 to 9:30 UTC, and on December 1 from 05:10 to 6:10 UTC, the DNS root servers received an unusually high number of spoofed queries [37]. Each root server has been differently affected by this malicious traffic [38] but overall the DNS root infrastructure stayed operational during the attack.
Our system reports both delay and forwarding anomalies during the attack, mostly for links in Amsterdam (Fig. 9A-D) and London facilities (Fig. 9E). Fig. 9A indicates that the Global Switch links toward Digital Realty (Wenckebachweg) Amsterdam got affected during both attacks by a severe forwarding anomaly possibly due to overloaded routers. At the same time, between 06:00 and 09:00 UTC, we report links of the same facility towards Equinix Science Park(AM3) (Fig. 9B) with an unusual differential RTT but without an obvious change in the forwarding pattern.


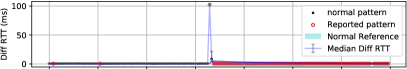

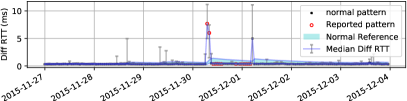
Links from Equinix Amsterdam South East(AM7) towards Equinix Science Park(AM3) also experienced high delays, possibly due to the same congested router in the far end facility (Fig. 9C). The increased traffic pattern during the same hour in Fig. 9D also confirms that the DNS service hosted near the Science Park handled queries of many other unresponsive services. These results corroborate with the results of [38] reporting that many of those services were stressed by sustained traffic during the attack period. It is important also to note that although the two attacks were chronologically close events, the impact of the first one was much stronger for the Amsterdam facilities. During the second attack no RTT change was observed and only routing anomalies were reported.
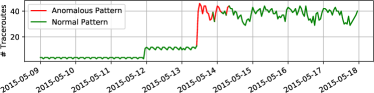
V-C3 Telecity Sovereign House outage
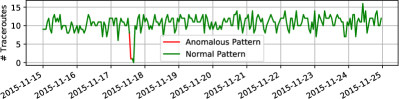
On November 17, 2015, a power outage affected London’s Sovereign House facility where both its primary and secondary supplies failed to start up. No official announcement was made but reports from network operators appeared around 2PM local time [39] and continued until the night of the 18th[40]. Although the visibility of this facility is limited in our datasets, during the outage our system reports a clear drop in the number of traceroutes between London’s Sovereign House facility and Telehouse-London(Docklands East) (Fig. 10). This illustrates the benefits of the our system to detect outages although the number of traceroutes crossing the facility might be low.
Using the proposed colocation facility detection and anomaly detection algorithms, we can evaluate the impact of these events on the physical infrastructure. These insights are not available to previous anomaly detection work [14] as they work only at the IP-layer.
VI Limitations
VI-A Facility Identification
In large cities multiple facilities may be connected via cross connect links. When constraining the facility search through alias resolution, the alias ASN may be a member of another facility. For example, in Fig.1D if is observed in traceroutes then the identification of the near-end may fail: .
When searching for the far-end facility, we assume that the AS connected to the IXP is given by the second IP in the far-end IP pair. Our current implementation maps IP addresses to ASN by simply matching the longest prefix from Routeviews data. But if this IP belongs to an inter-AS link we might infer a wrong ASN. This issue could be addressed by methods like MAP-IT[41] which is something we are planning to investigate in future work.
VI-B Live Monitoring Limitations
Our system requires multiple vantage points and a common repository to collect all traceroute results (i.e. Atlas probes and controllers for our current implementation). Outages appearing close to the data collection may prevent timely access to the data thus impair the performance of our system. This case happened during the AMS-IX outage as the RIPE infrastructure is mainly located in Amsterdam[36].
VII Conclusions
This work leverages large scale traceroute measurements to monitor the intricate peering world of colocation facilities. We devised a system that maps colocation facilities to traceroute data and monitors delay and forwarding anomalies at the facility level. The proposed system enables us to go beyond the usual IP-level monitoring as it offers unique inter and intra facility monitoring capabilities. To demonstrate its benefits we analyzed eight months of data from the RIPE Atlas measurement platform and reported important outages caused by DoS attacks, power outages, and mis-operations. We found outages that can span across up to eight facilities and last several hours. These results provide new insights about the physical locations of facility outages which are crucial for a better understanding of the peering ecosystem and reliable connectivity. Furthermore, they provide yet another input for operators to configure their traffic and avoid outages.
References
- [1] C. Labovitz, S. Iekel-Johnson, D. McPherson, J. Oberheide, and F. Jahanian, “Internet inter-domain traffic,” in ACM SIGCOMM Computer Communication Review, vol. 40, no. 4. ACM, 2010, pp. 75–86.
- [2] S. M. Besen and M. A. Israel, “The evolution of internet interconnection from hierarchy to “mesh”: Implications for government regulation,” Information Economics and Policy, vol. 25, no. 4, pp. 235–245, 2013.
- [3] N. Chatzis, G. Smaragdakis, A. Feldmann, and W. Willinger, “There is more to ixps than meets the eye,” ACM SIGCOMM Computer Communication Review, vol. 43, no. 5, pp. 19–28, 2013.
- [4] P. Gill, M. Arlitt, Z. Li, and A. Mahanti, “The flattening internet topology: Natural evolution, unsightly barnacles or contrived collapse?” in International Conference on Passive and Active Network Measurement. Springer, 2008, pp. 1–10.
- [5] B. Ager, N. Chatzis, A. Feldmann, N. Sarrar, S. Uhlig, and W. Willinger, “Anatomy of a large european ixp,” ACM SIGCOMM Computer Communication Review, vol. 42, no. 4, pp. 163–174, 2012.
- [6] M. Z. Ahmad and R. Guha, “Studying the effect of internet exchange points on internet link delays,” in Proceedings of the 2010 Spring Simulation Multiconference. Society for Computer Simulation International, 2010, p. 103.
- [7] V. Giotsas, C. Dietzel, G. Smaragdakis, A. Feldmann, A. Berger, and E. Aben, “Detecting peering infrastructure outages in the wild,” in Proceedings of the Conference of the ACM Special Interest Group on Data Communication. ACM, 2017, pp. 446–459.
- [8] “De-cix world record as seen on de-cix news,” 12 2017.
- [9] A. Henthorn-Iwane, “Understanding internet exchanges via the de-cix outage,” https://blog.thousandeyes.com/network-monitoring-de-cix-outage/.
- [10] V. Giotsas, G. Smaragdakis, B. Huffaker, M. Luckie et al., “Mapping peering interconnections to a facility,” in Proceedings of the 11th ACM Conference on Emerging Networking Experiments and Technologies. ACM, 2015, p. 37.
- [11] K. G. Anagnostakis, M. Greenwald, and R. S. Ryger, “cing: Measuring network-internal delays using only existing infrastructure,” in INFOCOM 2003, vol. 3. IEEE, 2003, pp. 2112–2121.
- [12] R. Mahajan, N. Spring, D. Wetherall, and T. Anderson, “User-level Internet path diagnosis,” SOSP’03, vol. 37, no. 5, pp. 106–119, 2003.
- [13] L. Deng and A. Kuzmanovic, “Monitoring persistently congested internet links,” in Network Protocols, 2008. ICNP 2008. IEEE International Conference on. IEEE, 2008, pp. 167–176.
- [14] R. Fontugne, C. Pelsser, E. Aben, and R. Bush, “Pinpointing delay and forwarding anomalies using large-scale traceroute measurements,” in Proceedings of the 2017 Internet Measurement Conference. ACM, 2017, pp. 15–28.
- [15] V. Giotsas, C. Dietzel, G. Smaragdakis, A. Feldmann, A. Berger, and E. Aben, “Detecting peering infrastructure outages in the wild,” in Proceedings of the Conference of the ACM Special Interest Group on Data Communication. ACM, 2017, pp. 446–459.
- [16] R. Motamedi, B. Chandrasekaran, B. Maggs, R. Rejaie, and W. Willinger, “On the geography of x-connects,” Technical Report CIS-TR-2014-02. University of Oregon, Tech. Rep., 2014.
- [17] I. Castro, J. C. Cardona, S. Gorinsky, and P. Francois, “Remote peering: More peering without internet flattening,” in Proceedings of the 10th ACM International on Conference on emerging Networking Experiments and Technologies. ACM, 2014, pp. 185–198.
- [18] R. Chandra, P. Traina, and T. Li, “Bgp communities attribute,” Tech. Rep., 1996.
- [19] “Ripe atlas build-in msms,” https://atlas.ripe.net/docs/built-in/.
- [20] “Peeringdb,” https://peeringdb.com/.
- [21] “Caida internet topology data kit,” http://www.caida.org/data/internet-topology-data-kit/.
- [22] G. Nomikos and X. Dimitropoulos, “traixroute: Detecting ixps in traceroute paths,” in International Conference on Passive and Active Network Measurement. Springer, 2016, pp. 346–358.
- [23] “Caida’s midar alias resolution,” http://www.caida.org/tools/measurement/midar/.
- [24] “Caida iffinder tool,” http://www.caida.org/tools/measurement/iffinder/.
- [25] F. Golkar, T. Dreibholz, and A. Kvalbein, “Measuring and comparing internet path stability in ipv4 and ipv6,” in Network of the Future (NOF), 2014 International Conference and Workshop on the. IEEE, 2014, pp. 1–5.
- [26] G. Huston, “ipv6 protocol performance,” https://labs.ripe.net/Members/gih/examining-ipv6-performance.
- [27] A. Dhamdhere, M. Luckie, B. Huffaker, A. Elmokashfi, E. Aben et al., “Measuring the deployment of ipv6: topology, routing and performance,” in Proceedings of the 2012 Internet Measurement Conference. ACM, 2012, pp. 537–550.
- [28] R. Steenbergen, “A practical guide to (correctly) troubleshooting with traceroute,” North American Network Operators Group, pp. 1–49, 2009.
- [29] B. Augustin, X. Cuvellier, B. Orgogozo, F. Viger, T. Friedman, M. Latapy, C. Magnien, and R. Teixeira, “Avoiding traceroute anomalies with paris traceroute,” in Proceedings of the 6th ACM SIGCOMM conference on Internet measurement. ACM, 2006, pp. 153–158.
- [30] W. de Vries, J. J. Santanna, A. Sperotto, and A. Pras, “How asymmetric is the internet? a study to support the use of traceroute,” in Intelligent mechanisms for network configuration and security, ser. LNCS, vol. 9122. Springer, June 2015, pp. 113–125.
- [31] Y. Schwartz, Y. Shavitt, and U. Weinsberg, “On the diversity, stability and symmetry of end-to-end Internet routes,” in INFOCOM IEEE Conference on Computer Communications Workshops, 2010. IEEE, 2010, pp. 1–6.
- [32] V. Kotronis, R. Klöti, M. Rost, P. Georgopoulos, B. Ager, S. Schmid, and X. Dimitropoulos, “Stitching inter-domain paths over ixps,” in Proceedings of the Symposium on SDN Research. ACM, 2016, p. 17.
- [33] “2015-05-13 amsterdam outage,” https://nltimes.nl/2015/05/13/outage-amsterdam-internet-hub-affects-much-netherlands.
- [34] “The nanog outage list,” https://mailman.nanog.org/mailman/listinfo/nanog.
- [35] “outages list,” https://puck.nether.net/mailman/listinfo/outages.
- [36] R. Kisteleki, “Ams outage as seen from ripe atlas,” https://labs.ripe.net/Members/kistel/the-ams-ix-outage-as-seen-with-ripe-atlas.
- [37] R. S. Operators, “Events of 2015-11-30,” 2015.
- [38] G. Moura, R. Schmidt, W. B. Heidemann, J. Vries, M. Muller, L. Wei, and C. Hesselman, “Anycast vs. ddos: Evaluating the november 2015 root dns event,” in Proceedings of the 2016 Internet Measurement Conference. ACM, 2016, pp. 255–270.
- [39] “First reports of sovereign house outage,” https://www.theregister.co.uk/2015/11/17/telecity_voip_outage/.
- [40] “2nd day reports of sovereign house outage,” https://www.theregister.co.uk/2015/11/18/telecity_outage_fix_failed/.
- [41] A. Marder and J. M. Smith, “Map-it: Multipass accurate passive inferences from traceroute,” in Proceedings of the 2016 Internet Measurement Conference. ACM, 2016, pp. 397–411.